Team:Bielefeld-Germany/Results/Characterization/K389004
From 2010.igem.org
Contents |
Characterization of <partinfo>K389004</partinfo>
On this page the experiments and results that lead to the <partinfo>K389004</partinfo> characterization data presented on our characterization page are shown in detail.
Accumulation of luciferase
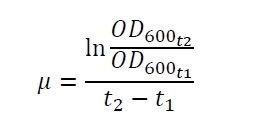
The production of the reporter gene luciferase by Escherichia coli is dependent from the specific growth rate µ (fig. 1A, eq. (2)) and the growth phase (fig. 1B). Fig. 1A shows the specific production rate qP which was determined with equation (1)
with the amount of product P, the cell count X and the relative luminescence units RLU plotted against the specific growth rate µ which was determined with equation (2)
With decreasing growth rate the luciferase production slows down and with stopping growth the luciferase is degraded. Especially in the stationary growth phase the luciferase degradation is high (fig. 1B).
Kinetic of luciferin conversion
Look up the general luminescence measurement protocol here.
To determine the ideal time of RLU measurement after adding luciferin to the cell lysate a kinetic of this reaction was recorded with the luminometer (fig. 2). A maximum is seen between 20 - 40 s. So a measurement with a delay of at least 20 s from the time luciferin is added to the cell lysate is recommended. In addition, the time between adding the luciferin to the cell lysate and the measurement should not be more than 40 s.
Sensitivity
To determine the sensitivity of the reporter gene luciferase the limit of detection (LOD) and the limit of quantification (LOQ) are calculated. For this calculation the noise (standard derivation sR) and the arithmetic mean (xR) of the reference measurement, so cells without luciferase gene, are collected. Afterwards the LOD is calculated with equation (3) and the LOQ with equation (4):
The LOD is 162 RLU and the LOQ is 306 RLU. This equals 0.3 % and 0.7 %, respectively, of the maximal RLU measured with a luciferase gene under the control of the weak constitutive promoter <partinfo>J23103</partinfo> in <partinfo>pSB1A2</partinfo> (measured with part <partinfo>K389302</partinfo> in <partinfo>pSB1A2</partinfo>). So the luciferase is a very sensitive reporter gene.
mRFP vs. luciferase as reporter gene
In the following table a short comparison between luciferase and mRFP as reporter genes for promoter activity is shown. A (+) means high and a (-) means low. Click on a (+) or (-) in the table to see the adequate results.
| Parameter | Luciferase | mRFP |
|---|---|---|
| Sensitivity | (+) | (-) |
| Stability | (-) | [http://partsregistry.org/PBAD_Promoter_Family#Expression_Rate (+)] |
| Response time | (+) | [http://partsregistry.org/PBAD_Promoter_Family#Expression_Rate (-)] |
| Degradation | (+) | [http://partsregistry.org/PBAD_Promoter_Family#Expression_Rate (-)] |
| Reproducibility | (-) | (+) |
| Growth dependent | (+) | (+) |
| Costs / work | (+) | (-) |
| Sample volume | (-) | (+) |
| Online measuring | (-) | [http://partsregistry.org/Part:BBa_F2620:Experience#Growth_conditions (+)] |
References
http://www.promega.com/tbs/tb281/tb281.pdf
 "
"


