Team:Bielefeld-Germany/Results/Characterization/K389016
From 2010.igem.org
Contents |
Characterization of <partinfo>K389016</partinfo>
On this page the experiments and results that lead to the <partinfo>K389016</partinfo> characterization data presented on our characterization page are shown in detail.
Growth functions and mRFP expression for <partinfo>K389016</partinfo>
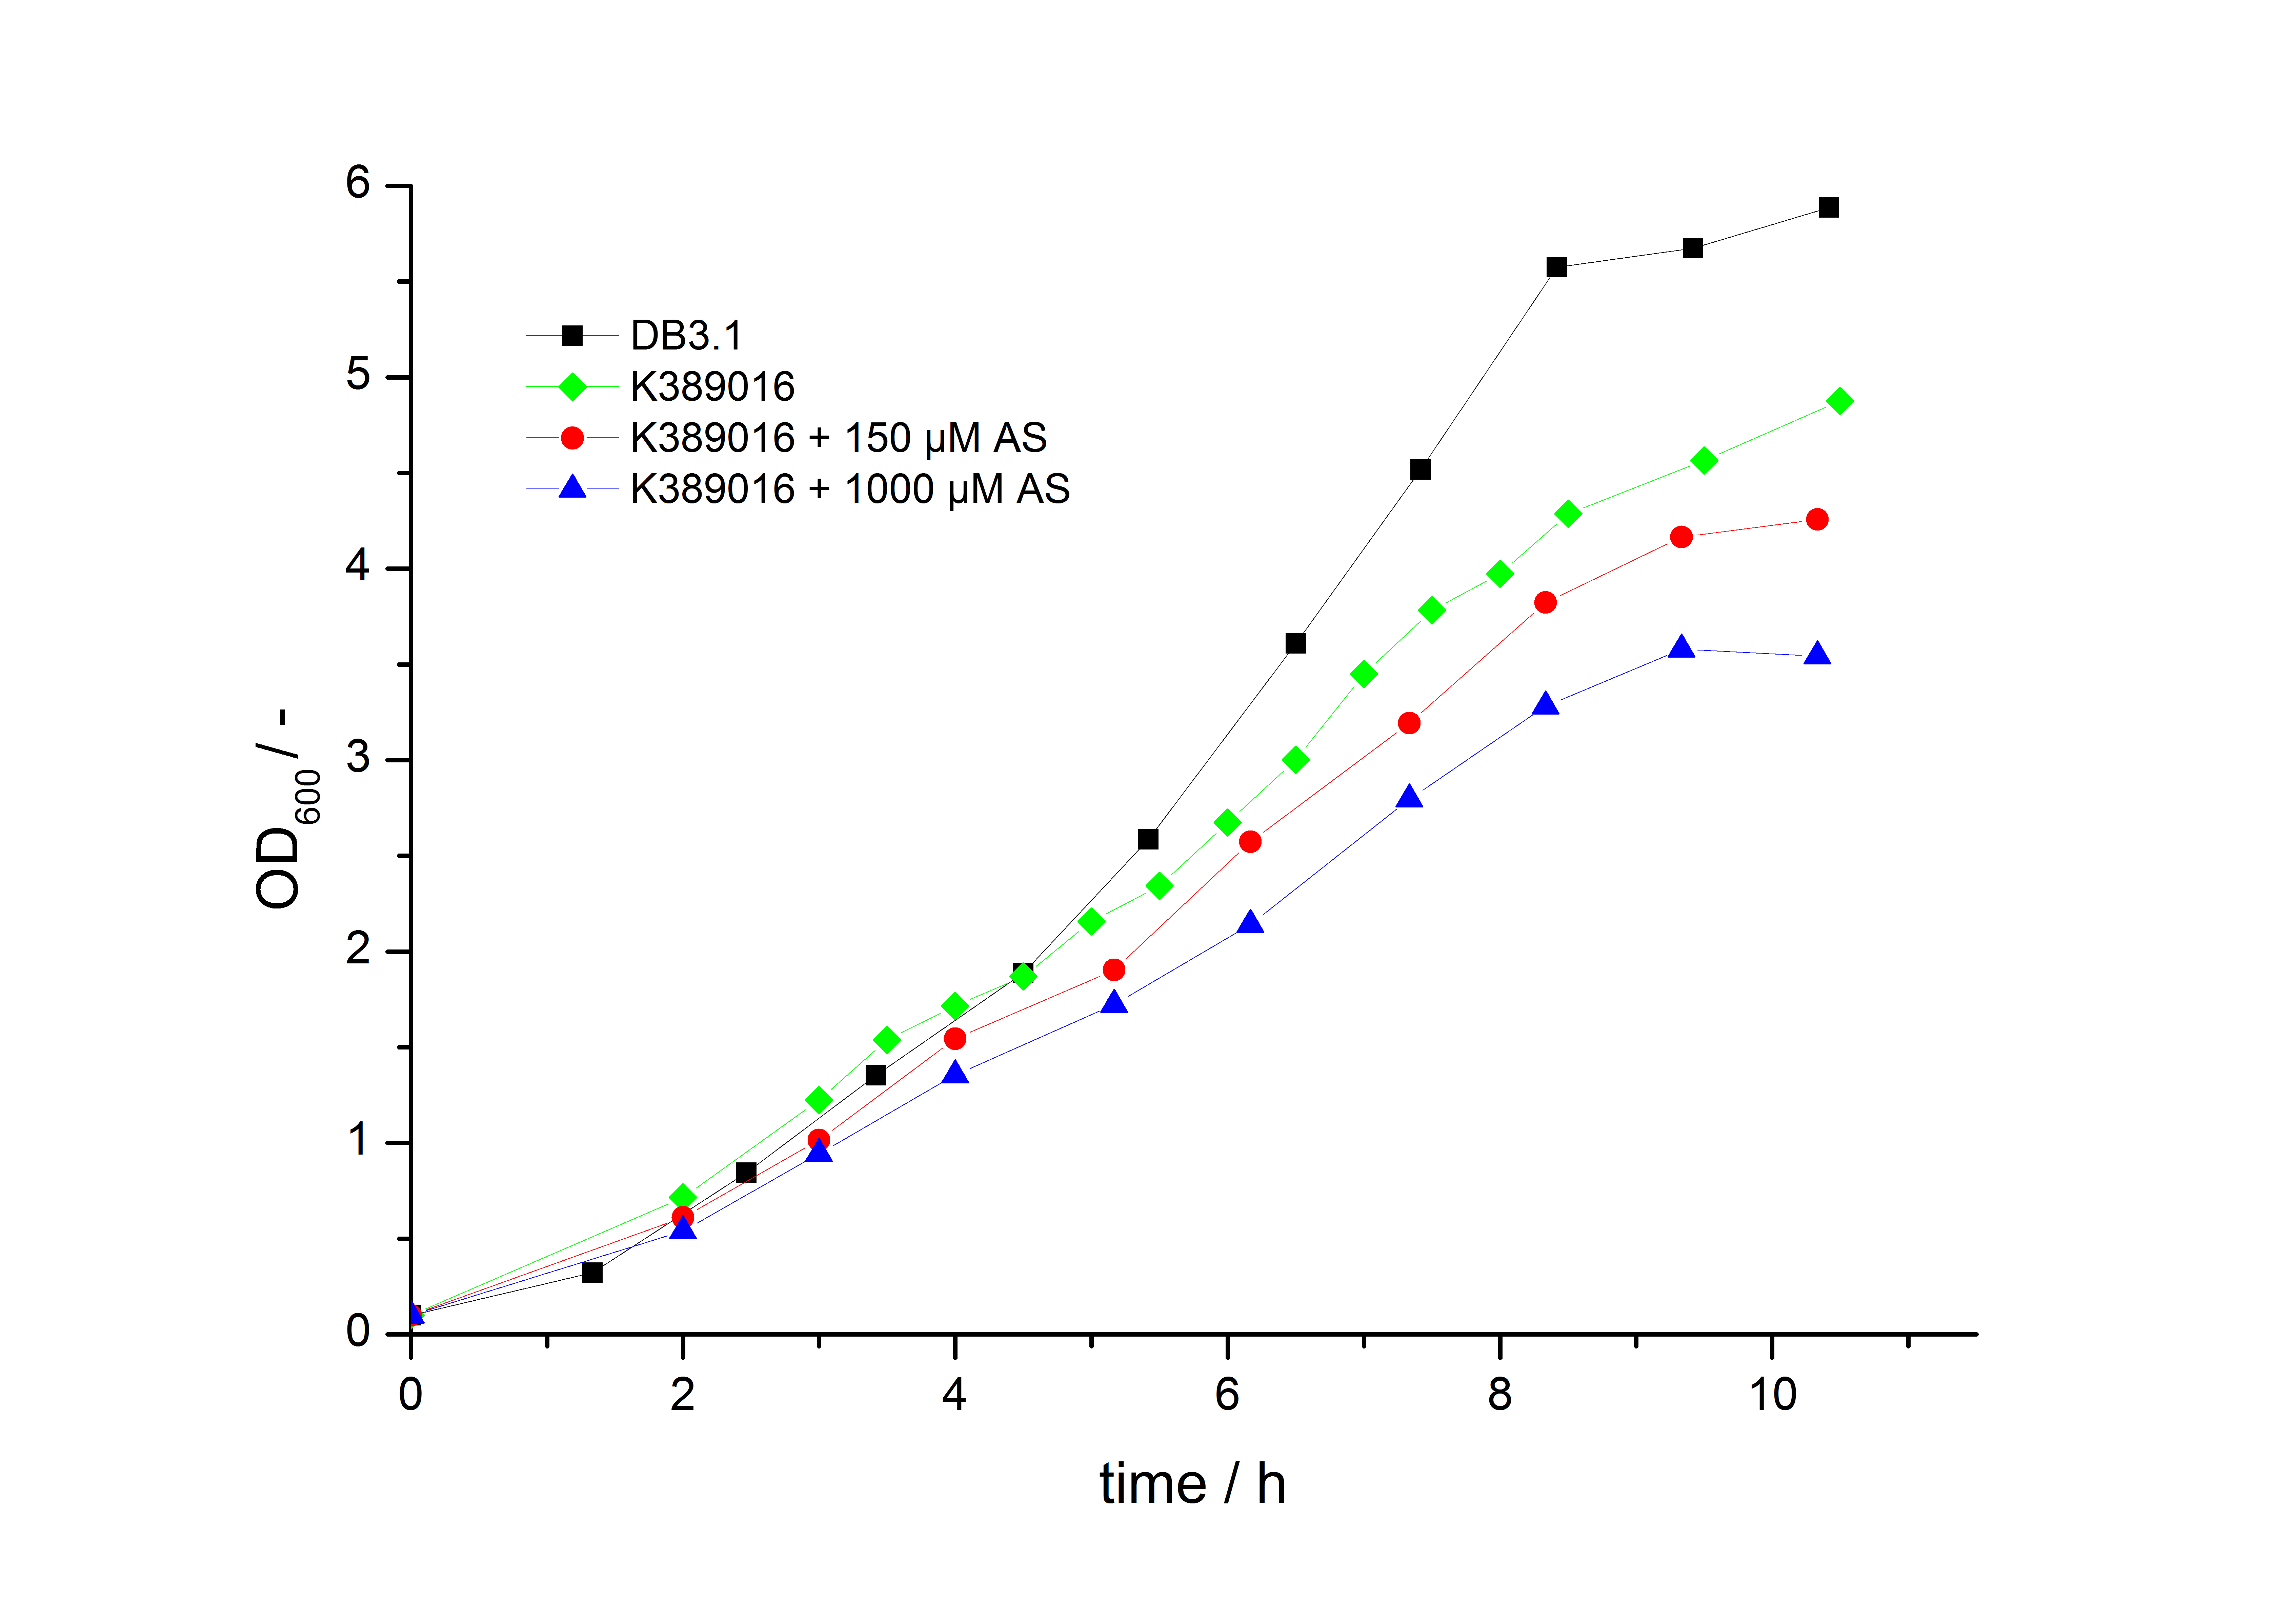
To characterize this part we performed several cultivations with different concentrations of acetosyringone as inducer and measured the fluorescence emitted by mRFP (Protocol). We used Escherichia Coli DB3.1 carrying the pSB1C3::K389016 plasmid. Even without inducer the bacteria, carrying the plasmid showed decelerated growth. In addition acetosyringone affected the growthrates (we used a stocksolution of 20 mM acetosyringone solved in 10 % (v/v) DMSO). Growth curves, averaged specific growth rates and doubling times are shown below. It can be observed, that E.coli carrying the pSB1C3::K389016 plasmid growths nearly linear.
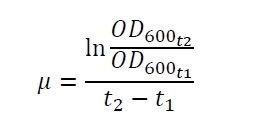
The specific growth rates µ and doubling times td are calculated with the OD600 and following formulas:
Table 1: Averaged specific growth rates and doubling times for cultivations of E. coli DB3.1 without plasmid and carrying <partinfo>K389016</partinfo> with different acetosyringone concentrations in LB medium with 10 mg ml-1 chloramphenicol.
| E. coli DB3.1 | µ / h-1 | td / h |
|---|---|---|
| without plasmid | 0.35 | 1.98 |
| carrying K389016 | 0.27 | 2.57 |
| carrying K389016 with 150 µM acetosyringone | 0.25 | 2.77 |
| carrying K389016 with 1000 µM acetosyringone | 0.23 | 3.01 |
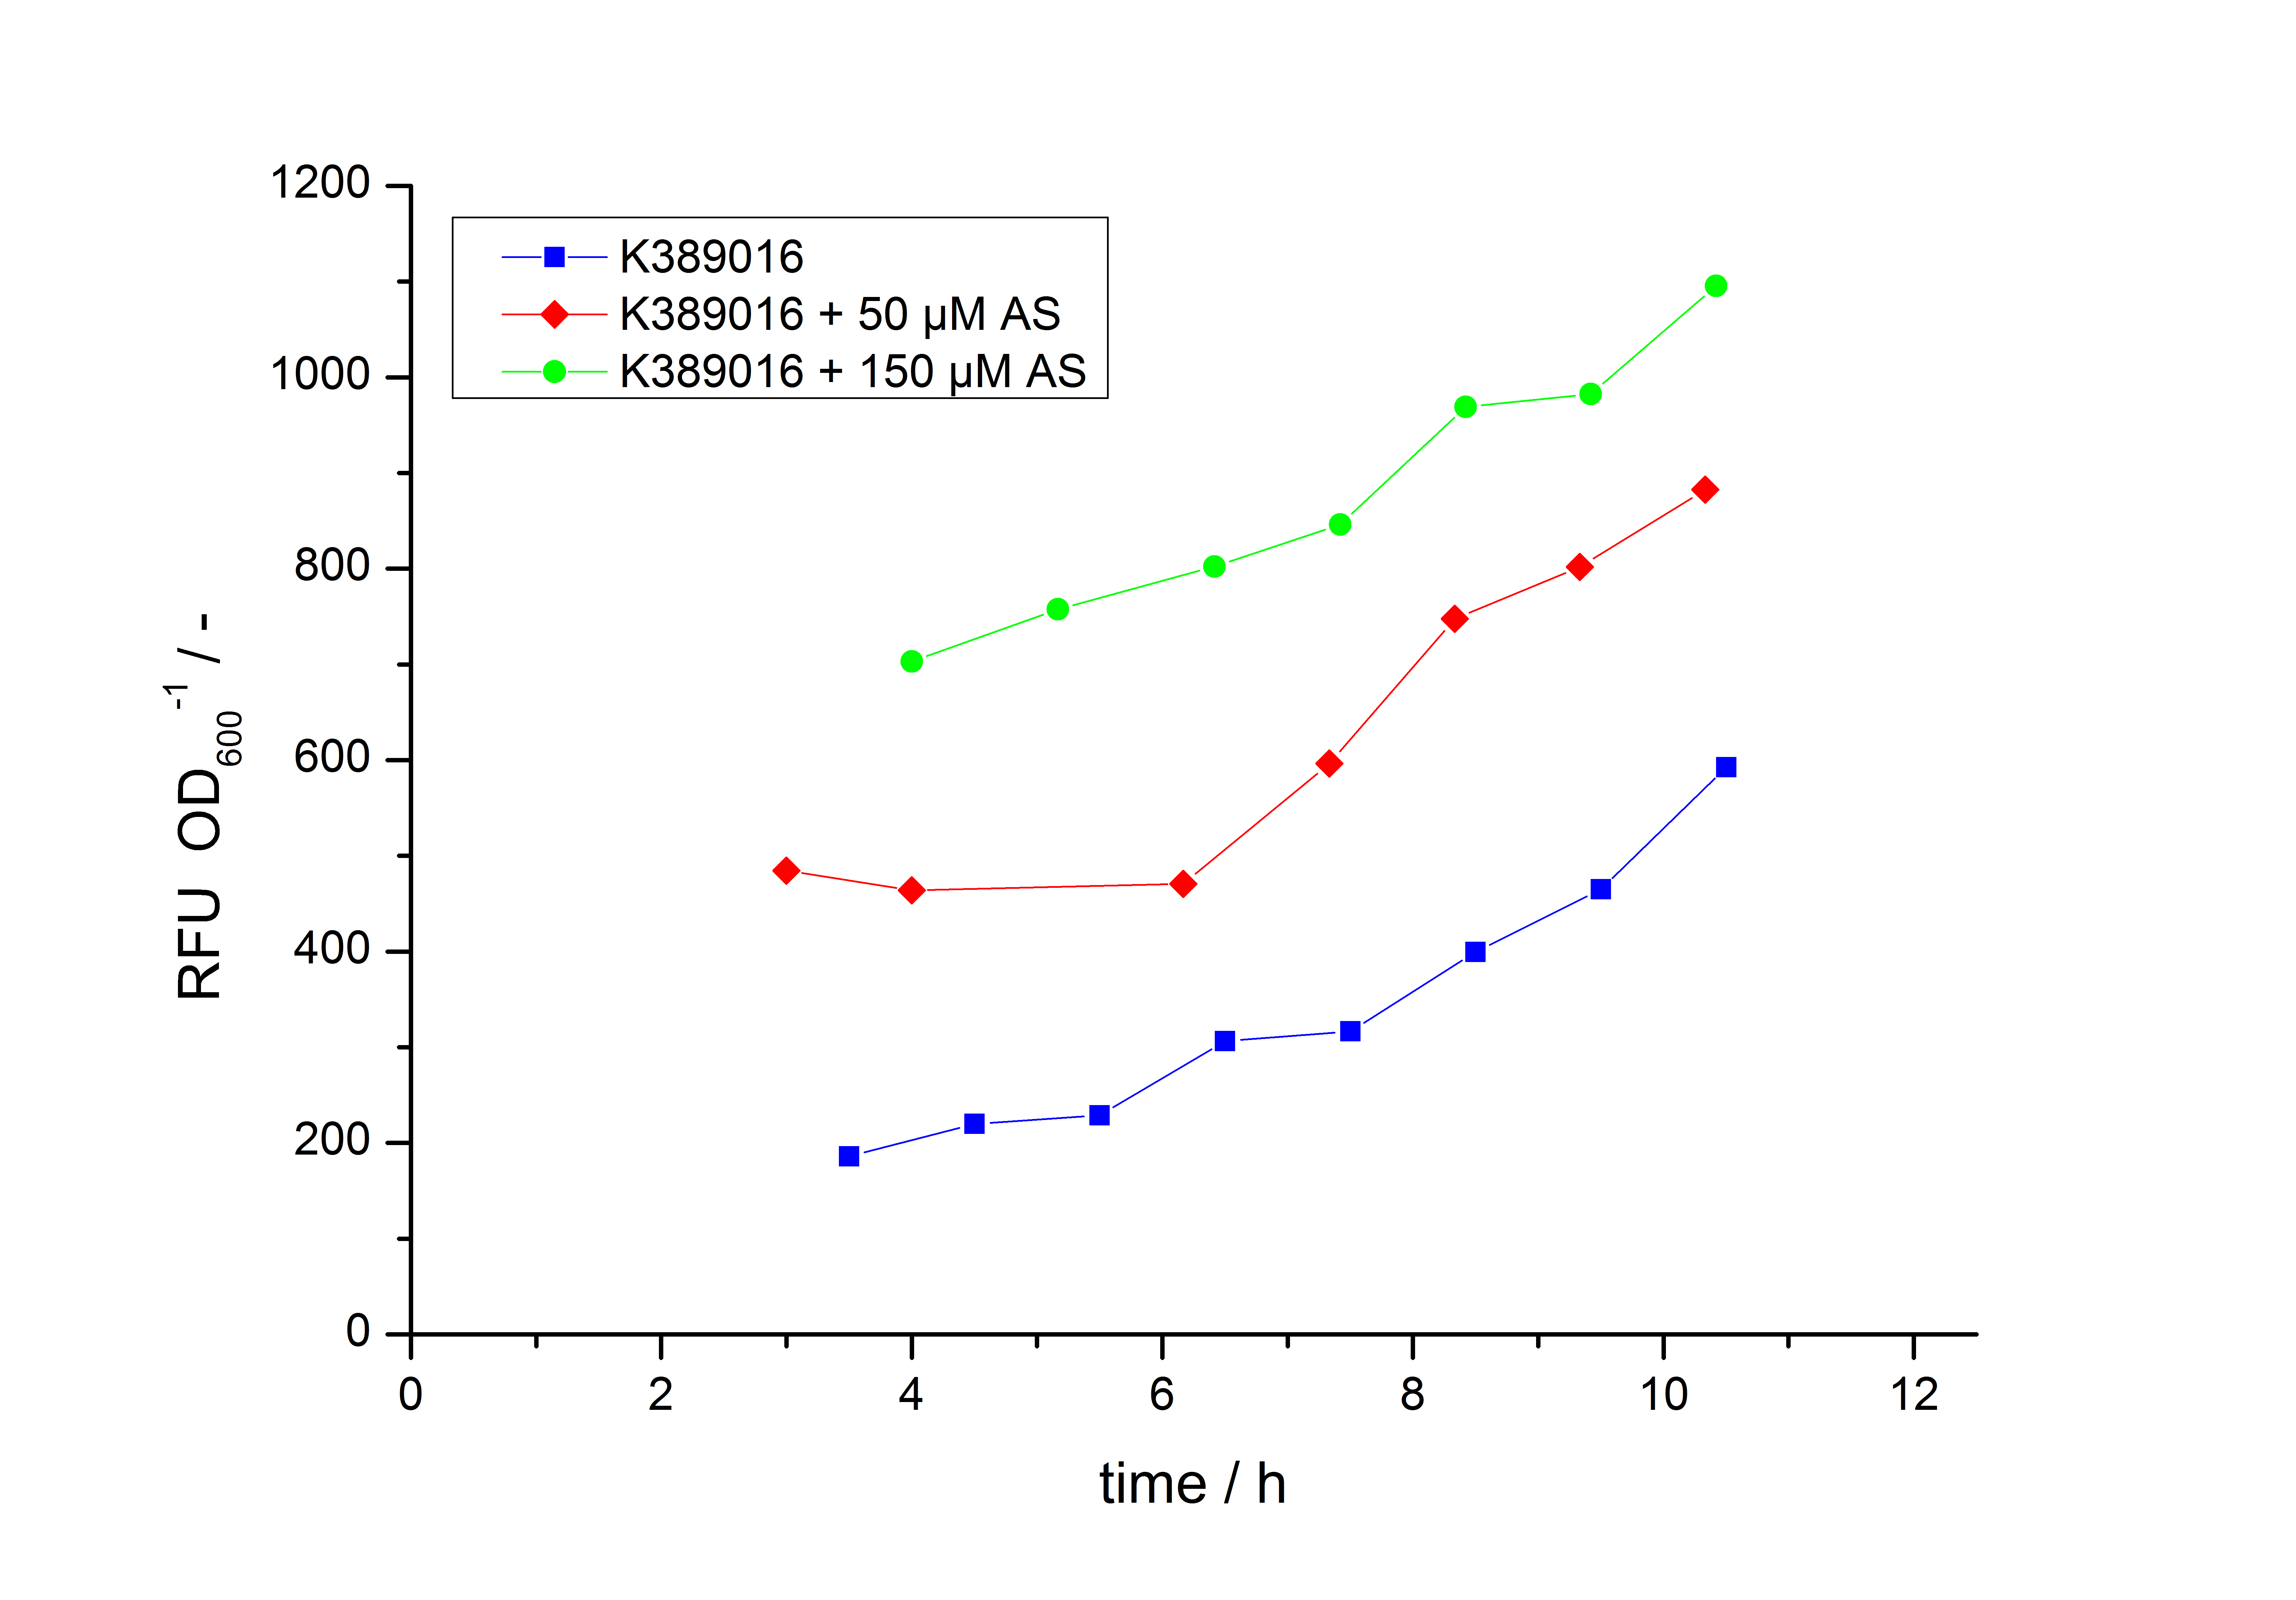
Exemplary induction curves with the fluorescence normalized to OD600 are shown in Fig.2. We observed a basal Transcription, but the Induction with acetosyringone is undoubtedly. The detailed data analysis and transfer function is described below.
Transfer function of <partinfo>K389016</partinfo>
The data for the transfer function was measured and analyzed as described below. The data was fitted with a dose response function of the form
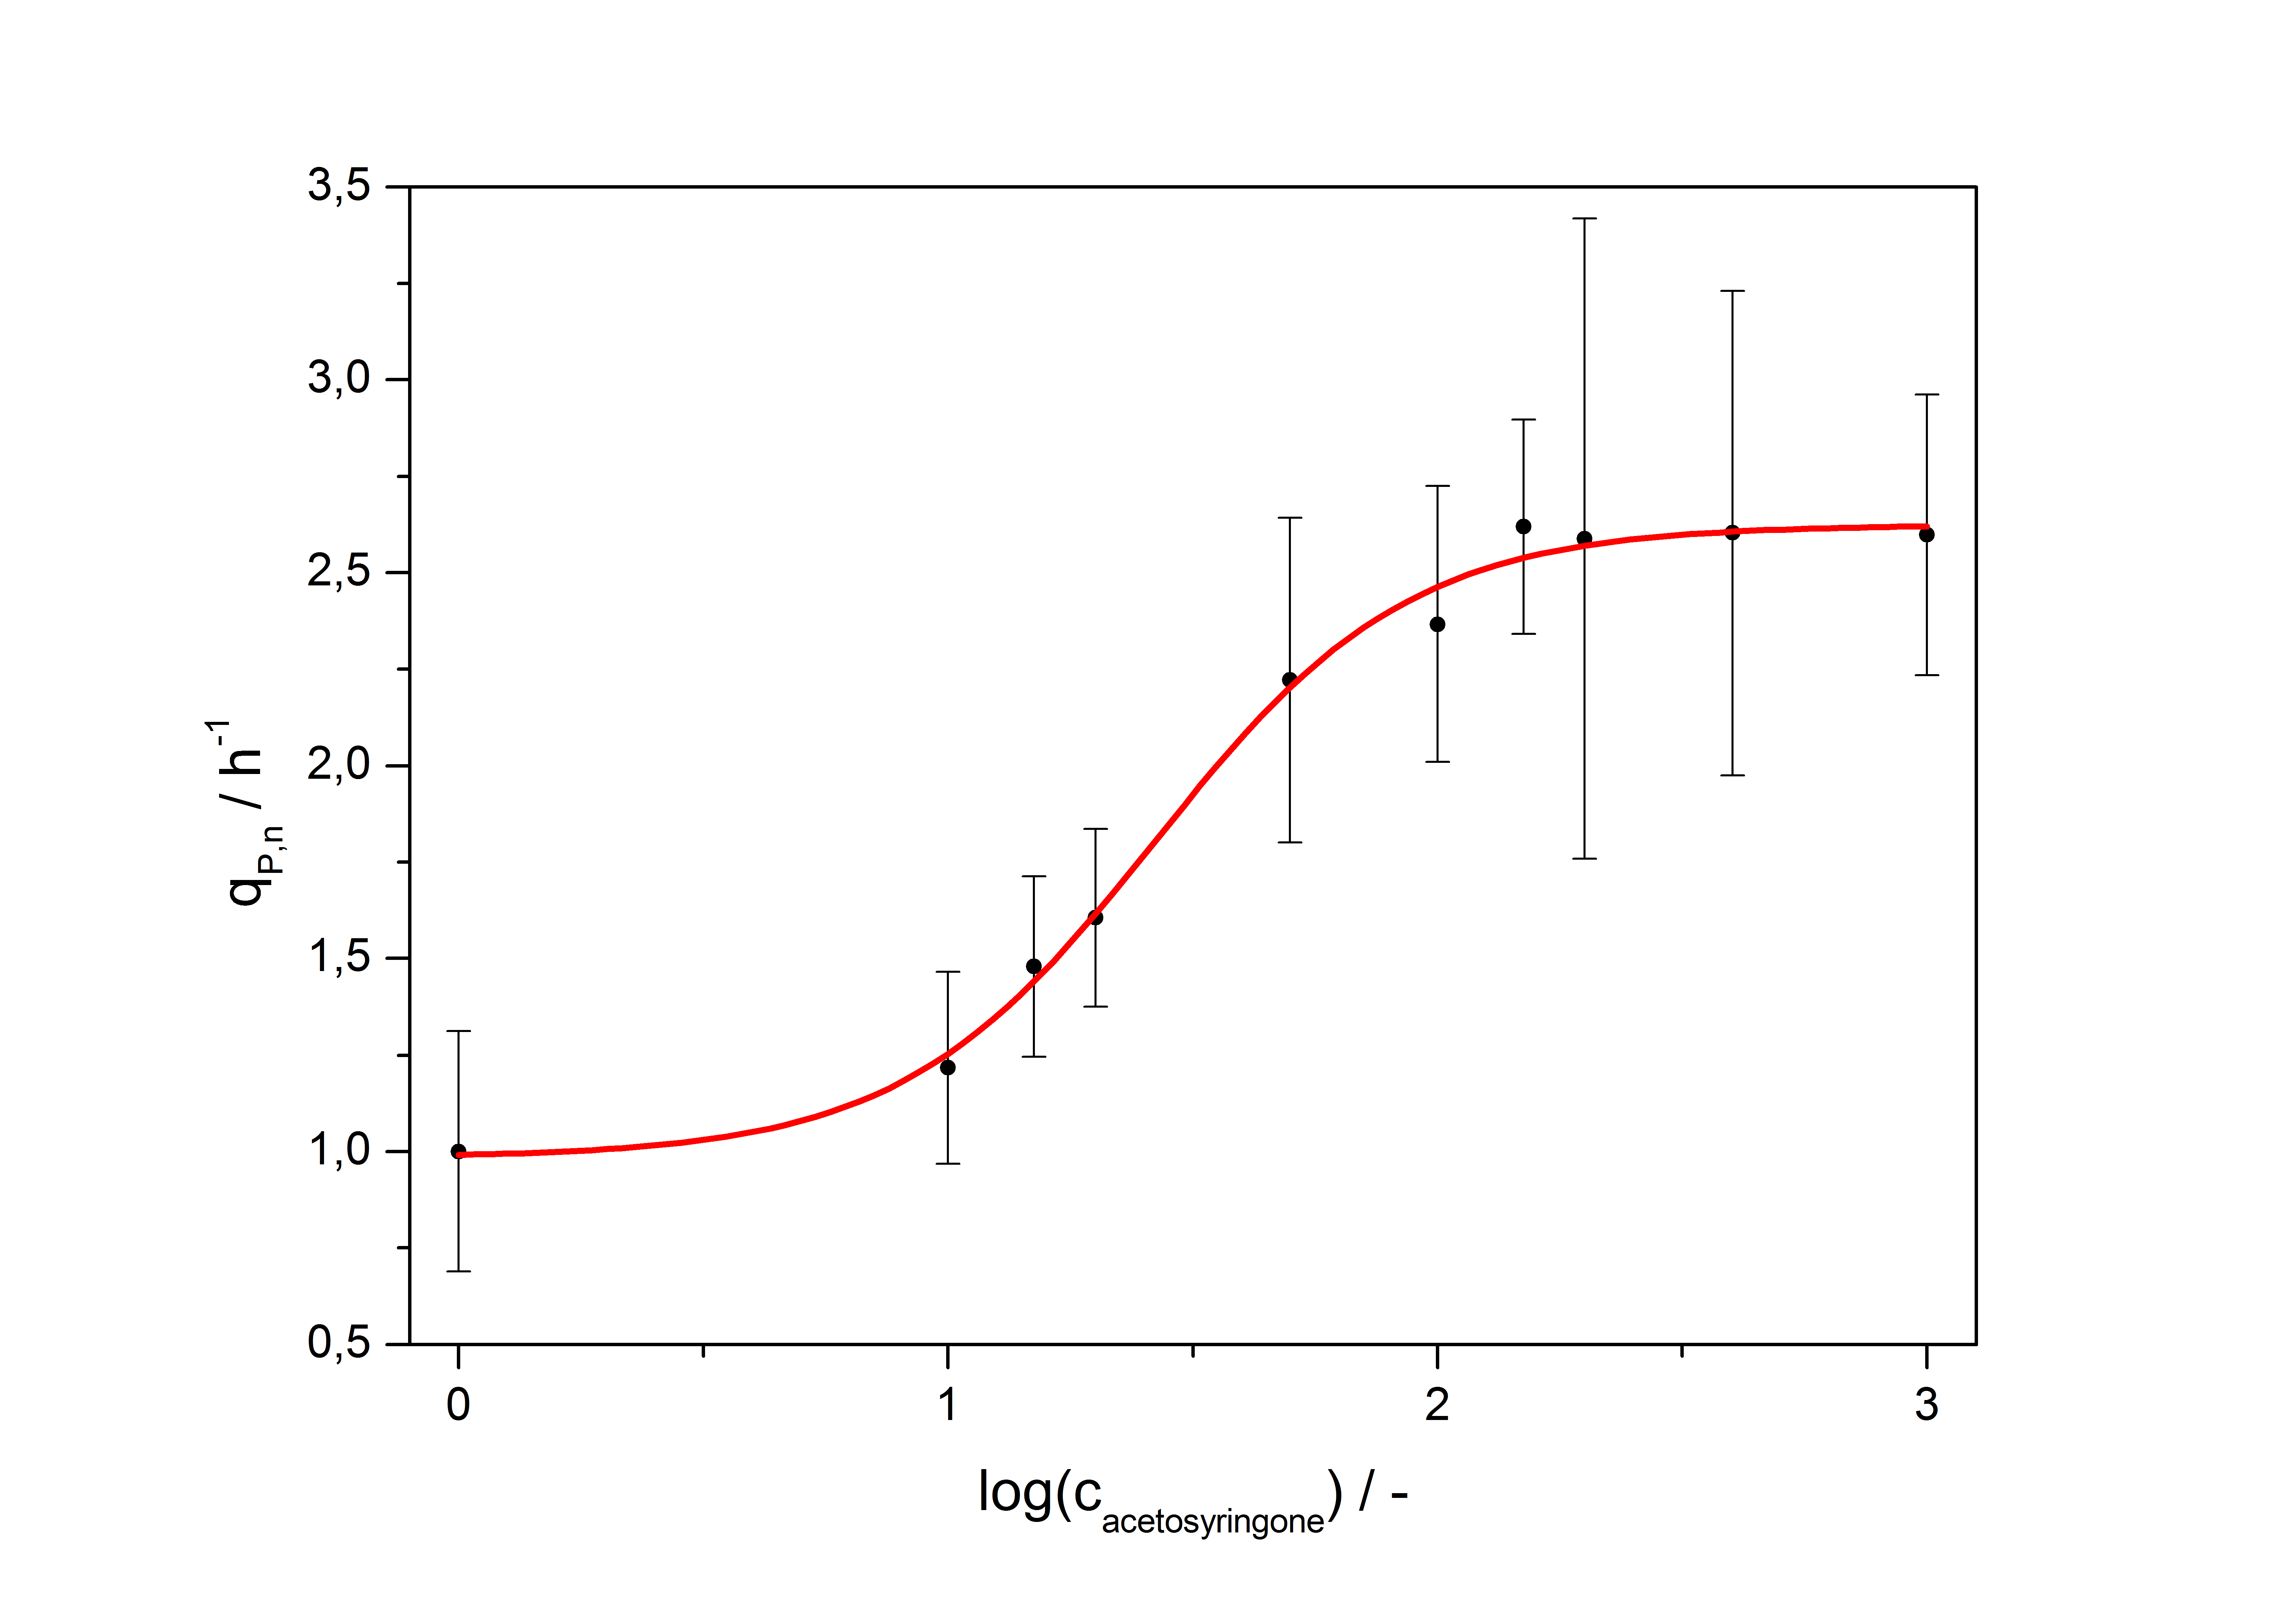
with the Hill coefficient p, the bottom asymptote A1, the top asymptote A2 and the switch point log(x0). Figure 1 shows the measured normalized specific production rates qP,n (eq. 8) plotted against the logarithm of the concentration of the inductor [http://www.chemblink.com/products/2478-38-8.htm acetosyringone] in µM. The fit has an R2 = 0.99.
The important data from the transfer function is summarized in table 1:
Table 1: Data from the transfer function for the part <partinfo>K389016</partinfo>.
| Parameter | Value |
|---|---|
| Hill coefficient | 1.673 |
| [http://partsregistry.org/Switch_Point Switch point] | 26.5 µM |
| Top asymptote | 2.62 |
So the fully induced VirA/G signaling system has a 2.6 fold increased expression compared to the uninduced system. The Hill coefficient is > 1, so a positive cooperation can be observed ([http://www.sciencedirect.com/science?_ob=ArticleURL&_udi=B6WMD-4V42JG5-1&_user=10&_rdoc=1&_fmt=&_orig=search&_sort=d&_docanchor=&view=c&_acct=C000050221&_version=1&_urlVersion=0&_userid=10&md5=b6431553217aca1129c5b441f4b78425 D Chu et al., 2009]). The [http://partsregistry.org/Switch_Point switch point] of the system is at about 25 µM, so this is the concentration at which the device output is 50% of the maximum output.
Data analysis for <partinfo>K389016</partinfo>
The data analysis is made in three steps. First step is the processing of the fluorescence raw data gained by the fluorescence plate reader for every sample:
In the second step the RFUcorrected of every sample is plotted against the cultivation time it was drawn. The data is fitted by an exponential fit of the following style:
The accumulation of mRFP in the cells is always exponential. A typical fitted product accumulation curve is shown below:
The product accumulation in a cultivation can be described as:
with the amount of product P, the cell count X and the specific production rate qP.
RFU is commensurate to the concentration of mRFP (P) and the OD600 is commensurate to the cell count (X) ( Canton and Labno, 2004):
With these assumptions it is possible to calculate the specific production rate of mRFP qP in the third step: the specific production rate for every sample of a cultivation is calculated by the derivation of the exponential fit line which describes the accumulation of product in the culture (dRFU/dt) and the measured OD600 data:
The specific production rates qP of all samples of all cultivations made with a specific inductor concentration c are averaged and normalized against the specific production rate of the uninduced system qP,0:
This normalized specific production rate we calculated is commensurate to relative promotor units (RPU) which is commensurate to PoPS (polymerase per seconds) ([http://partsregistry.org/Part:BBa_F2620:Experience/Endy/Data_analysis Canton and Labno, 2004]; [http://partsregistry.org/Part:BBa_J23101:Experience Pasotti et al., 2009]):
Plasmid conformation analysis
A plasmid conformation analysis for the BioBrick <partinfo>K389016</partinfo> in <partinfo>pSB1C3</partinfo> was performed by the [http://web.plasmidfactory.com/de/ PlasmidFactory] by Capillary Gel Electrophoresis (CGE). The chromatogram is shown in fig. 5 and the results in tab. 3. The data shows a high percentage of covalently closed circular (ccc) plasmid DNA. This is the biological active shape of plasmids so a high percentage of ccc plasmid DNA indicates a high quality of plasmid DNA ([http://web.plasmidfactory.com/en/service_CGE.html PlasmidFactory]).
Table 3: Data from the CGE of the BioBrick <partinfo>K389016</partinfo> in <partinfo>pSB1C3</partinfo> performed by the [http://web.plasmidfactory.com/de/ PlasmidFactory] (Bielefeld).
| Conformation | Ratio / % |
|---|---|
| ccc monomer | 91.2 |
| ccc dimer | 3.2 |
| oc | 5.6 |
Different possible inducers
A list of testet possible inducers for a VirA/G signaling system is shown in tab. 4. These inducers where testet as a mix. The specific production rate of mRFP qP measured as described above for the mix did not significantly differ from the synthesis rate of the uninduced system (t-Test, p < 0.005). So none of the possible inducers listet in tab. 4 induce the VirA/G signaling system significantly in the measured concentration range. In tab. 4 the chemical structures of the testet possible inducers are shown, too. Acetosyringone is also in tab. 4 although it was not testet in the inducer mix to show the chemical similarity of the testet possible inducers to the natural inducer of the VirA/G signaling system.
For more information about the possible inducers click here.
Table 4: Testet possible inducers for a VirA/G signaling system and acetosyringone with concentrations and chemical structure that were tested.
| Inducer | Concentration / µM | Chemical structure |
|---|---|---|
| Capsaicin | 200 | 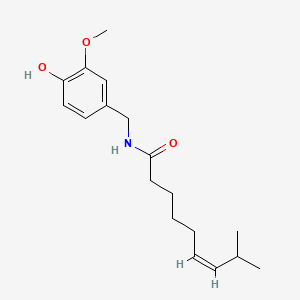
|
| Dopamine | 200 | 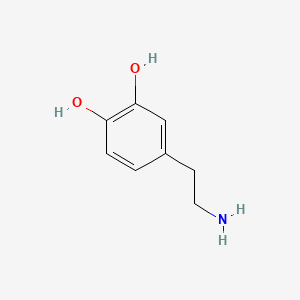
|
| Homovanillic acid | 200 | 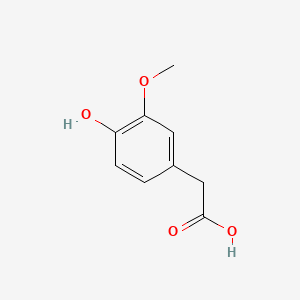
|
| 3-Methoxytyramine | 200 | 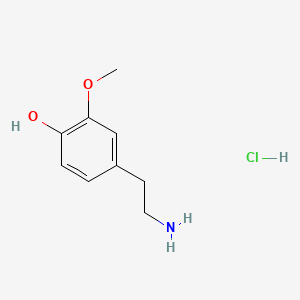
|
| Acetosyringone | 200 | 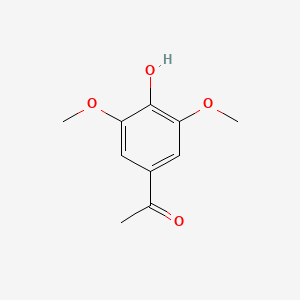
|
References
Canton B and Labno A (2004) [http://partsregistry.org/Part:BBa_F2620:Experience/Endy/Data_analysis Data processing of Part BBa_F2620].
Chu D, Zabet NR, Mitavskiy B (2009) [http://www.sciencedirect.com/science?_ob=ArticleURL&_udi=B6WMD-4V42JG5-1&_user=10&_rdoc=1&_fmt=&_orig=search&_sort=d&_docanchor=&view=c&_acct=C000050221&_version=1&_urlVersion=0&_userid=10&md5=b6431553217aca1129c5b441f4b78425 Models of transcription factor binding: Sensitivity of activation functions to model assumptions], J Theor Biol 257(3):419-429.
Pasotti L, Zucca S, Del Fabbro E (2009) Characterization experiment on BBa_J23100, BBa_J23101, BBa_J23118, http://partsregistry.org/Part:BBa_J23101:Experience.
[http://web.plasmidfactory.com/en/service_CGE.html PlasmidFactory]
 "
"


