Team:Bielefeld-Germany/Results/Characterization
From 2010.igem.org
We entered the following BioBricks to the partsregistry:
<groupparts>iGEM010 Bielefeld-Germany</groupparts>
<partinfo>K238008</partinfo>: virA
We wanted to use this part in our project, but could only obtain unexpected/faulty restriction patterns. Finally we chose to sequence the part, hoping to find the cause for the maintained restriction patterns. Unfortunately we could not approve the sequence of <partinfo>BBa_K238008</partinfo> deposited in the parts registry so that we chose to design our own VirA BioBrick. I strongly recommend using our VirA since it has been approved by multiple means, e.g. restriction patterns and sequencing (<partinfo>K389001</partinfo>).
<partinfo>BBa_K238011</partinfo>: vir-promoter
We made a restriction analysis and sequenced parts of this BioBrick.
<partinfo>P1010</partinfo>: ccdB-gene
The ccdB gene targets the gyrase of Escherichia coli and is lethal for all E. coli strains without the gyrase mutation gyrA462 [1]. The ccdB BioBrick is used for the 3A-assembly as a positive selection marker. We transformed this BioBrick into E. coli JM109, DH5α, TOP10, XL1-Blue, EC100D and DB3.1. E. coli JM109, XL1-Blue and DH5α seem to be ccdB resistant because there were as much colonies after P1010 transformation as observed with DB3.1. The P1010 works as expected in E. coli TOP10, EC100D (no colonies after transformation) and DB3.1 (many colonies after transformation).
Table 1: Results of the transformation of the cell-death gene ccdB, BioBrick <partinfo>P1010</partinfo>, into different strains of E. coli.
| E. coli strain | Resistant to ccdB? | Expected result? | Gyrase genotype [2,3] |
|---|---|---|---|
| DB3.1 | yes | yes | gyrA462 |
| DH5α | yes | no | gyrA96 |
| EC100D | no | yes | WT |
| JM109 | yes | no | gyrA96 |
| TOP10 | no | yes | WT |
| XL1-Blue | yes | no | gyrA96 |
It seems that not only the gyrase mutation gyrA462 is causing a ccdB resistance. Also the gyrase mutation gyrA96 gives E. coli a ccdB resistance. This should be kept in mind when assembling BioBricks with the 3A assembly.
<partinfo>K389004</partinfo>: Luciferase from pGL4.10[luc2]
<partinfo>K389011</partinfo>: VirA screening device

The ratio of surviving colonies ϕS was calculated like
with the number of colony forming units CFU, the concentration of kanamycin on the considered plate KanX and no kanamycin on the plate Kan0.
<partinfo>K389012</partinfo>: VirA reporter system with luciferase
coming more soon
<partinfo>K389015</partinfo>: VirA/G reporter device with luciferase
Some important parameters determined by the characterization experiments are shown in tab. X. For more information concerning these experiments click on the corresponding link in tab. X or click here:
Table X: Parameters for <partinfo>K389015</partinfo>.
| Experiment | Characteristic | Value |
|---|---|---|
| Transfer Function | Maximum induction level | 2.2 fold |
| Maximum induction level reached | 200 µM acetosyringone | |
| Hill coefficient | 1.09 | |
| Switch Point | 31.6 µM acetosyringone | |
| Doubling time / h | without plasmid | 1.98 |
| carrying K389015 | 2.24 | |
| carrying K389015 with 400 µM acetosyringone | 2.67 | |
| Response time | Induction: exponential phase | >1 h |
| Induction: begin of cultivation | max. induction at OD600 = 1 +/- 0.5 | |
| Conformation analysis | ratio ccc monomer / % | 91 |
| ratio ccc dimer / % | 3.7 | |
| ratio oc forms / % | 5.3 |
<partinfo>K389016</partinfo>: VirA/G reporter device with mRFP
Protocols for Cultivation and Measurement
Growth functions and mRFP expression for <partinfo>K389016</partinfo>
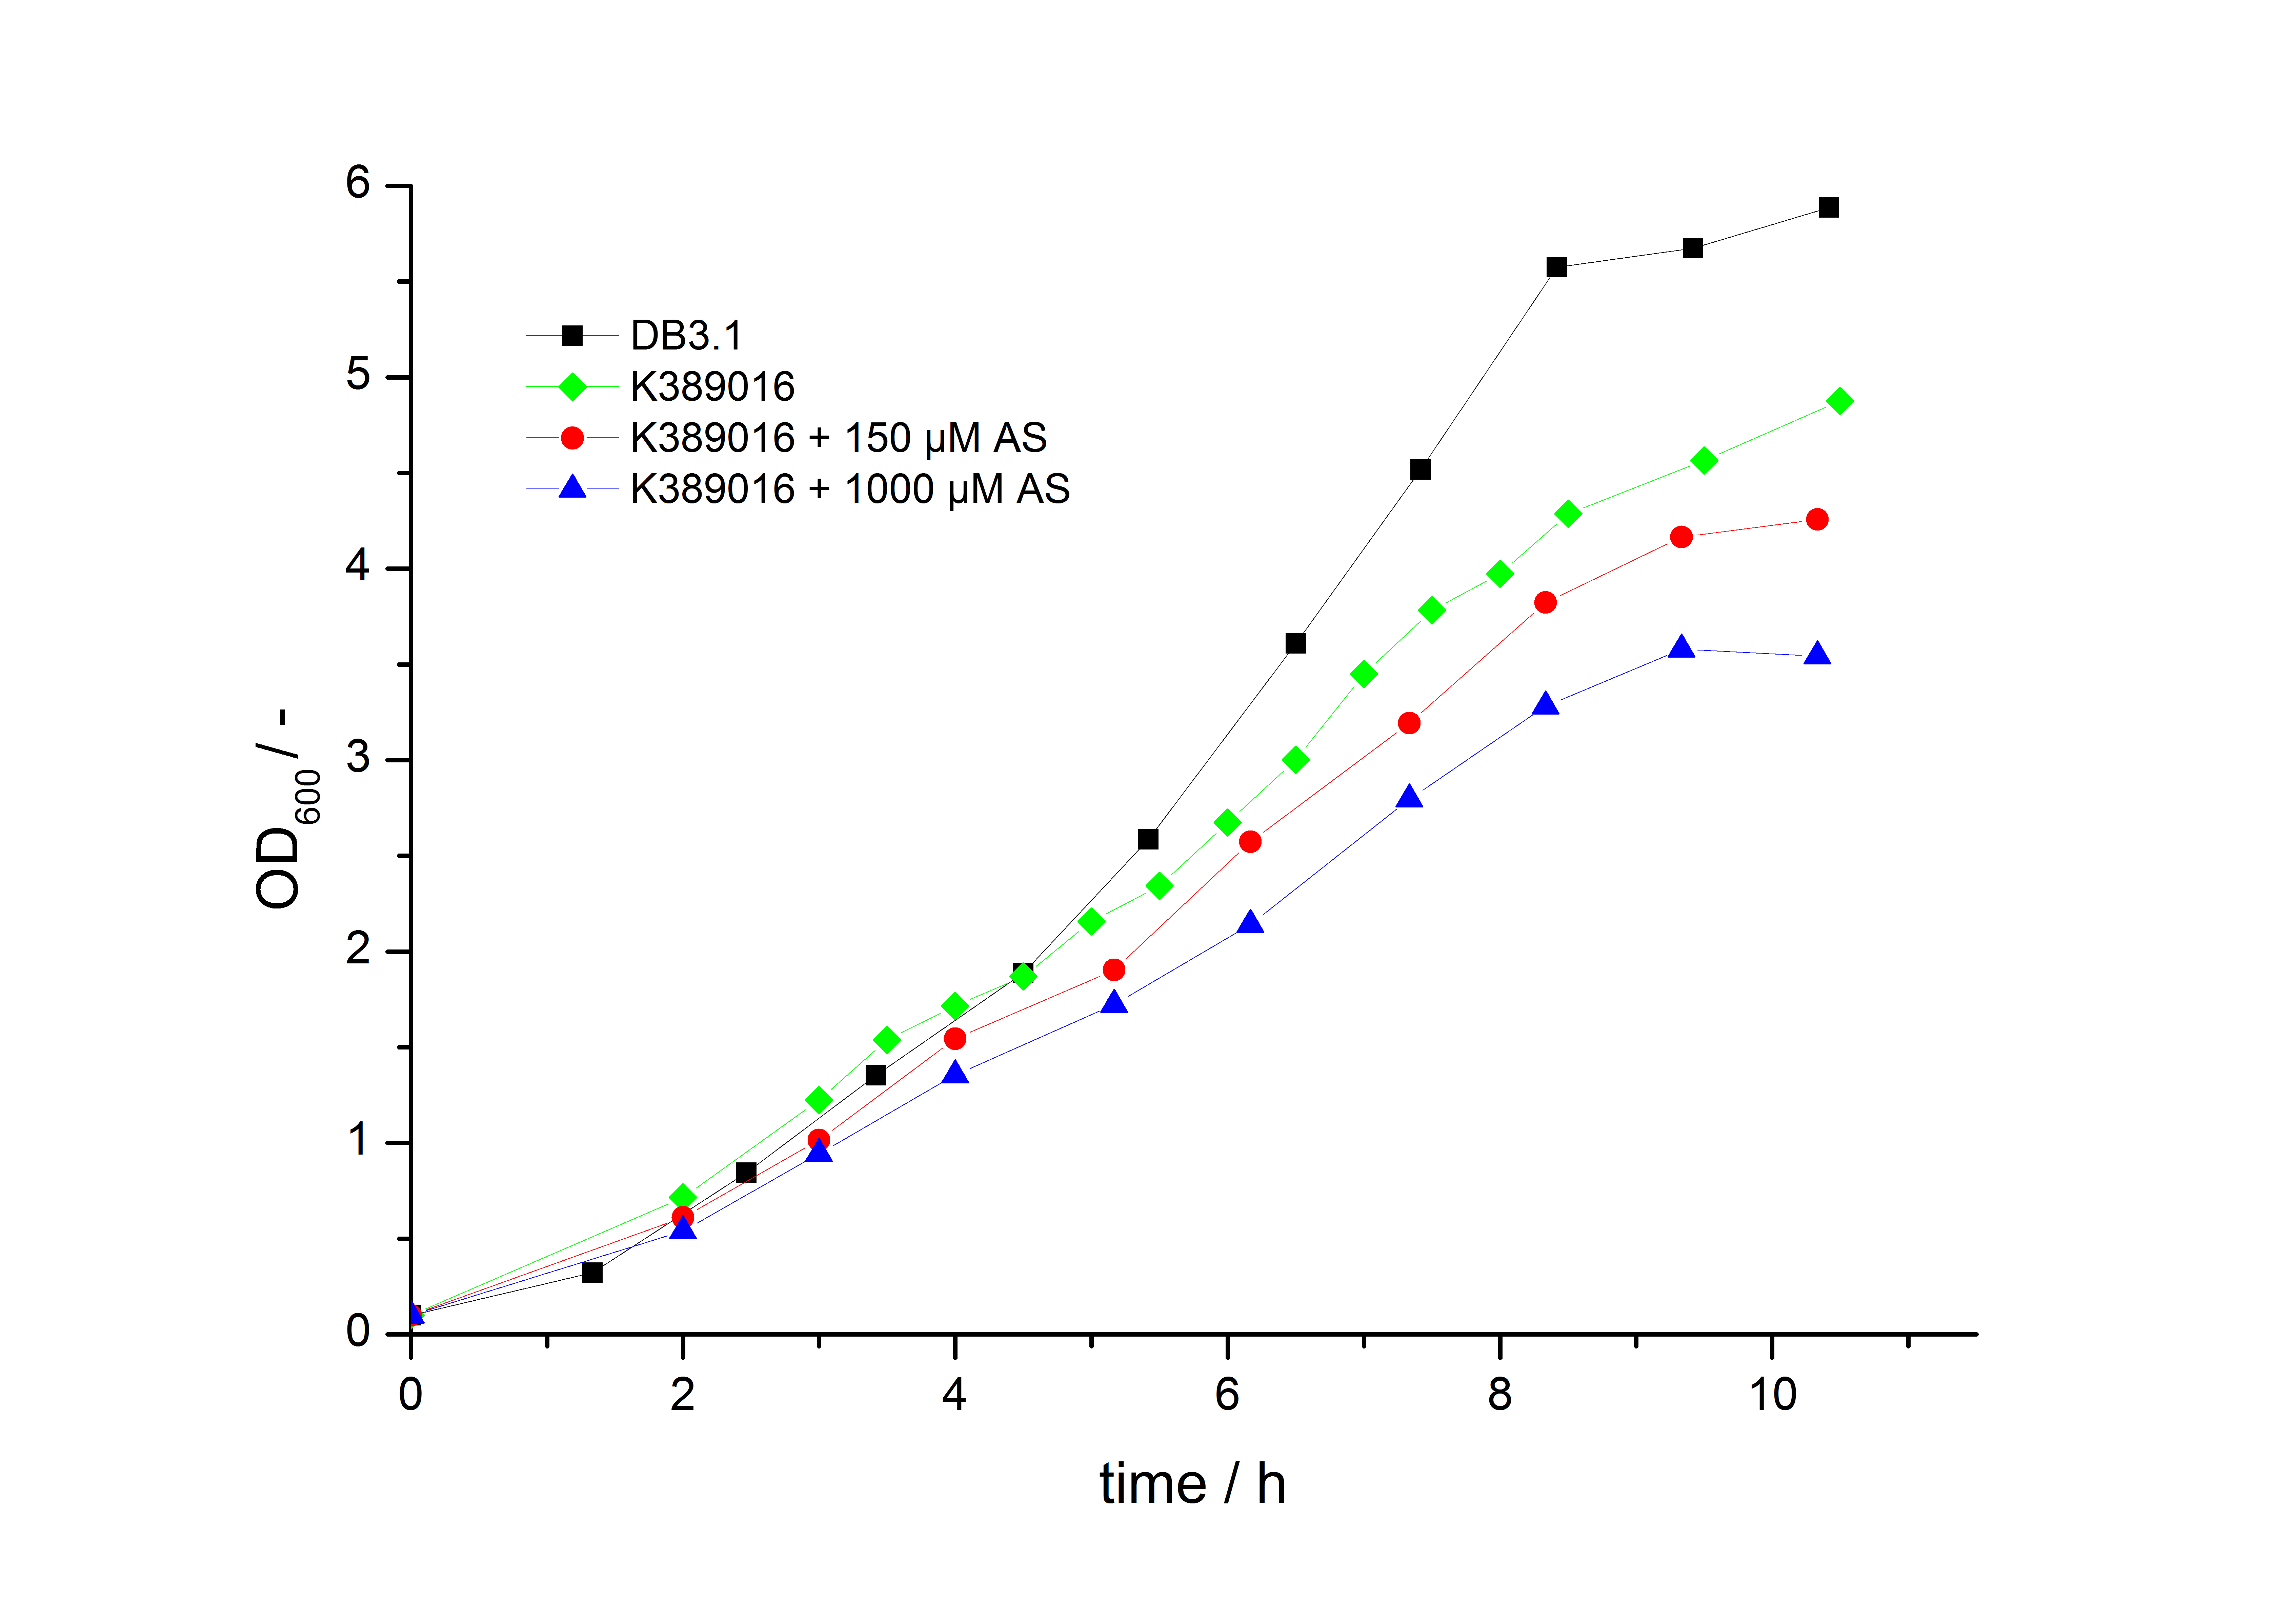
To characterize this part we performed several cultivations with different concentrations of acetosyringone as inducer and measured the fluorescence emitted by mRFP (Protocol). We used Escherichia Coli DB3.1 carrying the pSB1C3::K389016 plasmid. Even without inducer the bacteria, carrying the plasmid showed decelerated growth. In addition acetosyringone affected the growthrates (we used a stocksolution of 20 mM acetosyringone solved in 10 % (v/v) DMSO). Growth curves, averaged specific growth rates and doubling times are shown below. It can be observed, that E.coli carrying the pSB1C3::K389016 plasmid growths nearly linear.
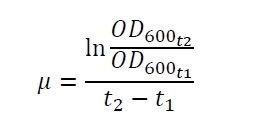
The specific growth rates µ and doubling times td are calculated with the OD600 and following formulas:
Table 1: Averaged specific growth rates and doubling times for cultivations of E. coli DB3.1 without plasmid and carrying <partinfo>K389016</partinfo> with different acetosyringone concentrations in LB medium with 10 mg ml-1 chloramphenicol.
| E. coli DB3.1 | µ / h-1 | td / h |
|---|---|---|
| without plasmid | 0.35 | 1.98 |
| carrying K389016 | 0.27 | 2.57 |
| carrying K389016 with 150 µM acetosyringone | 0.25 | 2.77 |
| carrying K389016 with 1000 µM acetosyringone | 0.23 | 3.01 |
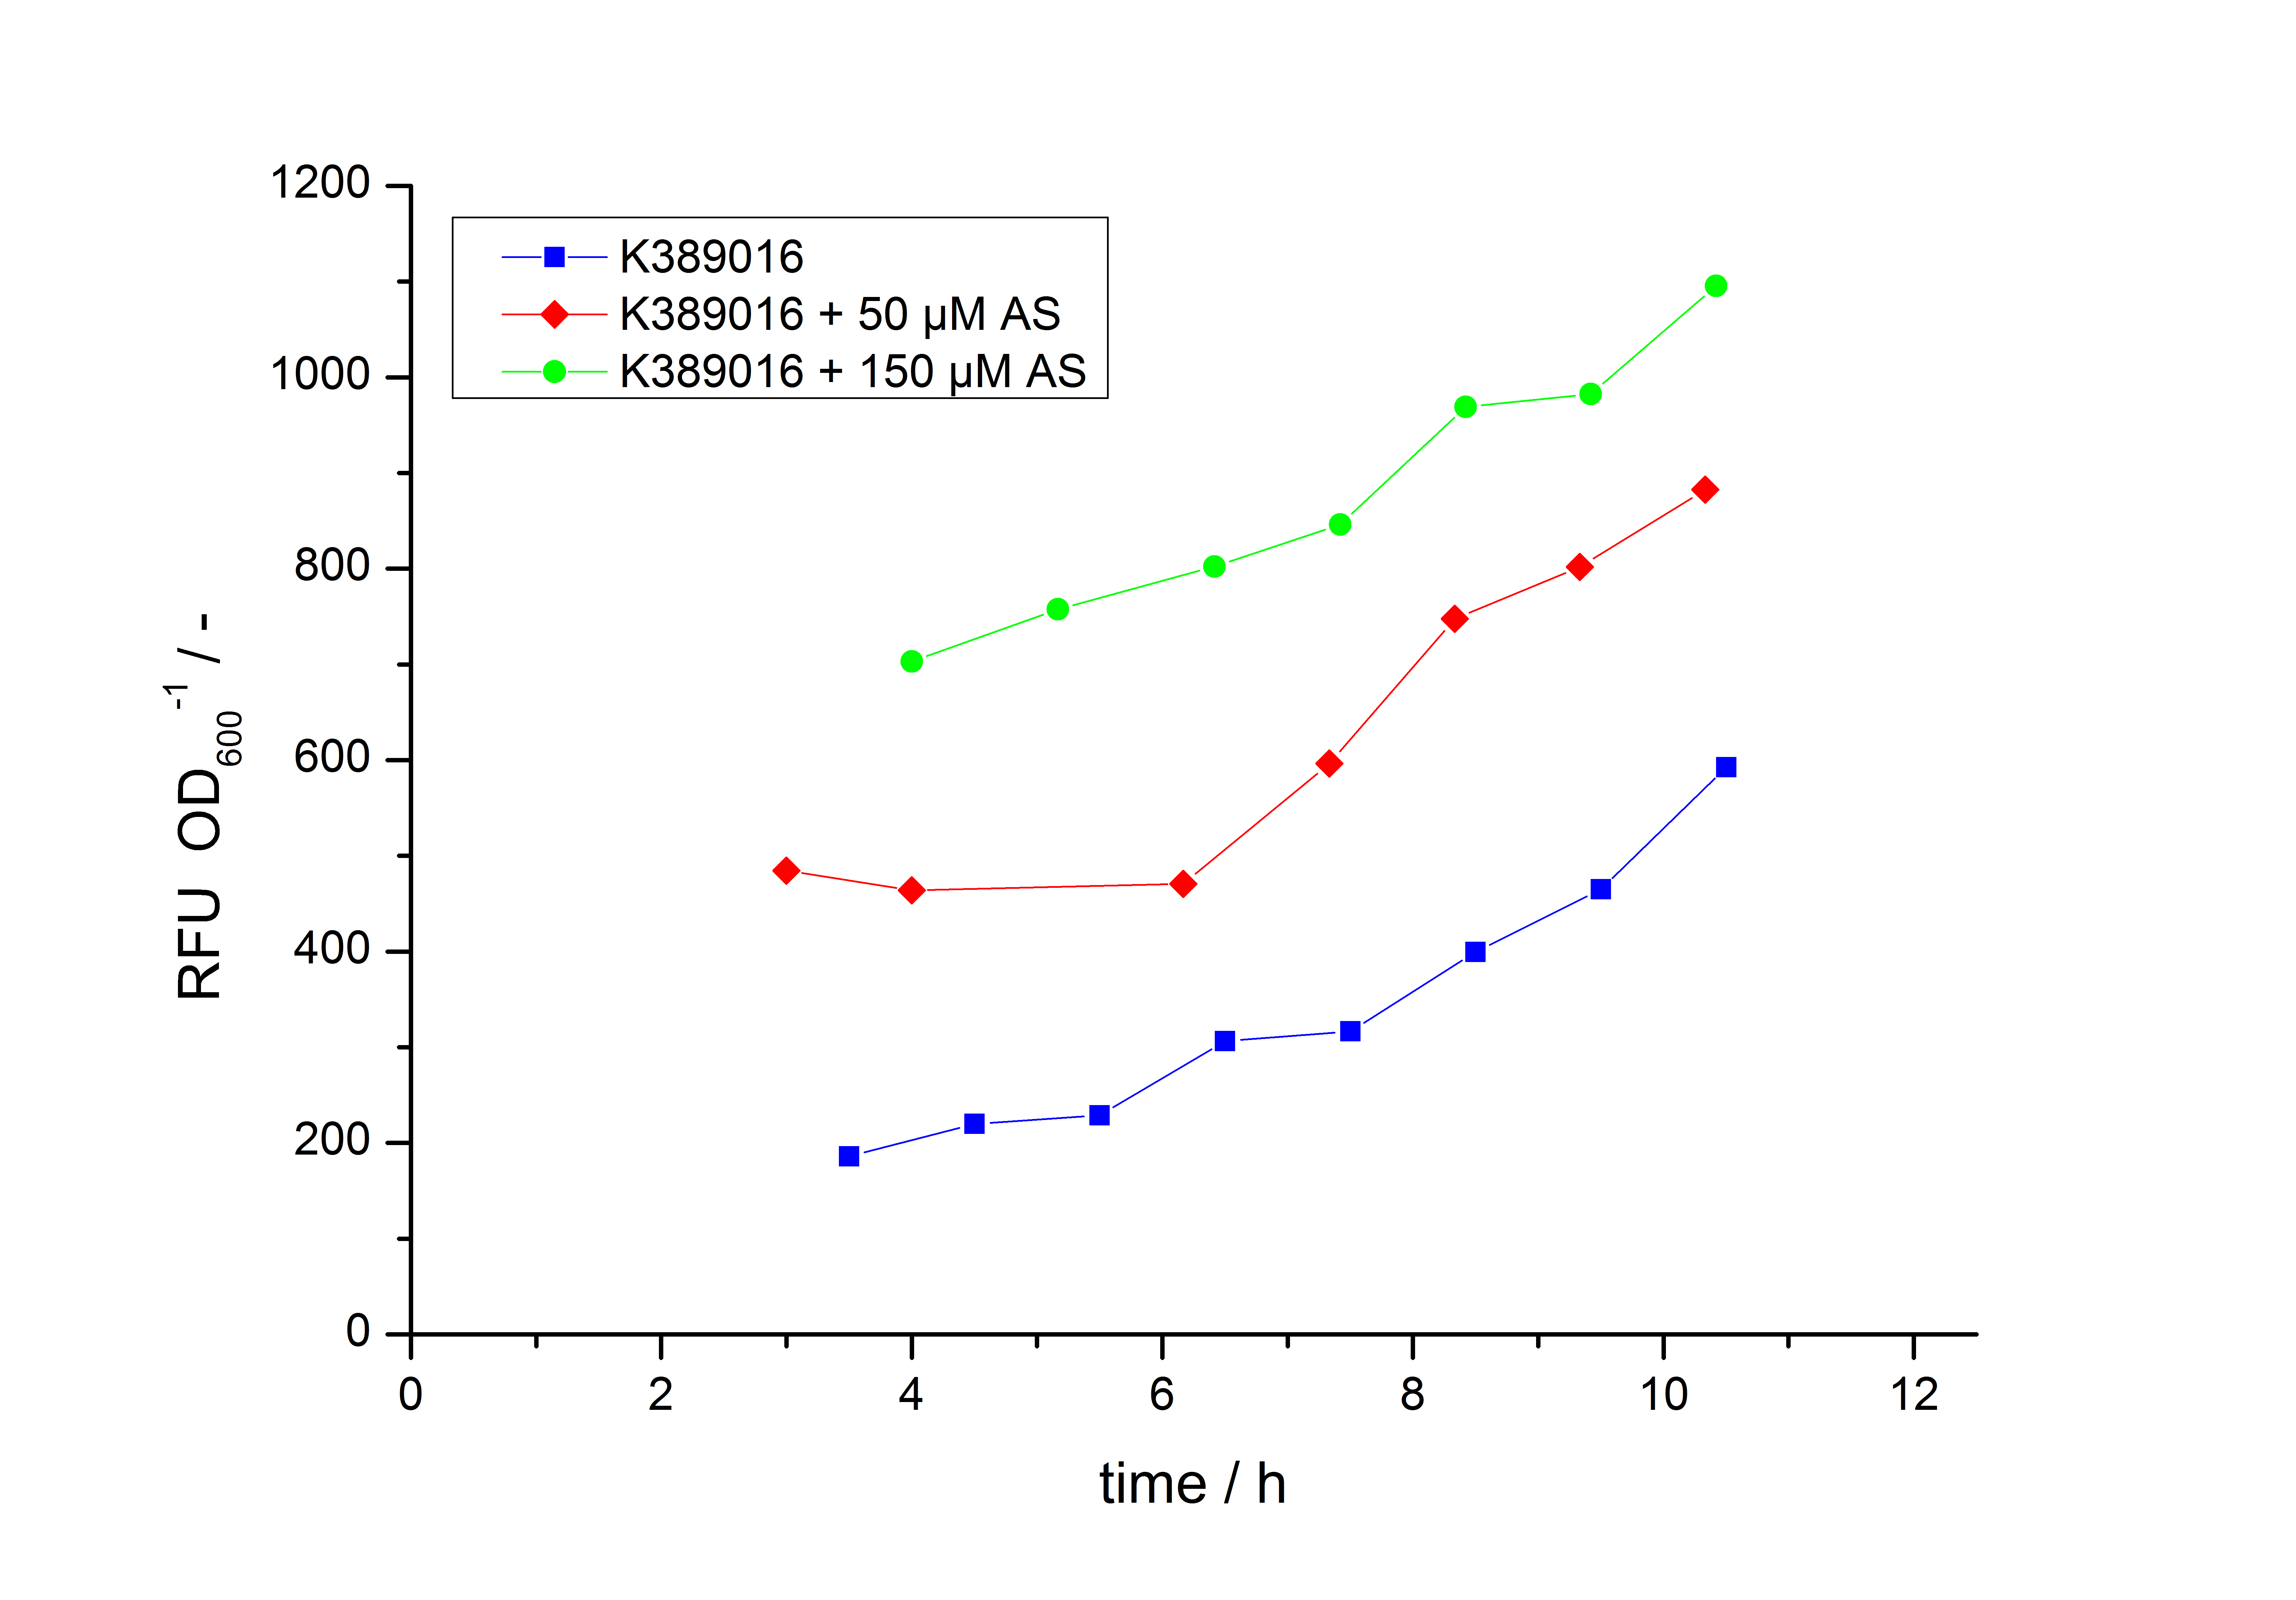
Exemplary induction curves with the fluorescence normalized to OD600 are shown in Fig.2. We observed a basal Transcription, but the Induction with acetosyringone is undoubtedly. The detailed data analysis and transfer function is described below.
Transfer function of <partinfo>K389016</partinfo>
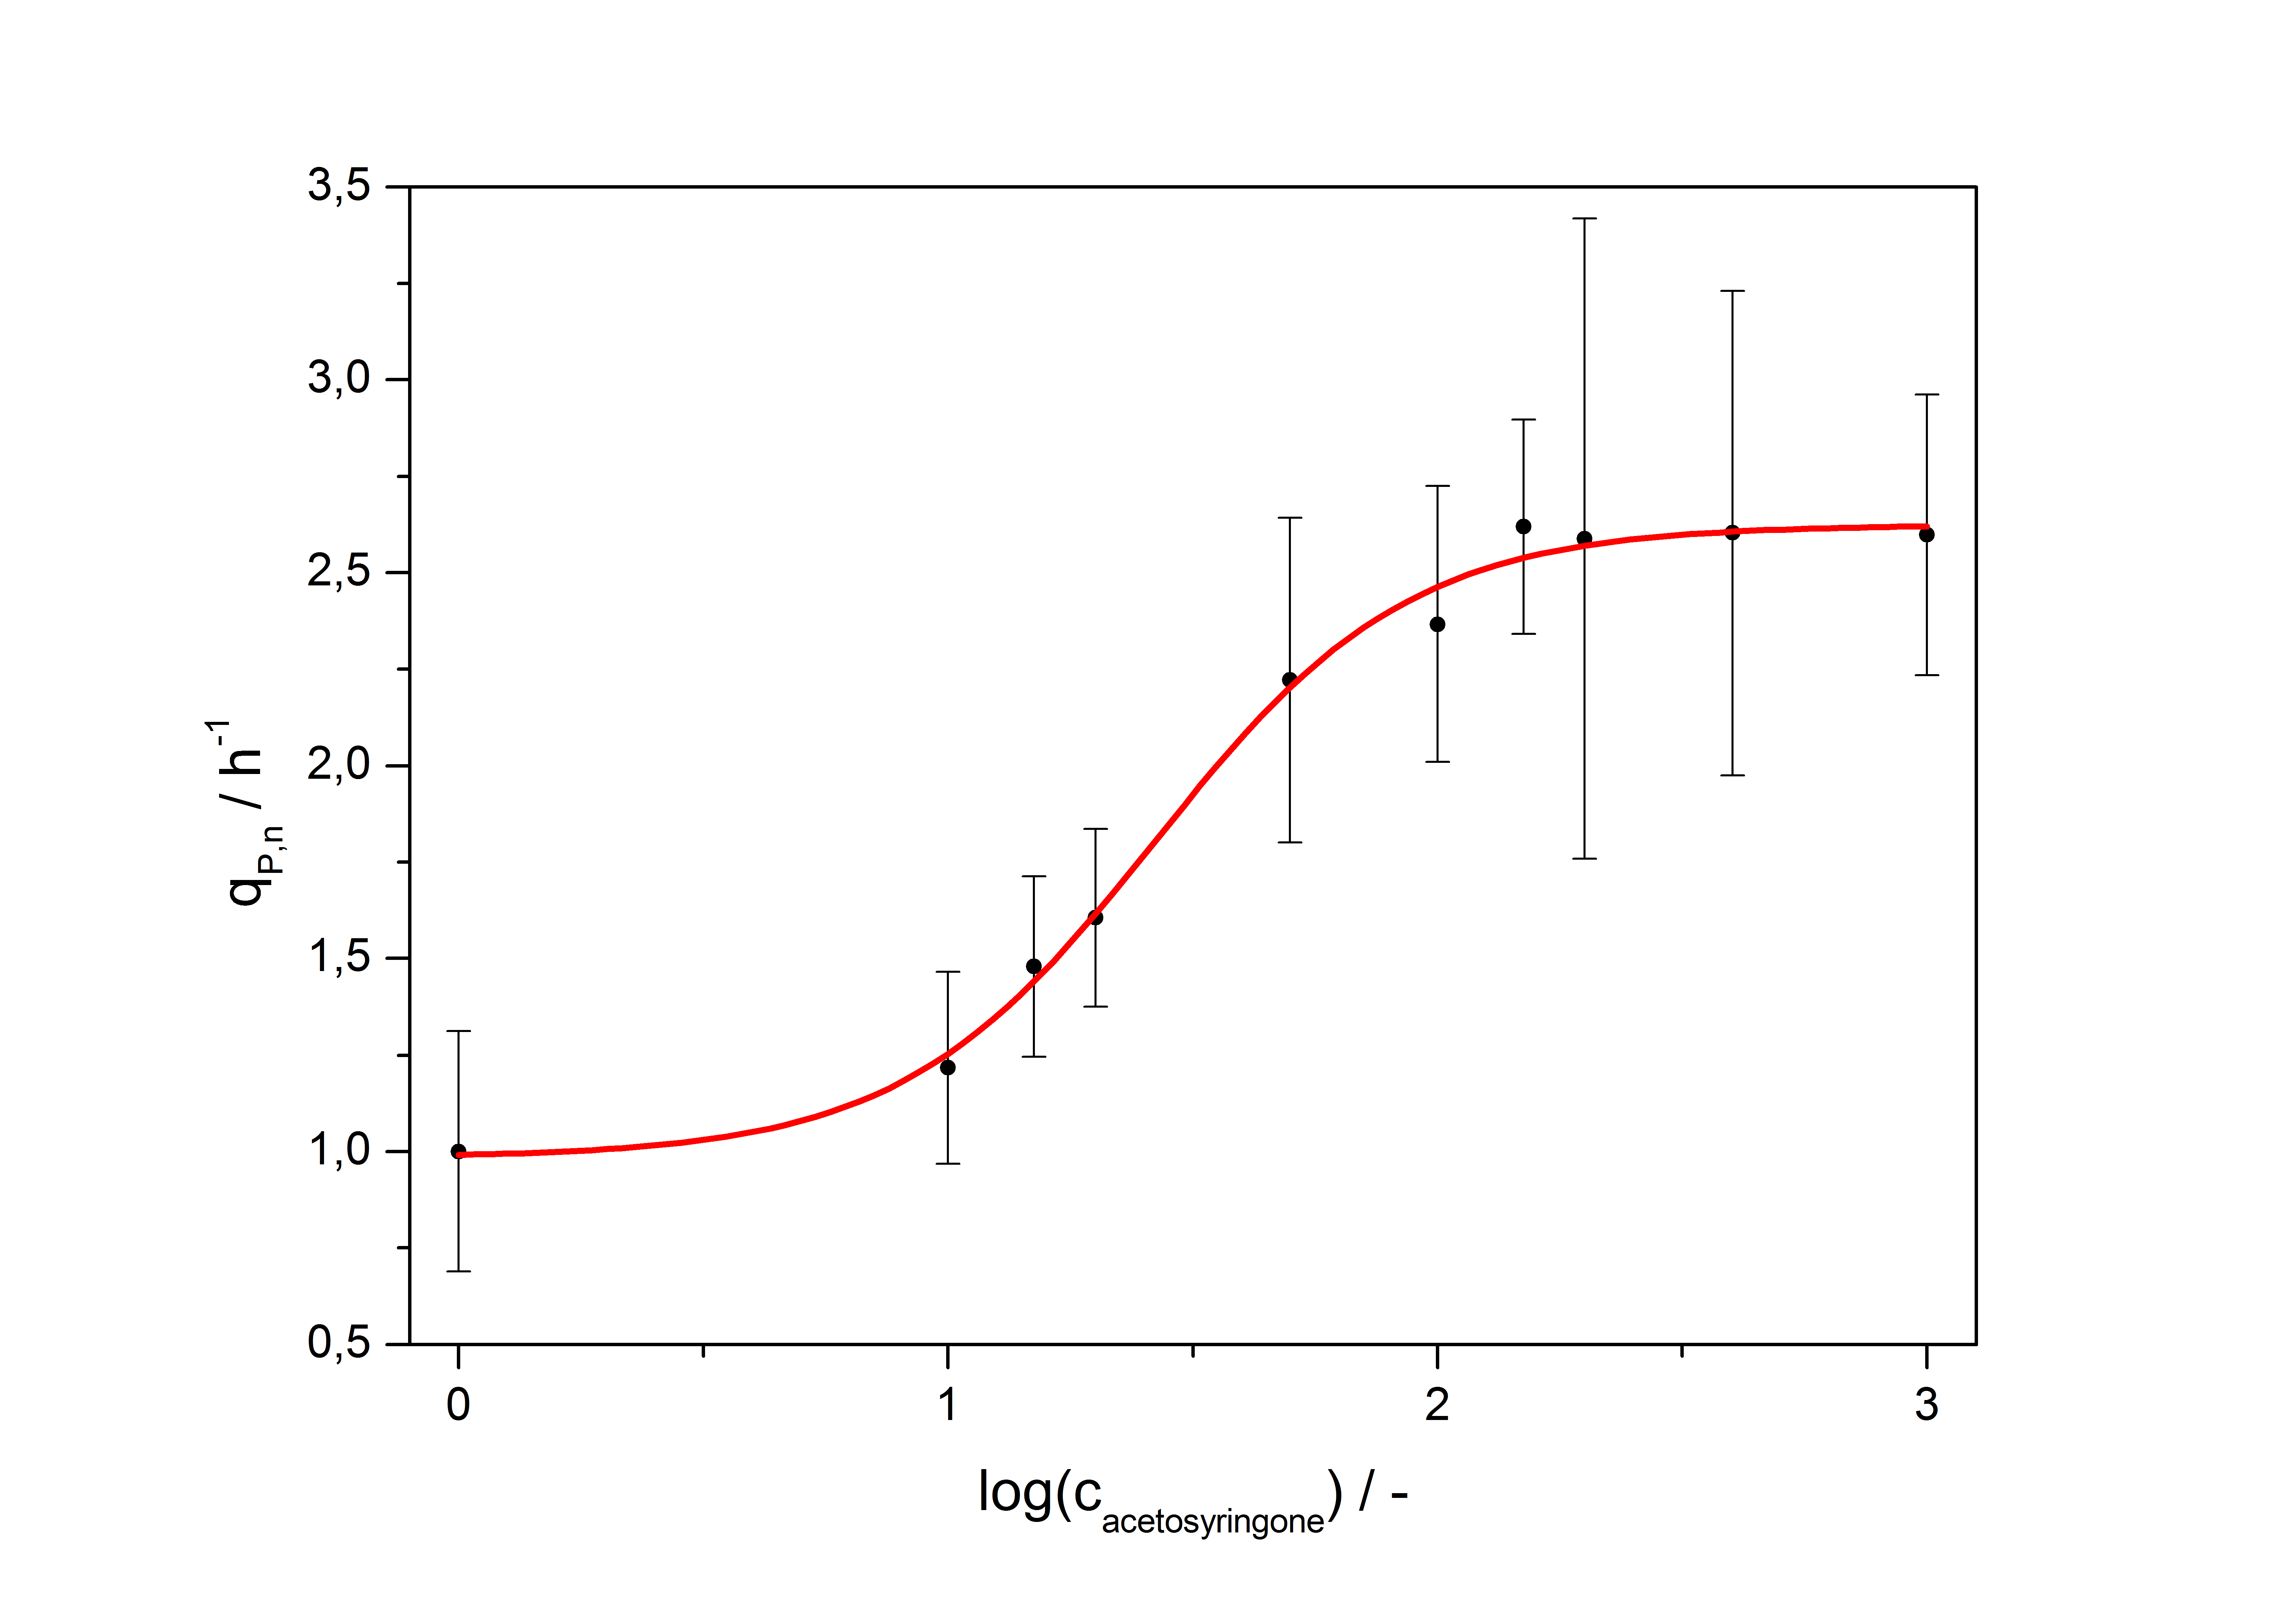
The data for the transfer function was measured and analyzed as described below. The data was fitted with a dose response function of the form
with the Hill coefficient p, the bottom asymptote A1, the top asymptote A2 and the switch point log(x0). Figure 1 shows the measured normalized specific production rates qP,n (eq. 8) plotted against the logarithm of the concentration of the inductor [http://www.chemblink.com/products/2478-38-8.htm acetosyringone] in µM. The fit has an R2 = 0.99.
The important data from the transfer function is summarized in table 1:
Table 1: Data from the transfer function for the part <partinfo>K389016</partinfo>.
| Parameter | Value |
|---|---|
| Hill coefficient | 1.673 |
| [http://partsregistry.org/Switch_Point Switch point] | 26.5 µM |
| Top asymptote | 2.62 |
So the fully induced VirA/G signaling system has a 2.6 fold increased expression compared to the uninduced system. The Hill coefficient is > 1, so a positive cooperation can be observed ([http://www.sciencedirect.com/science?_ob=ArticleURL&_udi=B6WMD-4V42JG5-1&_user=10&_rdoc=1&_fmt=&_orig=search&_sort=d&_docanchor=&view=c&_acct=C000050221&_version=1&_urlVersion=0&_userid=10&md5=b6431553217aca1129c5b441f4b78425 D Chu et al., 2009]). The [http://partsregistry.org/Switch_Point switch point] of the system is at about 25 µM, so this is the concentration at which the device output is 50% of the maximum output.
Data analysis for <partinfo>K389016</partinfo>
The data analysis is made in three steps. First step is the processing of the fluorescence raw data gained by the fluorescence plate reader for every sample:
In the second step the RFUcorrected of every sample is plotted against the cultivation time it was drawn. The data is fitted by an exponential fit of the following style:
The accumulation of mRFP in the cells is always exponential. A typical fitted product accumulation curve is shown below:
The product accumulation in a cultivation can be described as:
with the amount of product P, the cell count X and the specific production rate qP.
RFU is commensurate to the concentration of mRFP (P) and the OD600 is commensurate to the cell count (X) ( Canton and Labno, 2004):
With these assumptions it is possible to calculate the specific production rate of mRFP qP in the third step: the specific production rate for every sample of a cultivation is calculated by the derivation of the exponential fit line which describes the accumulation of product in the culture (dRFU/dt) and the measured OD600 data:
The specific production rates qP of all samples of all cultivations made with a specific inductor concentration c are averaged and normalized against the specific production rate of the uninduced system qP,0:
This normalized specific production rate we calculated is commensurate to relative promotor units (RPU) which is commensurate to PoPS (polymerase per seconds) ([http://partsregistry.org/Part:BBa_F2620:Experience/Endy/Data_analysis Canton and Labno, 2004]; [http://partsregistry.org/Part:BBa_J23101:Experience Pasotti et al., 2009]):
Control of BioBrick quality by capillar gel electrophoresis (GCE)
The representative tested BioBrick shows ccc-type of over 91 %, meaning pDNA quality is optimal.
<partinfo>K389052</partinfo>: tightly regulated lac operon with mRFP readout
Fails...more soon.
<partinfo>K389421</partinfo>, <partinfo>K389422</partinfo>, <partinfo>K389423</partinfo>: Sensitivity Tuner amlified Vir-test system
By self designed PCR-Primer we excluded terminal GFP and the initial promoter pBAD/araC, for replacing our own VirB promotor and reporter gene luc (luciferase). Primers were designed for sensitivity tuner [http://partsregistry.org/Part:BBa_I746370 I746370], [http://partsregistry.org/Part:BBa_I746380 I746380] and [http://partsregistry.org/Part:BBa_I746390 I746390] so that standard assembly would be possible. Assembling of PCR-products took place by Silver Assembly.
Accomplishment
PCR-Primer Design
Primer forward activator phage P2:
5`-GTT TCT TCG AAT TCG CGG CCG CTT CTA GAT GTT TCA TTG TCC TTT ATG CC-3`
Primer forward activator phage PSP3:
5`-GTT TCT TCG AAT TCG CGG CCG CTT CTA GAT GAT GCA CTG CCC GTT ATG- 3`
Primer forward activator phage phi R73:
5`-GTT TCT TCG AAT TCG CGG CCG CTT CTA GAT GCG CTG CCC TTT CTG-3`
Primer backward Promotor PF from phage P2:
5`-GTT TCT TCC TGC AGC GGC CGC TAC TAG TAT TTC TCC TCT TTC TCT AGT AAG TGG- 3`
Characterization tests
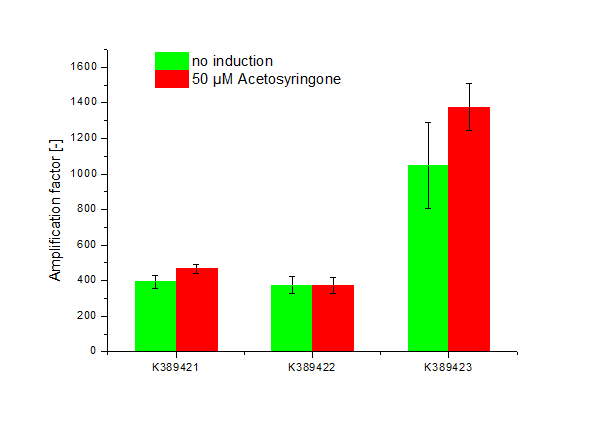
Cultivation was done by induction with Acetosyringone at 50 µM. Controls were not induced Sensitivity Tuner devices as well as induced and not induced nativ system ([http://partsregistry.org/Part:BBa_K389015 K389015]; without tuning elements). Induction was done upon inoculation. Measuring point for amplification factor calculation was OD 1.0.
Results
Three sensitivity tuned Vir-Gen sensing systems were obtained: [http://partsregistry.org/Part:BBa_K389421 K389421], [http://partsregistry.org/Part:BBa_K389422 K389422] and [http://partsregistry.org/Part:BBa_K389423 K389423] distinguishing by the amplification level of luc transcription.
The amplification factor was received by apply [http://partsregistry.org/Part:BBa_K389015 K389015] as reference. Amplification calculation was done by normalizing relative luminescence units emitted from luciferase per OD. Output-signal amplification is in the induced contructs (red) [http://partsregistry.org/Part:BBa_K389422 K389422] and [http://partsregistry.org/Part:BBa_K389423 K389423] 100 and respectively 200 fold higher than in not induced controls (green). An exception is K389422 were induced and not indiced system revealed analog results. Corresponding to data of iGEM Team, Cambridge 2009, K389423 (originated from [http://partsregistry.org/Part:BBa_I746390 I746390]) shows the highest amplification rate of all tested Sensitivity Tuners. Our results indicate to higher amplification rate of [http://partsregistry.org/Part:BBa_K389421 K389421] than [http://partsregistry.org/Part:BBa_K389422 K389422] of 100 fold under induced conditions. The controls also show high basal transcription rates.
Because there is small difference in induced and not induced system visible and basal transcription rates are high, we assume that the sensitivity tuning constructs are not well applicable for luciferase measurements.
For further theory click Read out system
Sequenced BioBricks
Own BioBricks
The sequencing of the following of our own BioBricks was succesful and lead to the expected results:
- <partinfo>K389001</partinfo> (not fully completed)
- <partinfo>K389002</partinfo>
- <partinfo>K389003</partinfo>
- <partinfo>K389004</partinfo>
- <partinfo>K389005</partinfo>
- <partinfo>K389010</partinfo> (not fully completed)
- <partinfo>K389011</partinfo> (not fully completed)
- <partinfo>K389012</partinfo> (not fully completed)
- <partinfo>K389013</partinfo> (not fully completed)
- <partinfo>K389015</partinfo> (not fully completed)
- <partinfo>K389016</partinfo> (not fully completed)
- <partinfo>K389050</partinfo>
Other BioBricks
- <partinfo>K238008</partinfo> sequencing gave negative results - infos in registry are not correct!
- <partinfo>K238011</partinfo> sequencing gave negative results - infos in registry are not correct!
References
[1] http://openwetware.org/wiki/CcdB, CcdB (seen on 10.10.10).
[2] http://openwetware.org/wiki/E._coli_genotypes, E. coli genotypes (seen on 10.10.10).
[3] Metcalf, W.W. et al. (1994) Gene 138, 1.
[4] Stadler J, Lemmens R, Nyhammar T 2004, Plasmid DNA purification, The J. of Gene Medicine,Vol.6, pp.54–S66
[5] Behrens B, Eppendorf AG, Laborpraxis, Nr.20, Reinste Plasmid-DNA in nur 9 Minuten.
Canton B and Labno A (2004) [http://partsregistry.org/Part:BBa_F2620:Experience/Endy/Data_analysis Data processing of Part BBa_F2620].
Chu D, Zabet NR, Mitavskiy B (2009) [http://www.sciencedirect.com/science?_ob=ArticleURL&_udi=B6WMD-4V42JG5-1&_user=10&_rdoc=1&_fmt=&_orig=search&_sort=d&_docanchor=&view=c&_acct=C000050221&_version=1&_urlVersion=0&_userid=10&md5=b6431553217aca1129c5b441f4b78425 Models of transcription factor binding: Sensitivity of activation functions to model assumptions], J Theor Biol 257(3):419-429.
Pasotti L, Zucca S, Del Fabbro E (2009) Characterization experiment on BBa_J23100, BBa_J23101, BBa_J23118, http://partsregistry.org/Part:BBa_J23101:Experience.
 "
"


