Team:Bielefeld-Germany/Project/Model
From 2010.igem.org
(→Fitting the data) |
(→Fitting the data) |
||
| (One intermediate revision not shown) | |||
| Line 34: | Line 34: | ||
== Fitting the data == | == Fitting the data == | ||
| - | As seen in the fig. 1 - 3 the models for the application of the used VirA/G signaling system is quite complex. Due to the fact that there were no further details to interactions between the components of this receptor system in the literature which are helpful for modelling and a determination of these parameters would be too time-consuming we decided to fit the ''vir'' promoter activity to different concentrations of the natural inducer of the VirA/G signaling system, acetosyringone. As the promoter activity is not directly accessible we decided to measure it by using a reporter gene. | + | As seen in the fig. 1 - 3 the models for the application of the used VirA/G signaling system is quite complex. Due to the fact that there were no further details to interactions between the components of this receptor system in the literature, which are helpful for modelling, and a determination of these parameters would be too time-consuming we decided to fit the ''vir'' promoter activity to different concentrations of the natural inducer of the VirA/G signaling system, acetosyringone. As the promoter activity is not directly accessible we decided to measure it by using a reporter gene. |
Promoter activity is normally measured in polymerases per second (PoPS). To correlate the concentration of a reporter gene with PoPS a synthesis rate for the reporter gene has to be measured to see how many molecules are produced by one cell in a certain time ([http://partsregistry.org/Part:BBa_F2620:Experience/Endy/Data_analysis Canton and Labno, 2004]). This relation can be described as | Promoter activity is normally measured in polymerases per second (PoPS). To correlate the concentration of a reporter gene with PoPS a synthesis rate for the reporter gene has to be measured to see how many molecules are produced by one cell in a certain time ([http://partsregistry.org/Part:BBa_F2620:Experience/Endy/Data_analysis Canton and Labno, 2004]). This relation can be described as | ||
| Line 93: | Line 93: | ||
| - | [[Image:Bielefeld_Final_RFP_fit.jpg|600px|thumb|center|''' | + | [[Image:Bielefeld_Final_RFP_fit.jpg|600px|thumb|center|'''Figure 5: Transfer function for the part <partinfo>K389016</partinfo> (R<sup>2</sup> = 0.99).''']] |
With this function it is possible to describe the factor ɸ<sub>I</sub> the PoPS of the ''vir'' promoter rises in an induced VirA/G signaling system compared to the basal transcription of the promoter depending from the concentration of inducer acetosyringone c added to the medium: | With this function it is possible to describe the factor ɸ<sub>I</sub> the PoPS of the ''vir'' promoter rises in an induced VirA/G signaling system compared to the basal transcription of the promoter depending from the concentration of inducer acetosyringone c added to the medium: | ||
| - | [[Image:Bielefeld_Finale_formel.jpg| | + | [[Image:Bielefeld_Finale_formel.jpg|250px|center]]. <div align="right">(9)</div> |
Latest revision as of 21:51, 27 October 2010
Construct Maps
Model of <partinfo>K389015</partinfo>
Model of <partinfo>K389016</partinfo>
Model of <partinfo>K389014</partinfo>
Fitting the data
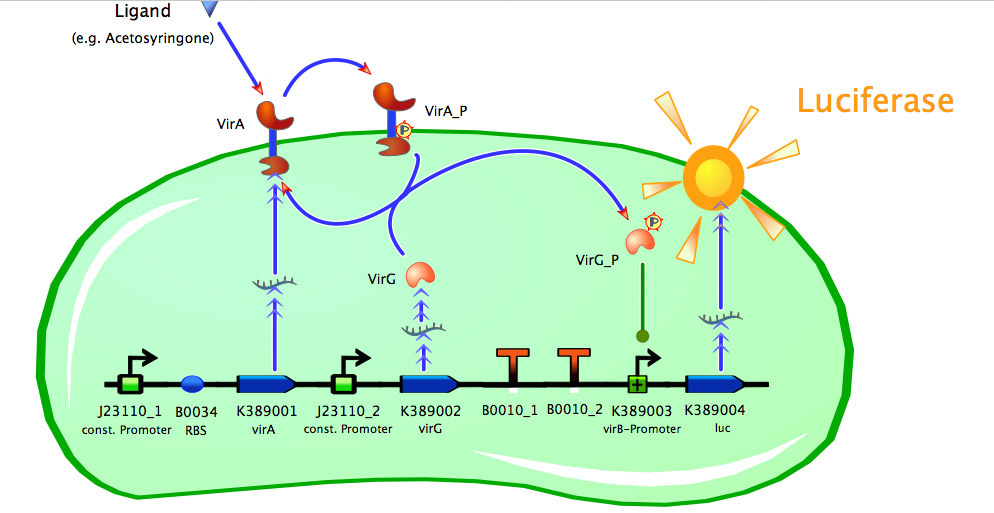
As seen in the fig. 1 - 3 the models for the application of the used VirA/G signaling system is quite complex. Due to the fact that there were no further details to interactions between the components of this receptor system in the literature, which are helpful for modelling, and a determination of these parameters would be too time-consuming we decided to fit the vir promoter activity to different concentrations of the natural inducer of the VirA/G signaling system, acetosyringone. As the promoter activity is not directly accessible we decided to measure it by using a reporter gene.
Promoter activity is normally measured in polymerases per second (PoPS). To correlate the concentration of a reporter gene with PoPS a synthesis rate for the reporter gene has to be measured to see how many molecules are produced by one cell in a certain time ([http://partsregistry.org/Part:BBa_F2620:Experience/Endy/Data_analysis Canton and Labno, 2004]). This relation can be described as
with the amount of product P, the cell count X and the specific production rate of product molecules per cell and time qP. To determine the PoPS exactly from the specific production rate there is more information needed like the decay of the reporter molecule, the stability of the reporter gene mRNA, the effectivity of the reporter gene's RBS and many more. So we assumed that these parameters do not change in the time of our measurement. In addition we assumed after [http://partsregistry.org/Part:BBa_F2620:Experience/Endy/Data_analysis Canton and Labno, 2004] that
and
so the specific production rate can be approximated by the equation (4):
As the reporter gene accumulates exponentially during the exponential growth phase the amount of product at every time of the cultivation can be described with a fit of the form
so the specific production rate of each taken sample can be calculated with the derivation of this fit function and eq. (4). In fig. 4 such a fit is shown.
The specific production rates qP of all samples of all cultivations made with a specific inductor concentration c are averaged and normalized against the specific production rate of the uninduced system qP,0:
This normalized specific production rate we calculated is commensurate to relative promotor units (RPU) which is commensurate to PoPS (polymerase per seconds) ([http://partsregistry.org/Part:BBa_F2620:Experience/Endy/Data_analysis Canton and Labno, 2004]; [http://partsregistry.org/Part:BBa_J23101:Experience Pasotti et al., 2009]):
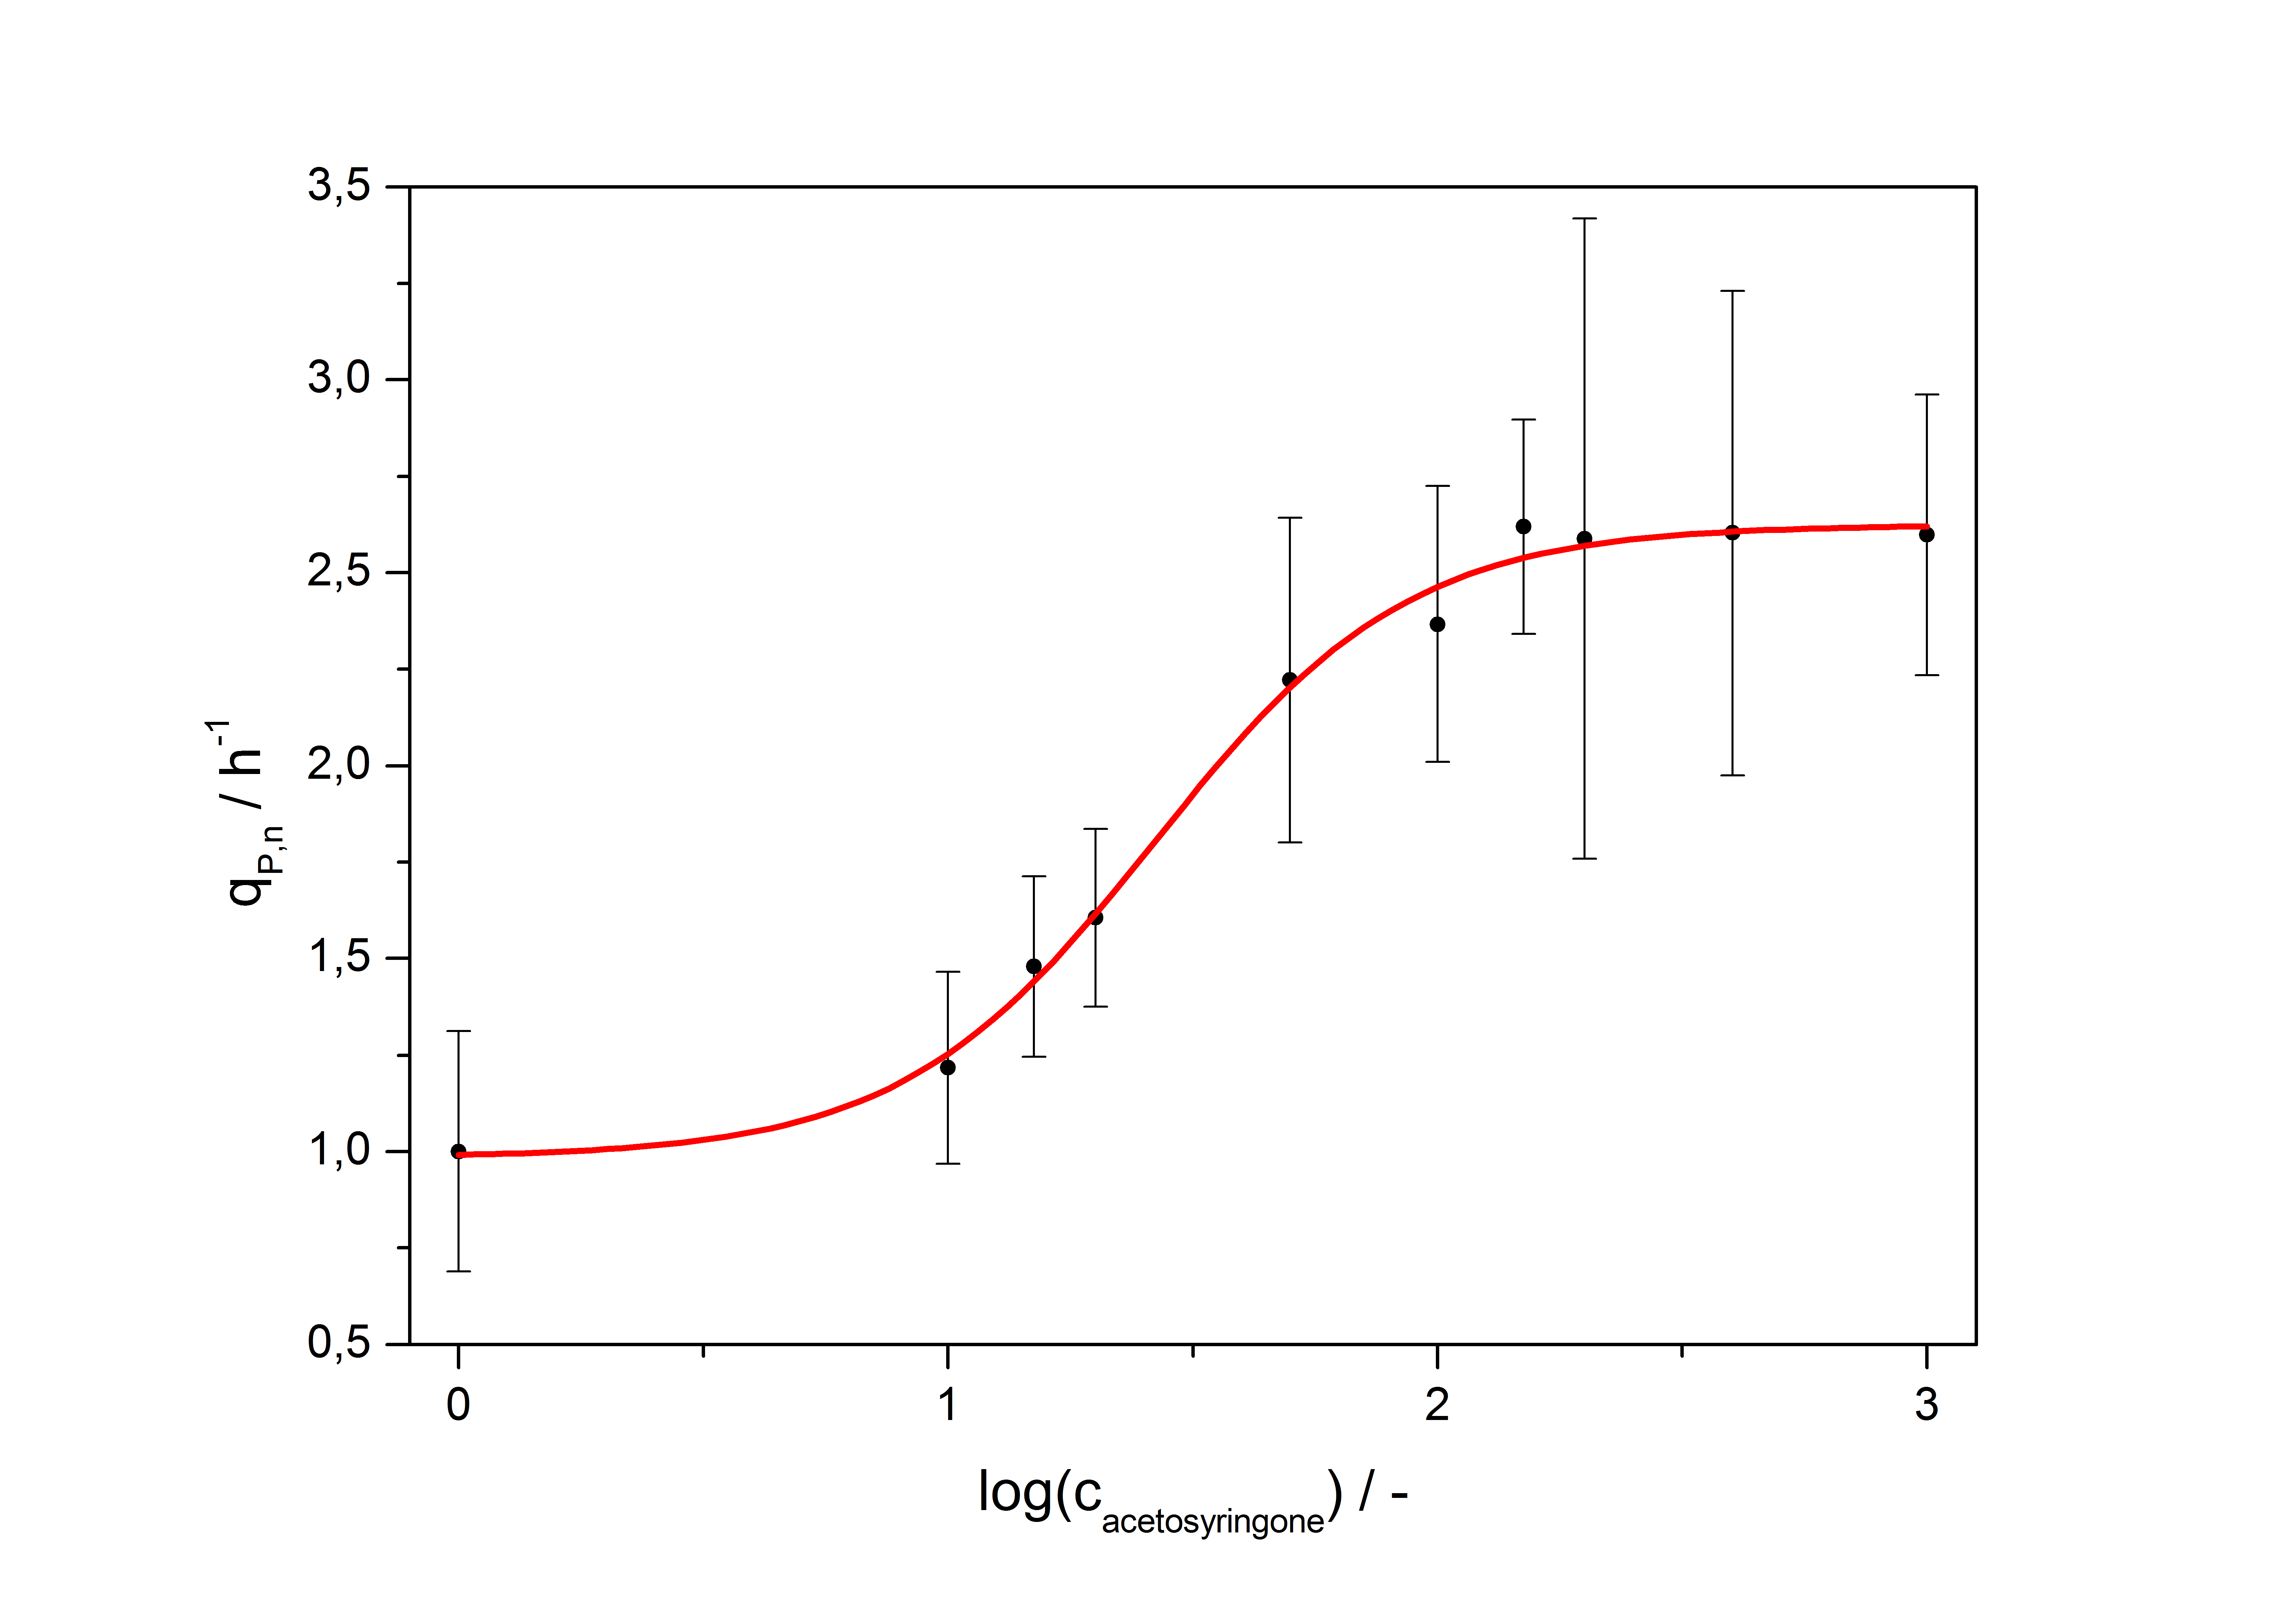
After calculating the qP,n of mRFP in the presence of different concentrations of the inducer acetosyringone a transfer function is determined. [http://www.nature.com/nature/journal/v416/n6877/abs/nature726.html Nelson et al. (2002)] suggest using a dose response function and fitting it with a logistical equation for the data analysis of receptor systems. So the data was fitted with a function of the form
with the Hill coefficient p, the bottom asymptote A1, the top asymptote A2 and the switch point log(x0). Figure 5 shows the measured normalized specific production rates qP,n (eq. 6) plotted against the logarithm of the concentration of the inductor acetosyringone in µM. The fit has an R2 = 0.99.
With this function it is possible to describe the factor ɸI the PoPS of the vir promoter rises in an induced VirA/G signaling system compared to the basal transcription of the promoter depending from the concentration of inducer acetosyringone c added to the medium:
 "
"


