 "
"
Team:British Columbia/Project Biofilm
From 2010.igem.org
Introduction
The biofilm sub-team has obtained a growth curve plotting the biofilm growth of S. aureus RN4220 and 8325-4 strains at 3 to 30 hour incubation times. This basic growth curve can be used for comparison with growth curves under conditions where the biofilm is exposed to DspB only, the phage only, or DspB integrated into the phage. RN4220 is a S. aureus strain without a prophage and 8325-4 is a S. aureus strain that has been cured of phage Փ11, Փ12, and Փ13; both strains were selected based on their susceptibility to phage Փ13 (1). The biofilm data collected has additionally been incorporated into the Modelling sub-team simulation to predict the effect of the synthetic phage on Staphylococcus aureus biofilm growth.
Approach
The biofilm sub-team obtained the majority of their results from optical density (OD) readings (absorbance at 550nm) by a Tecan plate reader. Differing variables were tested initially, which determined that both RN4220 and 8325-4 strains displayed greater growth (higher OD readings) when innoculated into a Greiner bio-one 96-well flat bottomed plate with a solution of 1%-glucose tryptic soy broth. The center wells of the microtiter plate were used as previous experiments showed unpredictable growth towards the outer edges of the plate, as well, 1%-glucose tryptic soy broth without the innoculated bacteria served as the control (Fig. 1)
After these conditions for growth were established, the innoculated 96-well flat bottomed plates were incubated at various times ranging from 3 to 30 hours at 37 degrees Celsius. After incubation, the innoculated wells were subjected to a 3 x 300ul wash with phosphate buffer saline solution to maintain a stable pH and rinse away cells that were not adhered to the biofilm aggregate (2). Heat fixation followed to adhere the biofilm to the 96-well plate and inhibit further growth (2). Subsequent staining of the cells with crystal violet dye allowed for OD readings of the biofilm which produced data for the growth curve.

Results & Discussion
Our results suggest that the biofilms take approximately the first 18 hours to establish themselves, before entering a state of dynamic equilibrium. The S. aureus strain RN4220 exhibits greater growth in comparison to strain 8325-4 between 2.5 and 18 hours, but both enter the dynamic equibilibrium phase at approximately the same time with similar cycles of biofilm density (Fig. 2).
The cyclical biofilm maturation and subsequent dispersal pattern occurs when the biofilm reaches a critical mass and it is no longer “profitable” for the bacterium to participate in the biofilm (3). The bacteria composing the outermost layers of the biofilm then develop into free-floating organisms and dissociate from the biofilm, while others die due to lack of nutrients and exposure to toxic metabolic wastes generated by the biofilm and concentrated in the area (4). After dispersal of the biofilm commences, more nutrients are available for stimulating growth, and it becomes favourable for the bacteria to aggregate and form a biofilm again (3).

The data collected so far has contributed values important to the Modeling sub-team's simulations. It has also prepared the Biofilm sub-team for future experiments observing the effect of different perturbation factors on the biofilm. To observe the effect of the biofilm matrix-degrading enzyme, DspB, on the biofilm one can use the purified protein or crude cell extract concentrate from DspB-expressing E. coli can be added at the time point of 9 hours during the log phase of the biofilm. A decrease in growth may then be attributed to the effect of DspB, whereas exposure after 18 hours would yield ambiguous results since the growth curve oscillates. The S. aureus strain 8325-4 will be used because its growth curve displays a more typical log phase of growth while RN4220 shows signs of a growth plateau after 7 hours. Future directions include exposure of the 8325-4 strain to the engineered phage construct at 9 hours to test its effectiveness at dispersal of S. aureus biofilms.
Microscopy Biofilm Images
Click to see larger image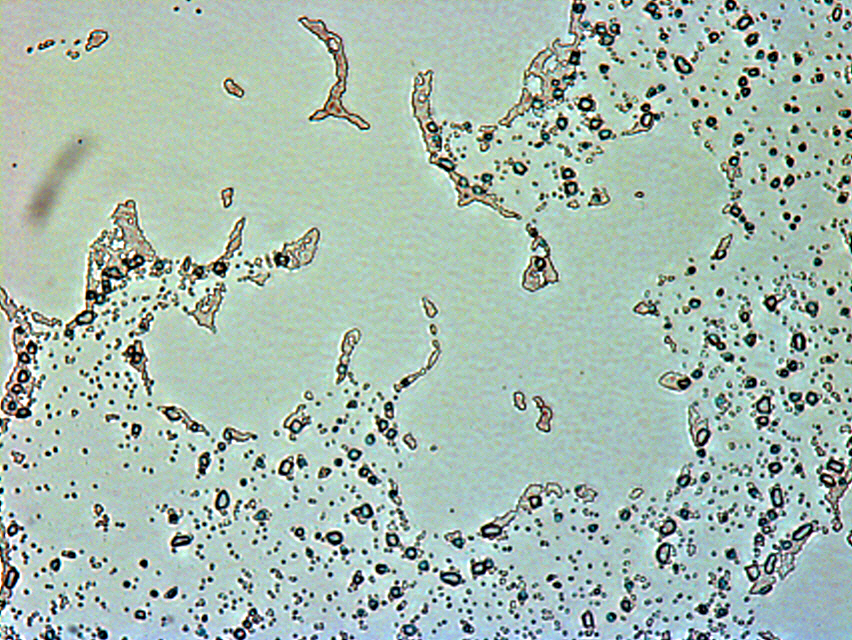
Photo of RN4220 after 24 hours incubation
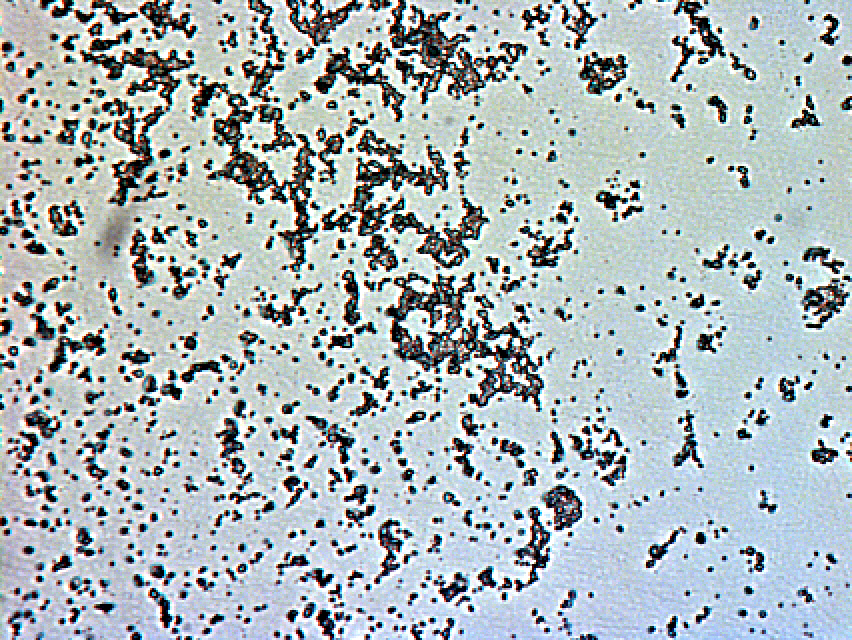
Photo of RN4220 after 24 hours incubation

Photo of RN4220 after 30 hours incubation
References
1. Iandolo JJ, Worrell V, Groicher KH, Qian Y, Tian R, et al. (2002) Comparative analysis of the genomes of the temperate bacteriophages phi11, phi12 and phi13 of Staphylococcus aureus 8325. Gene 289: 109–118.
2. Stepanovic, S., Vukovic, D., Hola, V., Bonaventura, G. D., Djukic, S., Cirkovic, I. & Ruzicka, F. (2007). Quantification of biofilm in microtiter plates: overview of testing conditions and practical recommendations for assessment of biofilm production by staphylococci. APMIS 115: 891–899.
3. Dunne Jr., W. 2002. Bacterial Adhesion: Seen Any Good Biofilms Lately? ASM 15(2): 155-156.
4. La Tourette Prosser, B., D. Taylor, B. A. Dix, and R. Cleeland. 1987. Method of evaluating effects of antibiotics on bacterial biofilm. Antimicrob. Agents Chemother. 31:1502-1506.