Team:Tokyo Tech/Project/Artificial Cooperation System/modeling
From 2010.igem.org
3-4 modeling
Contents |
Mathematical modeling
Abstract
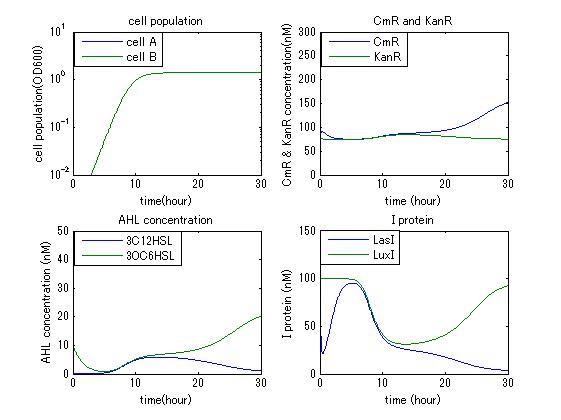
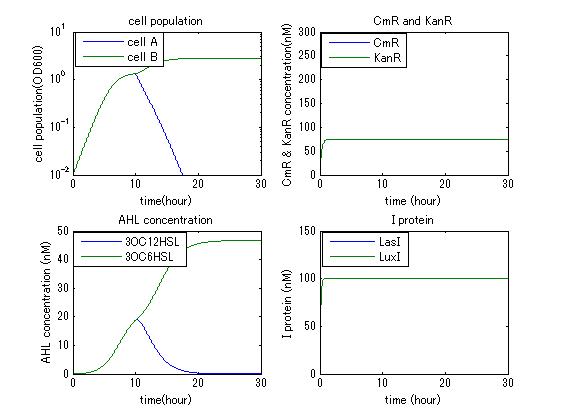
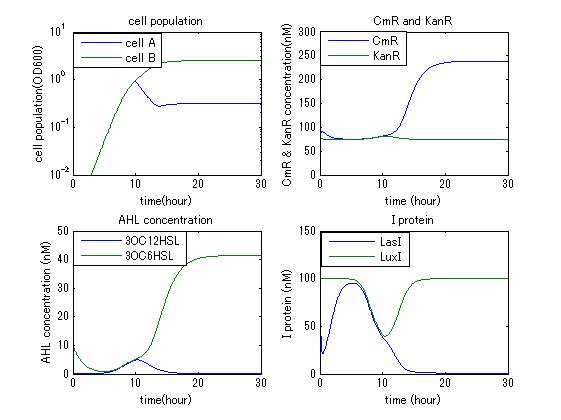
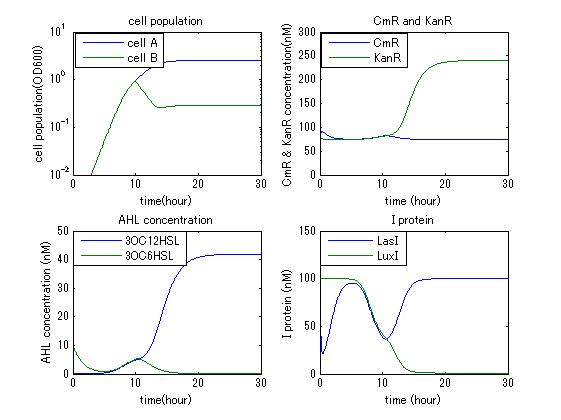
In order to confirm the feasibility of the Artificial Cooperation System, we simulated the system under typical four experimental conditions. First, when the system worked and any antibiotics did not exist, cell A and cell B in the system showed no difference of growth (Fig.1). Second, when the system did not work and chloramphenicol existed, the number of sell A decreased while the number of cell B increased (Fig.2). Third, when the system worked and chloramphenicol existed, the number of cell A increased after temporal decline (Fig.3), which means it was rescued by Artificial Cooperation System. Fourth, in the contrast, when the system worked and Kanamycin existed, the number of cell B increased after temporal decline (Fig.4). From the above results, the feasibility of the Artificial Cooperation System was confirmed.
Model development
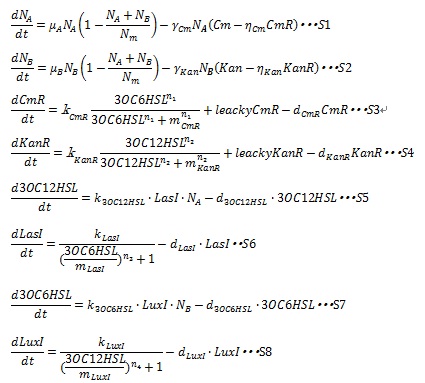
In order to simulate the Artificial Cooperation System, we developed an ordinary differential equation model. The state variables and parameters used in the model are described in detail in Table1.
In the Artificial Cooperation System, the major kinetic events are: cell population growth; resistance gene expression under the control of quorum sensing activation promoters; AHLs synthesis and degradation; I protein synthesis under the control of quorum sensing repressive promoters. These kinetic events are contained in the equations. Following sentences describe how the equations are developed.
I, Cell Population Growth
The growth rate of each type of cell without effect of antibiotics can be described by the following logistic growth equation:
where N denotes the number of cells, Nm denotes the maximum allowed number of cells due to nutrient limitation, and μ is a constant coefficient. The maximum growth rate is proportional to the number of cells and the growth rate is inhibited by the number of cells due to nutrient limitation.
When two types of cell coexist, the growth rates of the both type of cell are described in the following equations:
The maximum growth rate of each type of cell is proportional to the number of their type of cells and the growths are inhibited by the total number of the cells in the system (1-(NA+ NB)/ Nm)
The growth inhibition by antibiotics is represented by the following equations:
where Cm and Kan denote chloramphenicol and kanamycin concentration respectively. The rate of decreasing the number of cells is proportional to the product of multiplying antibiotics concentration and the number of cell. Here, &gamma is the rate constant.
The antibiotic resistance enzyme releases the antibiotic growth inhibition dependent on the enzyme concentration. Then, S12 and S13 are replaced by the following equations:
Where CmR and KanR are the concentration of the chloramphenicol and kanamycin resistance enzyme, respectively, and η is constant for specific gene. Here, if (Cm-ηCmCmR) or (Kan-ηKanKanR) is negative, these terms are set to zero during simulation. As a consequence, the dynamics of the number of cells are described by equation S1 and S2.
II, Resistance gene expression under the control of AHLs In our system, the expression level of resistance gene is regulated by R protein-AHL complex. R proteins, LuxR and LasR, are assumed to be synthesized sufficiently so that the concentration of the complex depends on only the AHL concentration. Thus the synthesis rates of resistance enzyme are described by Hill function dependent on the AHL concentration (equation S16 and S17).
Together with the leaky production of the resistance enzymes and the degradation of resistance enzymes, equation S3 and S4 are employed to simulate the expression of resistance genes.
where leakyCmR and leakyKanR denote the leaky production of chloramphenicol and kanamycin resistance enzyme respectively, kCmR and kKanR denote the maximum synthesis rate of each enzyme, respectively. n1 and n2 are Hill coefficient. mCm and mKanR denote the AHL concentration required for producing half level of each enzyme, respectively.
III, AHL synthesis and degradation
AHL is enzymatically synthesized by I protein from some substrates. For the simplicity, we assumed the amount of substrates is sufficient so that the AHL synthesis rate are estimated to be proportional to the cognate I protein. The degradation rate of AHL is assumed to decay with first-order kinetic. The dynamical behaviors of AHLs concentration are described by the following equations (S5 and S7):
where, k3OC6HSL, k3OC12HSL, d3OC6HSL and d3OC12HSL denote constant coefficients.
IV, I protein production under the control of AHL dependent promoter The synthesis of I proteins can be generated by Hill function according to the concentration of AHL like the expression of resistance gene. Though the resistance genes are activated by AHLs, the production of I proteins is repressed by AHLs. So, we employ the following Hill function (equation S18 and S19)
Where, kLuxI and kLasI denote maximum production rate of LuxI and LasI. When the concentration of AHL is 0nM. n3 and n4 are Hill coefficients. mLuxI and mLasIdenote the AHL concentration required for producing half level of I proteins. Therefore dynamics equations of I proteins production are listed in equation S6 and S8.
Where dLuxIand dLasI denote constant coefficient.
Prameters
Parameters we used to simulate the system is listed in Table1.
 "
"
