Team:Tokyo Tech/Project/wolf coli/System
From 2010.igem.org
4-3 Wolf coli System
Contents |
Genetic circuit
circuit
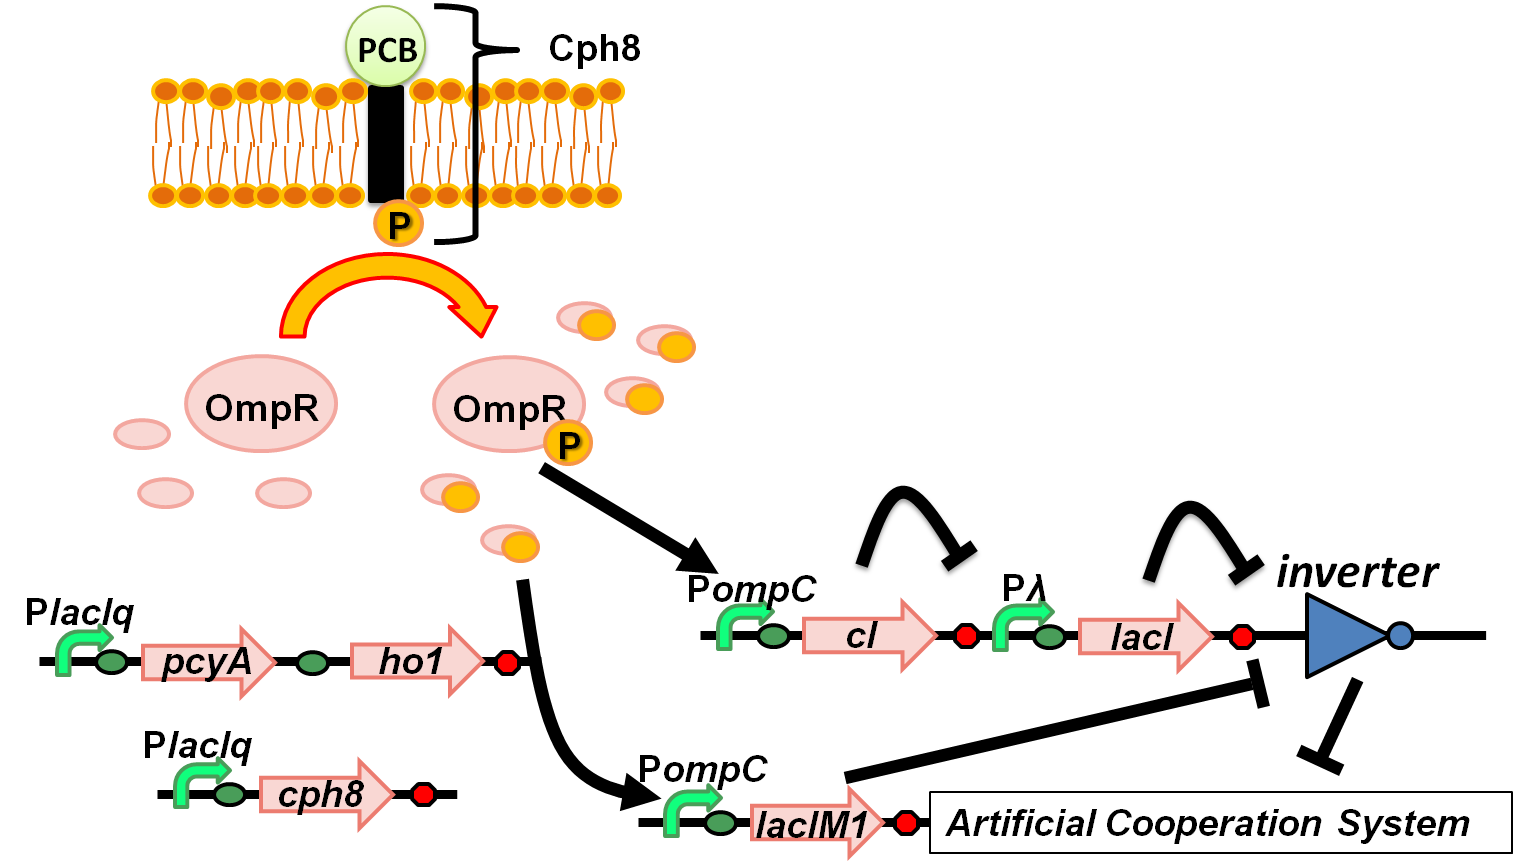
We aimed to introduce a red-light-dependent gene expression network and the band-detect network into the Artificial Cooperation System. (Fig. 4-3-1) These two systems were integrated and linked together by applying OmpR. OmpR usually works as a regulative factor of red-light sensing system, and we utilized this to regulate the band-detect network. OmpR is a transcriptional regulator, which activates the expression of cI and LacIM1 in this system
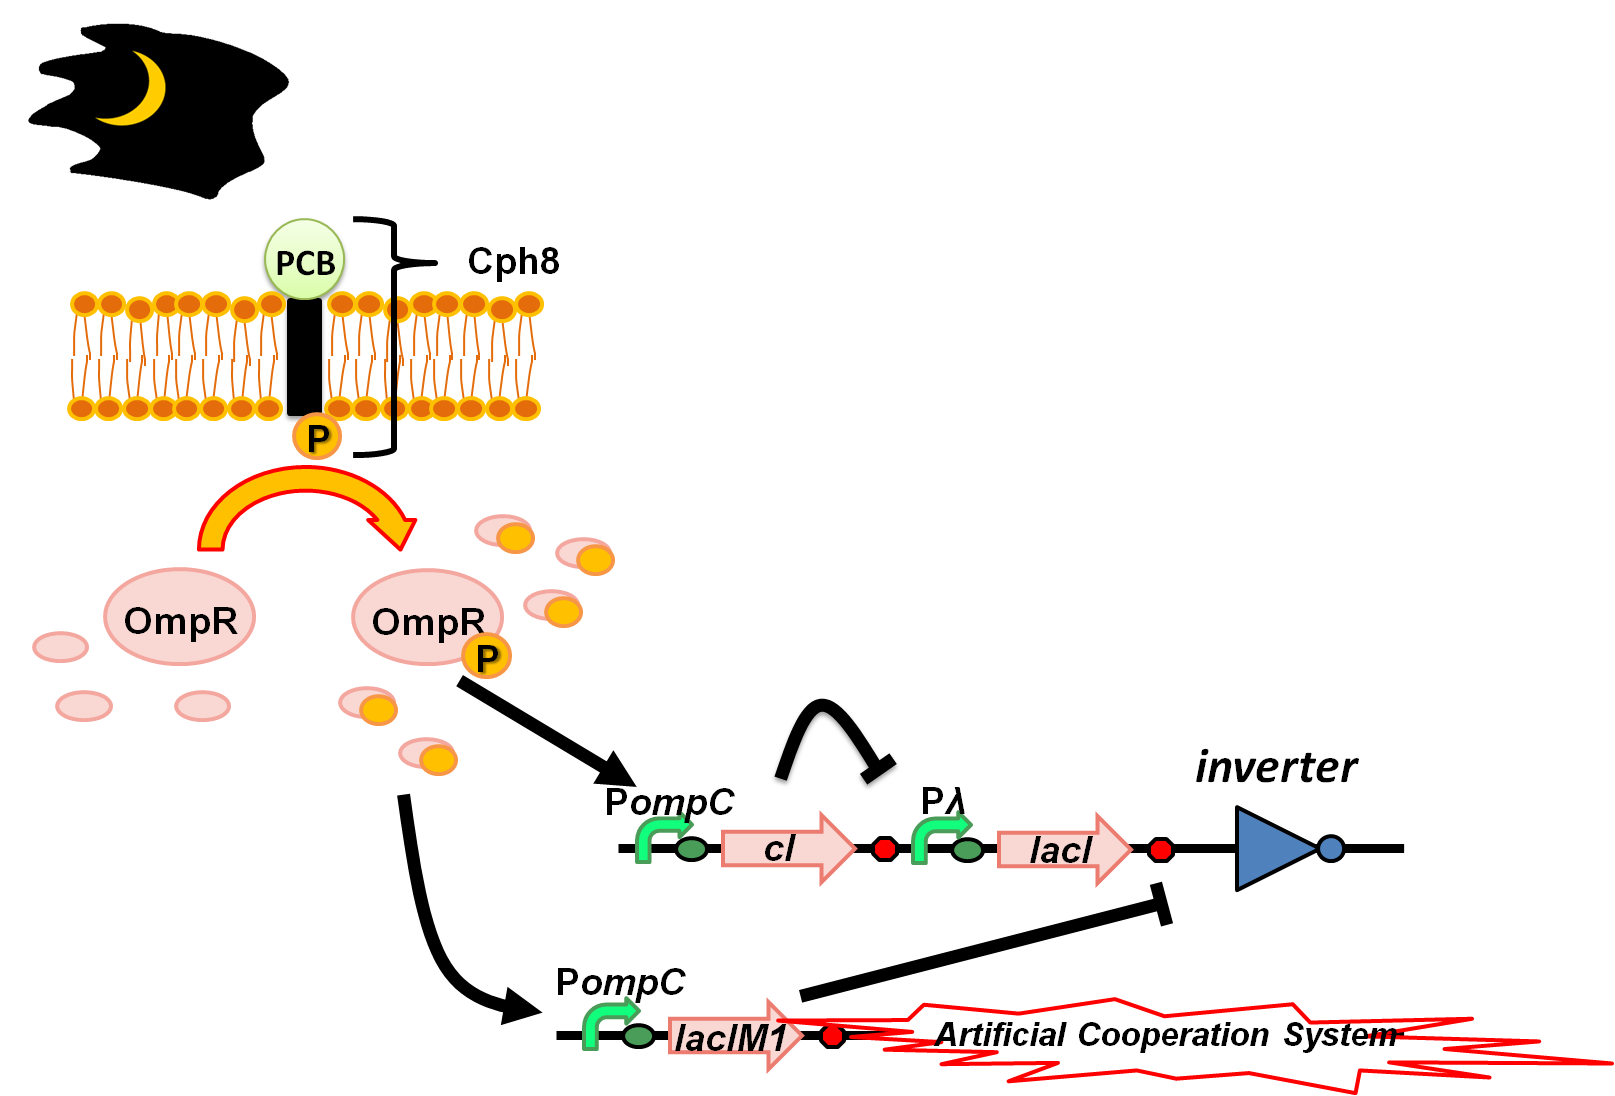
During dark nights (Weak light intensity) (Fig. 4-3-2)
Light drives the sensor to a state in which phosphorylation of OmpR is inhibited. Since unphosphorylated OmpR doesn’t bind to OmpC promoter, there would be only basal expression level of OmpC promoter. In this condition LacIM1 and cI are expressed at basal levels. This enables the expression of a wild-type LacI and again results in repression of the inverter. Thus again Artificial Cooperation System turns on, and two types of cell would save each other from dying while communicating with each other.
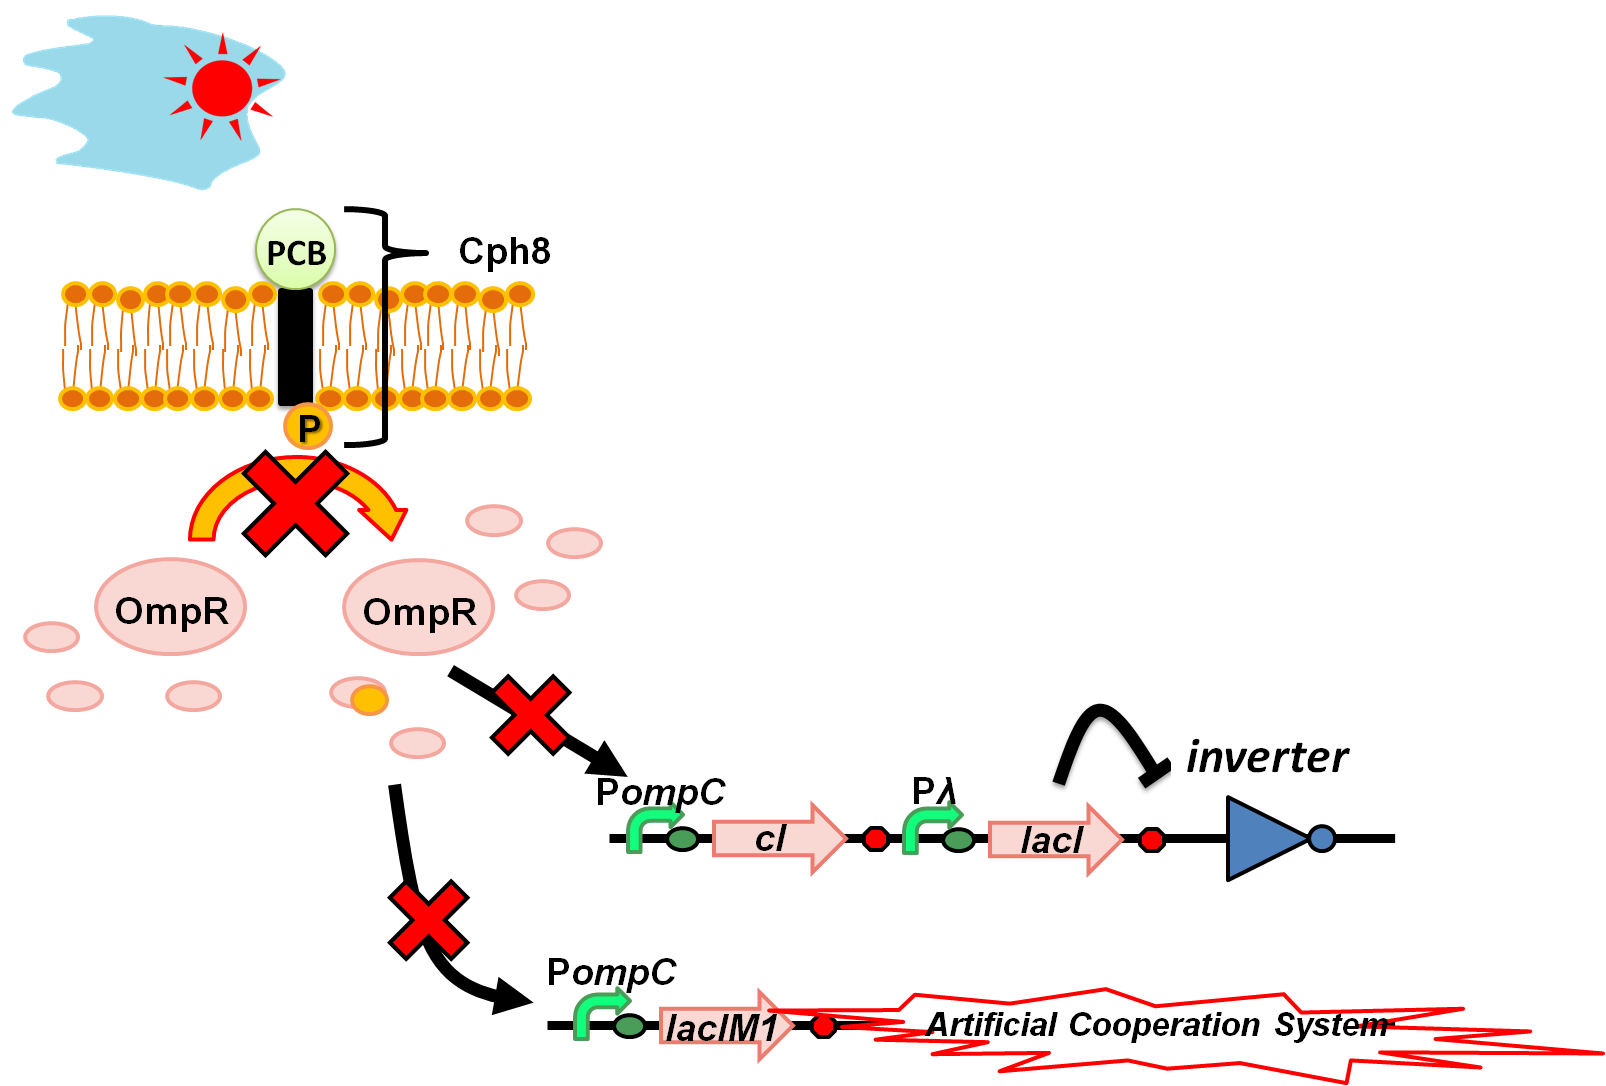
At daytime (Strong light intensity) (Fig. 4-3-3)
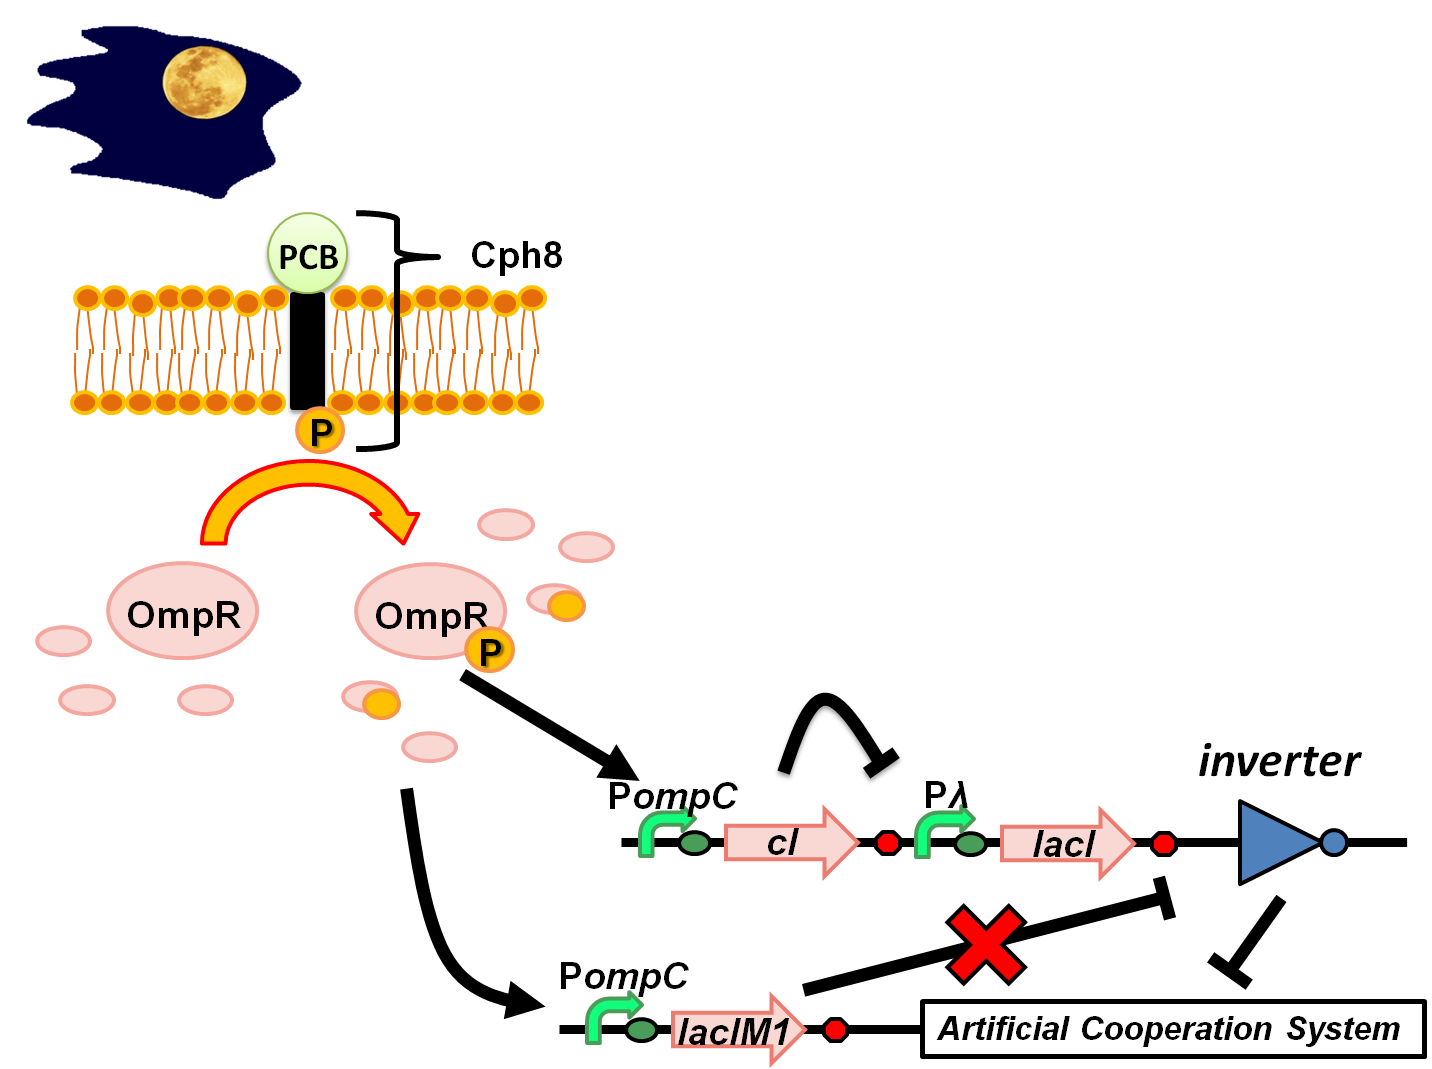
At full moon night (Medium light intensity) (Fig. 4-3-4)
Medium level of phosphorylated OmpR ratio results in moderate levels of cI and LacIM1. However, because the repression efficiency of cI is significantly higher than that of LacIM1, cI effectively shuts off LacI expression while the LacIM1 concentration is below the threshold required to repress the inverter. This difference between the cI and LacIM1 repression efficiencies drives the inverter to a state of turning on.
This results in turning off the Artificial Cooperation System. Thus, the two types of cell would not rescue each other in crisis situation since they can’t communicate. Due to these behaviors, we called the designed E.coli“Wolfcoli”.
Red-light-dependent gene expression network
A red-light-dependent gene expression network has been introduced into E. coli [1]. And these BioBrick parts have been registered. Photoreceptors are not found in E. coli. Then, they introduced a light sensor from a cyanobacterium into E. coli. The response regulator of phytochrome does not directly regulate gene expression, so they fused a cyanobacterial photoreceptor from Cph1 to an E. coli intracellular histidine kinase domain and response-regulator from EnvZ–OmpR. Moreover, Cph1–EnvZ chimaeras were then activated by introduction of two phycocyanobilin-biosynthesis genes that convert heme into phycocyanobilin.
In weak red light condition, Cph1–EnvZ chimeras are activated. EnvZ is autophosphorylated and passes phosphoryl group intramolecularly to OmpR. Then, phosphorylated OmpR binds to OmpC promoter and activates the transcription of the downstream gene. In strong red light condition, Cph1–EnvZ chimaeras are not activated. EnvZ is dephosphorylated, and thus phosphorylation of OmpR doesn’t occur. Then, OmpR can’t bind to OmpC promoter, Therefore, the transcription of the downstream gene doesn’t occur.
The important point in this system is, light intensity determines expression of the ratio of phosphorylated OmpR.
Band-detect network
Band-detect network exhibits transient gene expression in response to concentration of chemical signals [2]. Previously, USTC(2008) attempted to build this circuit and registered parts for this circuit[3].
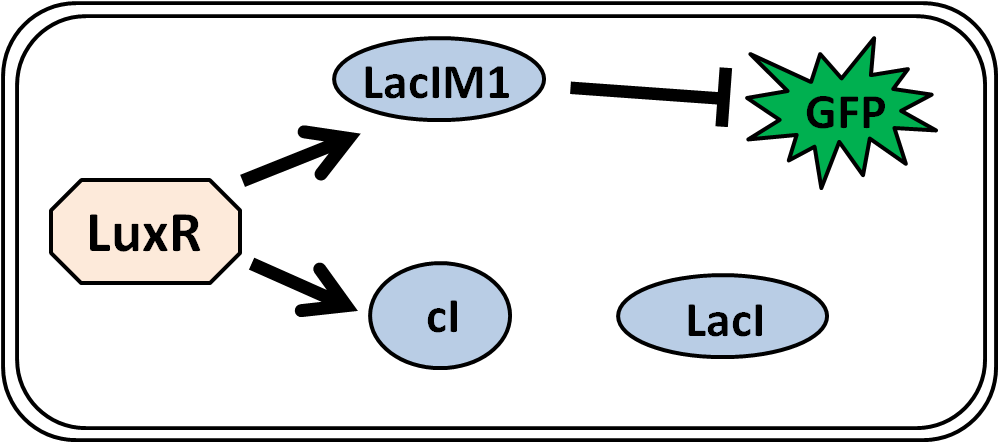
According to Basu’s group paper, LuxR, an AHL-dependent transcriptional regulator was used. LuxR activates the expression of cI and LacIM1. LacIM1 shows weaker repression than LacIWT because it has a lower affinity to lac promoter (Fig. 4-3-5).
・High concentration of AHL(Fig. 4-3-6a) results in high levels of cI and LacIM1 and repression of GFP.
・At low concentration of AHL(Fig. 4-3-6b), Lac IM1 and cI are expressed only at basal levels. This enables the expression of a LacIWT, again resulting in GFP repression.
・At intermediate concentration of AHL (Fig. 4-3-6c), this results in moderate levels of cI and LacIM1. However, because the repression efficiency of cI is significantly higher than that of LacIM1, cI effectively shuts off LacI expression while the LacIM1 concentration is below the threshold required to repress GFP production. This difference between the cI and LacIM1 repression efficiencies, in combination with a feed-forward loop that begins with LuxR and culminates in GFP, affords the circuit the desired non-monotonic response to AHL dosages.
Reference
1. Levskaya A et al. Engineering Escherichia coli to see light. NATURE 2005;438, 441-442
2. Basu S et al. A synthetic multicellular system for programmed pattern formation. NATURE 2005;434,1130-1134
3.USTC(2008)
 "
"
