BIOTEC Dresden/Notepad/17 August 2010
From 2010.igem.org
Revision as of 16:02, 27 October 2010 by Sarah Mansour (Talk | contribs)

AHL Sensor
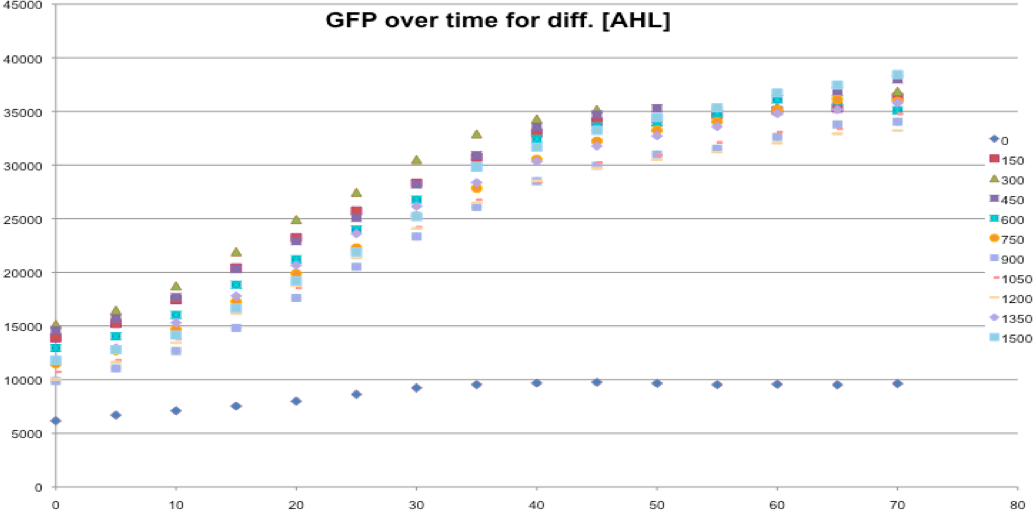
The images below show the outcome of the AHL assay. It ca be seen that the GFP reaches a plateau after approximately 45 minutes.Since the lower AHL concentrations of 200 and 400 nM show the same behavior as the higher concentrations we decided to repeat the assay using AHL concentration of 0.1 to 400 nM.
PCR amplification of the backbone was carried out (samples run on agarose gel) followed by purification of the products. Concentration was determined using Nanodrop. Clearly distinct bands at the same position were noticed for the samples tested. However, a marker with higher molecular weight should be used in future for correctly estimating the size of the product.
July |
1 | 2 | 3 | 4 | 5 | 6 | 7 | 8 | 9 | 10 | 11 | 12 | 13 | 14 | 15 | 16 | 17 | 18 | 19 | 20 | 21 | 22 | 23 | 24 | 25 | 26 | 27 | 28 | 29 | 30 | 31 |
August |
1 | 2 | 3 | 4 | 5 | 6 | 7 | 8 | 9 | 10 | 11 | 12 | 13 | 14 | 15 | 16 | 17 | 18 | 19 | 20 | 21 | 22 | 23 | 24 | 25 | 26 | 27 | 28 | 29 | 30 | 31 |
September |
1 | 2 | 3 | 4 | 5 | 6 | 7 | 8 | 9 | 10 | 11 | 12 | 13 | 14 | 15 | 16 | 17 | 18 | 19 | 20 | 21 | 22 | 23 | 24 | 25 | 26 | 27 | 28 | 29 | 30 | |
October |
1 | 2 | 3 | 4 | 5 | 6 | 7 | 8 | 9 | 10 | 11 | 12 | 13 | 14 | 15 | 16 | 17 | 18 | 19 | 20 | 21 | 22 | 23 | 24 | 25 | 26 | 27 | 28 | 29 | 30 | 31 |
 "
"


