Team:Imperial College London/Results/Exp2
From 2010.igem.org
m |
|||
| (One intermediate revision not shown) | |||
| Line 9: | Line 9: | ||
{|style="width:850px;background:#f5f5f5;text-align:justify;font-family: helvetica, arial, sans-serif;color:#555555;" cellspacing="5"; | {|style="width:850px;background:#f5f5f5;text-align:justify;font-family: helvetica, arial, sans-serif;color:#555555;" cellspacing="5"; | ||
|- | |- | ||
| - | |Addition of catechol to a a culture of cells constitutively expressing C2,30 enzyme results | + | |Addition of catechol to a a culture of cells constitutively expressing C2,30 enzyme results in the production of yellow colonies on plate or yellow broth if ''E.coli'' is grown in liquid media. In a lab where a spectrophotometer is readily available anyone can accurately quantify production of even the smallest quantity of the yellow 2-hydroxymuconic semialdehyde product. However, as our biological detector is intended for field use where sophisticated spectroscopic equipment is not available, it was obvious that we needed to establish the threshold value at which a positive result would be detectable by the naked eye. |
| - | The set up of this experiment involved preparation of XylE expressing E.coli cultures at an O.D. of 0.5 in LB and M9 medium. Then a gradient of catechol concentrations was prepared and added to the cell cultures. A group of 5 individuals | + | The set up of this experiment involved preparation of XylE expressing ''E.coli'' cultures at an O.D. of 0.5 in LB and M9 medium. Then a gradient of catechol concentrations was prepared and added to the cell cultures. A group of 5 individuals were given the test cultures and asked where they were no longer able to see the yellow color - to avoid bias the lab member preparing the test samples did not take the test. The concentrations where the transition from apparent yellow to colourless occurred were identified and a second gradient of catechol concentrations in ranging between the earlier transition concentrations was prepared. The highest catechol concentration was the least yellow from the first part of the experiment, while the lowest catechol concentration was the first "colourless" concentration from the first part of the experiment. Again the group of 5 testers identified the transition concentrations from yellow to colorless. |
| | | | ||
<div ALIGN=right> | <div ALIGN=right> | ||
| Line 18: | Line 18: | ||
|[[Image:PA190014.JPG|200px]] | |[[Image:PA190014.JPG|200px]] | ||
|- | |- | ||
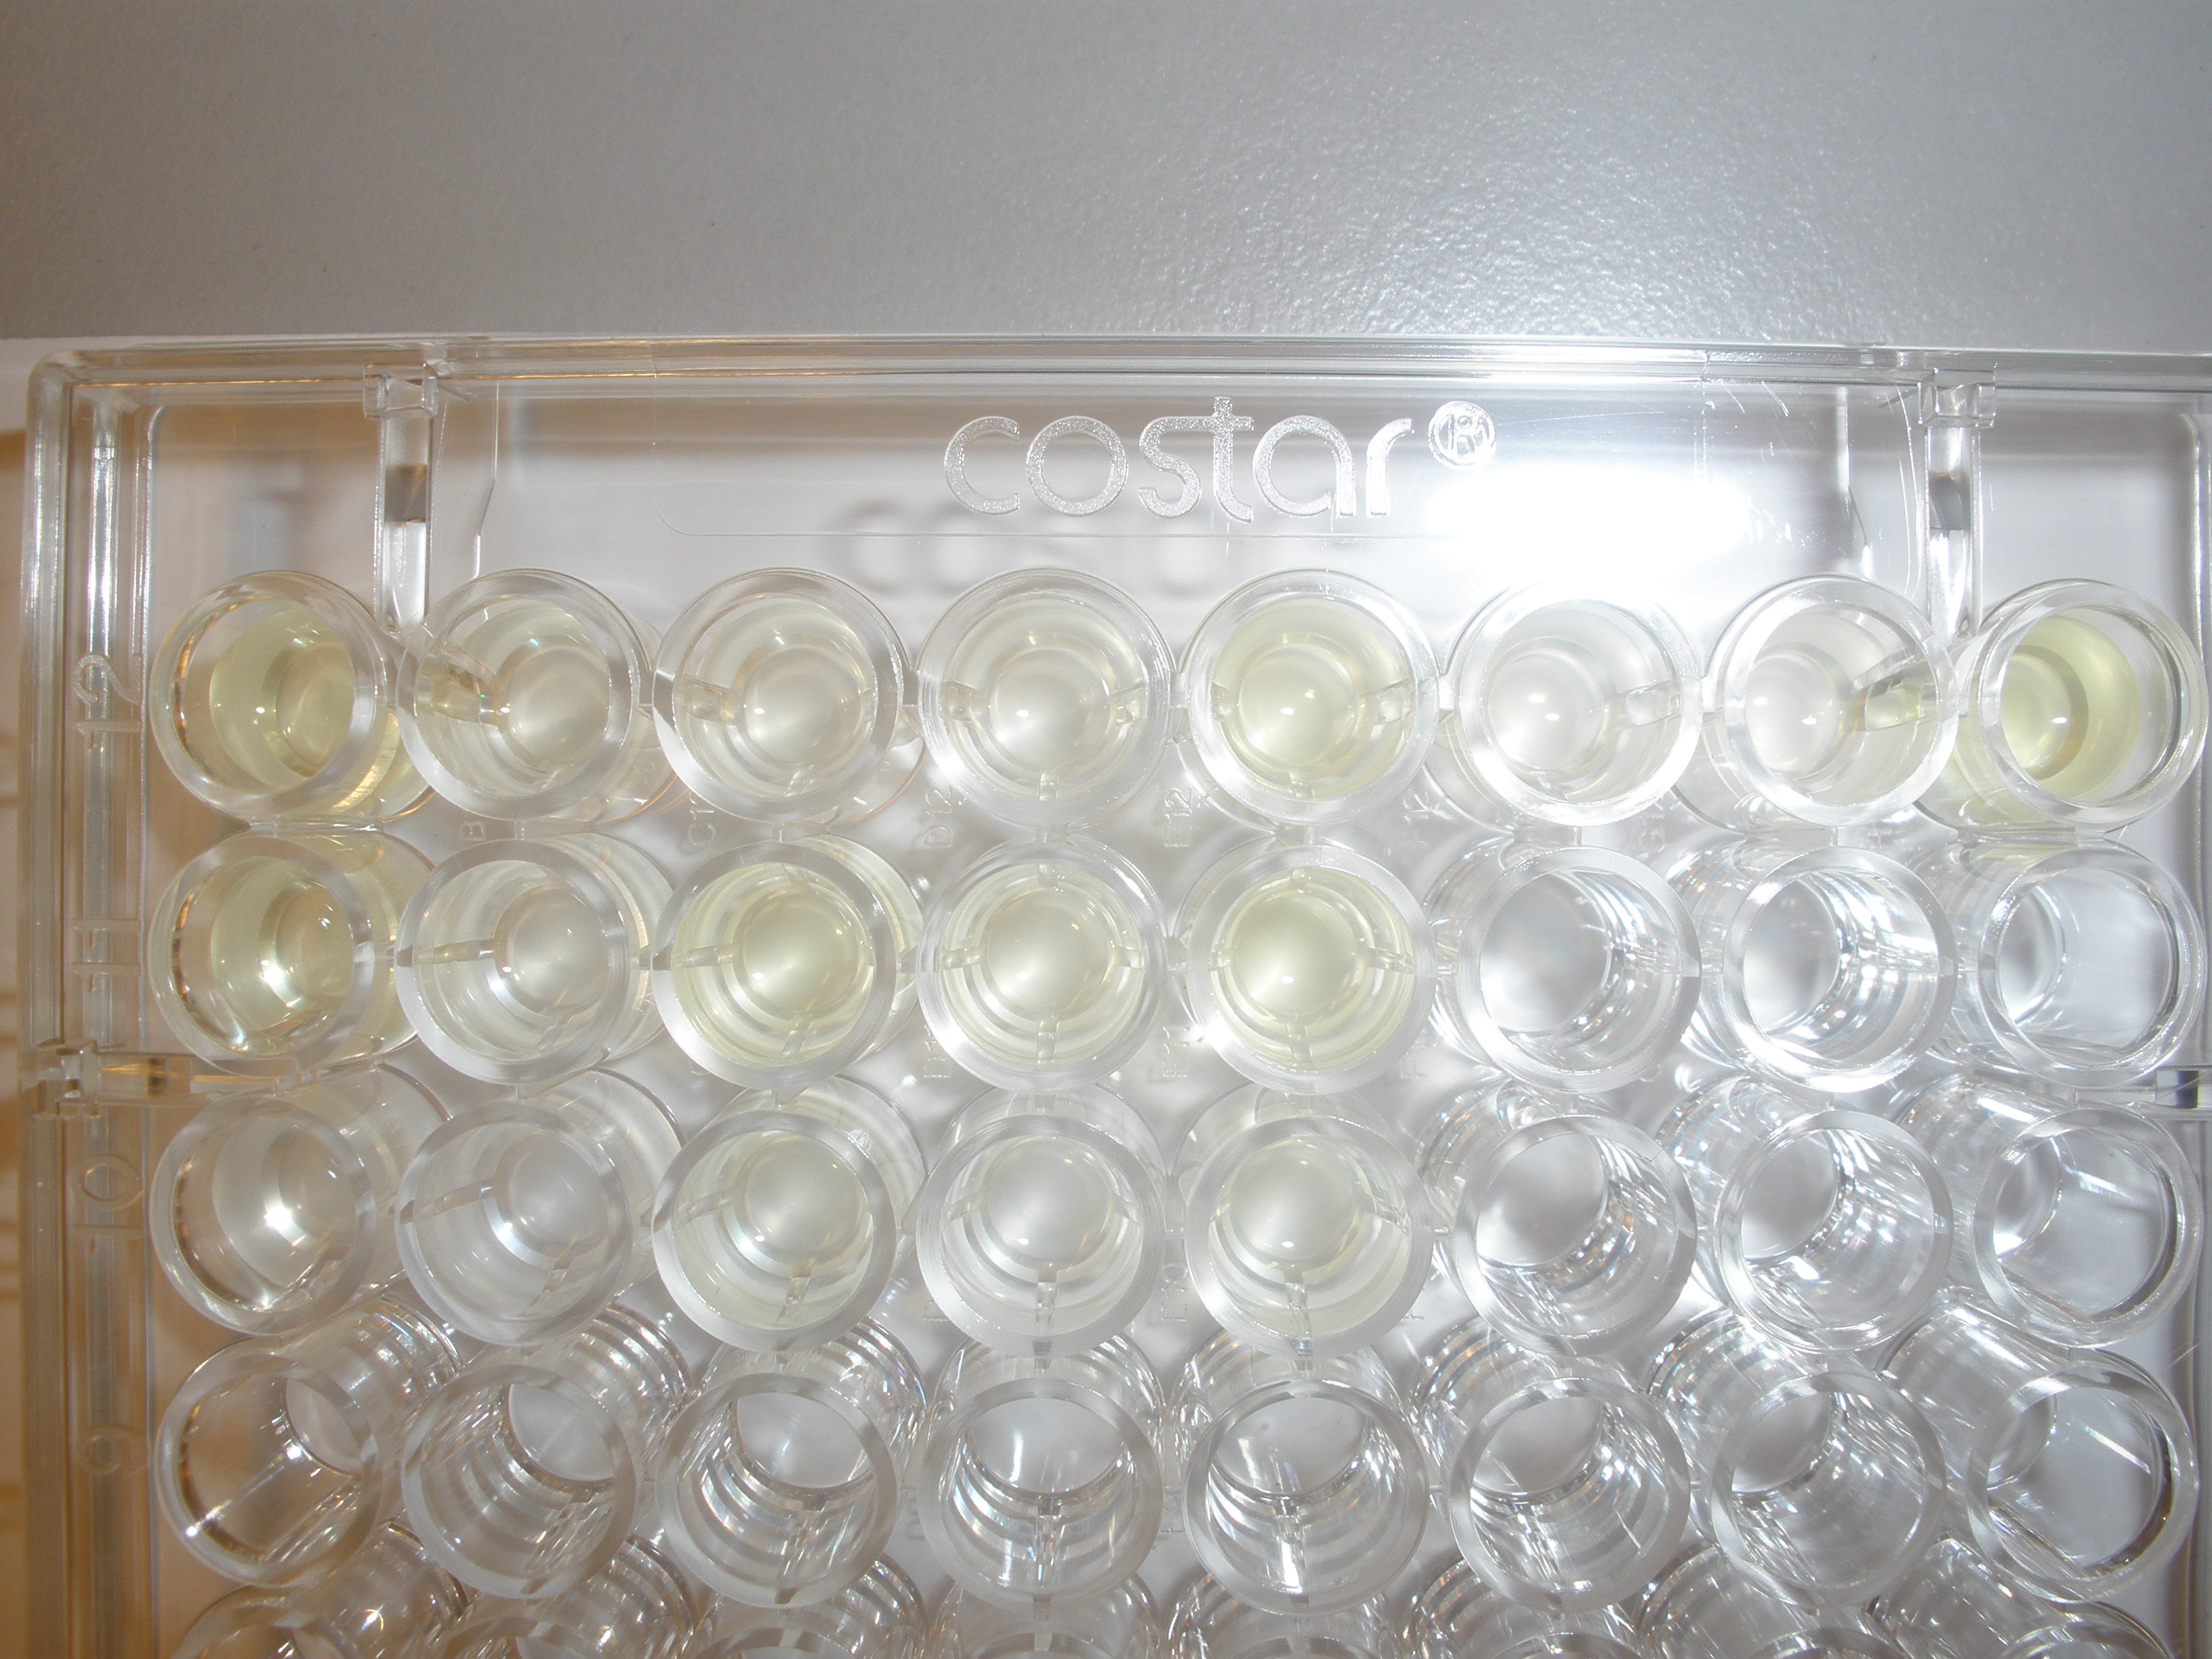
| - | |Threshold value experiment was conducted on a 96 well plates. Yellow wells are the positive tests, LB | + | |Threshold value experiment was conducted on a 96 well plates. Yellow wells are the positive tests, LB colour and M9 colour mediums wells are the negative tests. |
|} | |} | ||
</div> | </div> | ||
| Line 24: | Line 24: | ||
The threshold concentration of catechol needed for a person to identify a yellow positive test was found to be '''30-40μM'''. | The threshold concentration of catechol needed for a person to identify a yellow positive test was found to be '''30-40μM'''. | ||
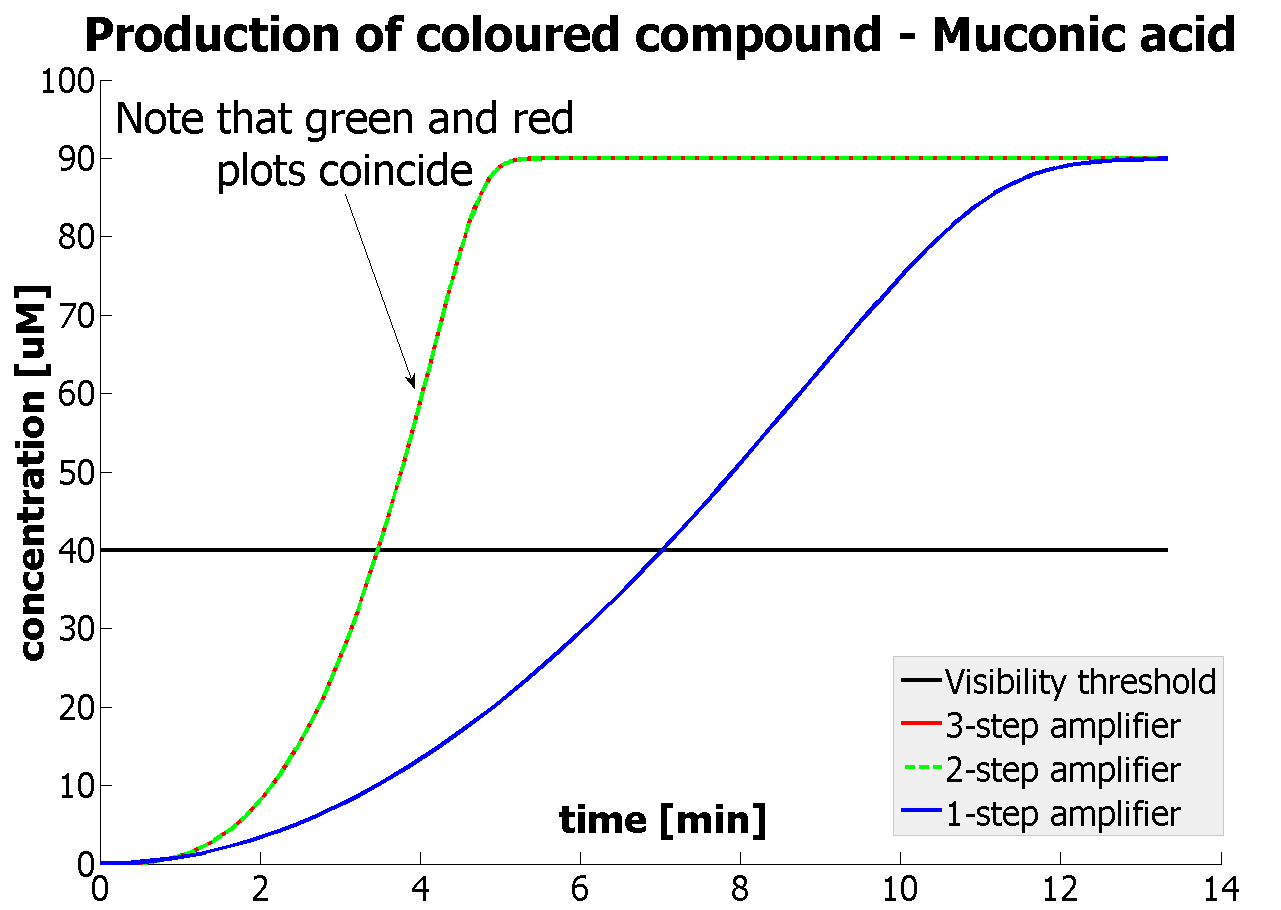
| - | This result was fed back to the modelling team and allowed them to | + | This result was fed back to the modelling team and allowed them to suggest the concentration values of catechol to be used. Furthermore, it facilitated the determination of conditions for 2-step amplification performing better than 1-step amplifier. The prediction is that for our system 2-step amplification output will be visible around <b>4 minutes</b> earlier than the1-step amplification system (see the graph below) If you want to know more on output amplification modelling, please follow the [[Team:Imperial_College_London/Modelling | link]]. |
<div ALIGN=CENTER> | <div ALIGN=CENTER> | ||
Latest revision as of 03:23, 28 October 2010
| Experimental Results | Exp 1 | Exp 2 | Exp 3 | Exp 4 | Exp 5 | Exp 6 | Exp 7 |
| Testing is a fundamental stage of the engineering design cycle and is a crucial part of charactrising BioBrick Standard Biological Parts so that other people can benefit from our work. We've compiled all our results on this page, detailing how the experiments were carried out and the significance of the data. | |
| Experiment 2 | The threshold value of catechol assay | ||
The threshold concentration of catechol needed for a person to identify a yellow positive test was found to be 30-40μM. This result was fed back to the modelling team and allowed them to suggest the concentration values of catechol to be used. Furthermore, it facilitated the determination of conditions for 2-step amplification performing better than 1-step amplifier. The prediction is that for our system 2-step amplification output will be visible around 4 minutes earlier than the1-step amplification system (see the graph below) If you want to know more on output amplification modelling, please follow the link. |
 "
"


