Team:Imperial College London/Results/Exp6
From 2010.igem.org
| Experimental Results | Exp 1 | Exp 2 | Exp 3 | Exp 4 | Exp 5 | Exp 6 | Exp 7 |
| Testing is a fundamental stage of the engineering design cycle and is a crucial part of charactrising BioBrick Standard Biological Parts so that other people can benefit from our work. We've compiled all our results on this page, detailing how the experiments were carried out and the significance of the data. | |
| Experiment 6 | In vitro characterization of catechol 2, 3 dioxygenase
(C2,3O) in cell lysate | |
|
In a previous experiment investigating cultures of XylE expressing E.coli, the addition of catechol and monitoring the production of HMS product in the plate reader allowed us to obtain a reaction profile of the reaction. However due to technical limitations on measuring velocity of the reaction in whole cell cultures, we were not able to obtain kinetic parameters of the catechol dioxygenase enzyme. In this experiment cell cultures of XylE expressing cells were lysed to obtain cell lysate with catechol dioxygenase activity for determination of kinetic parameters of catechol dioxygenase in vitro. | |
|
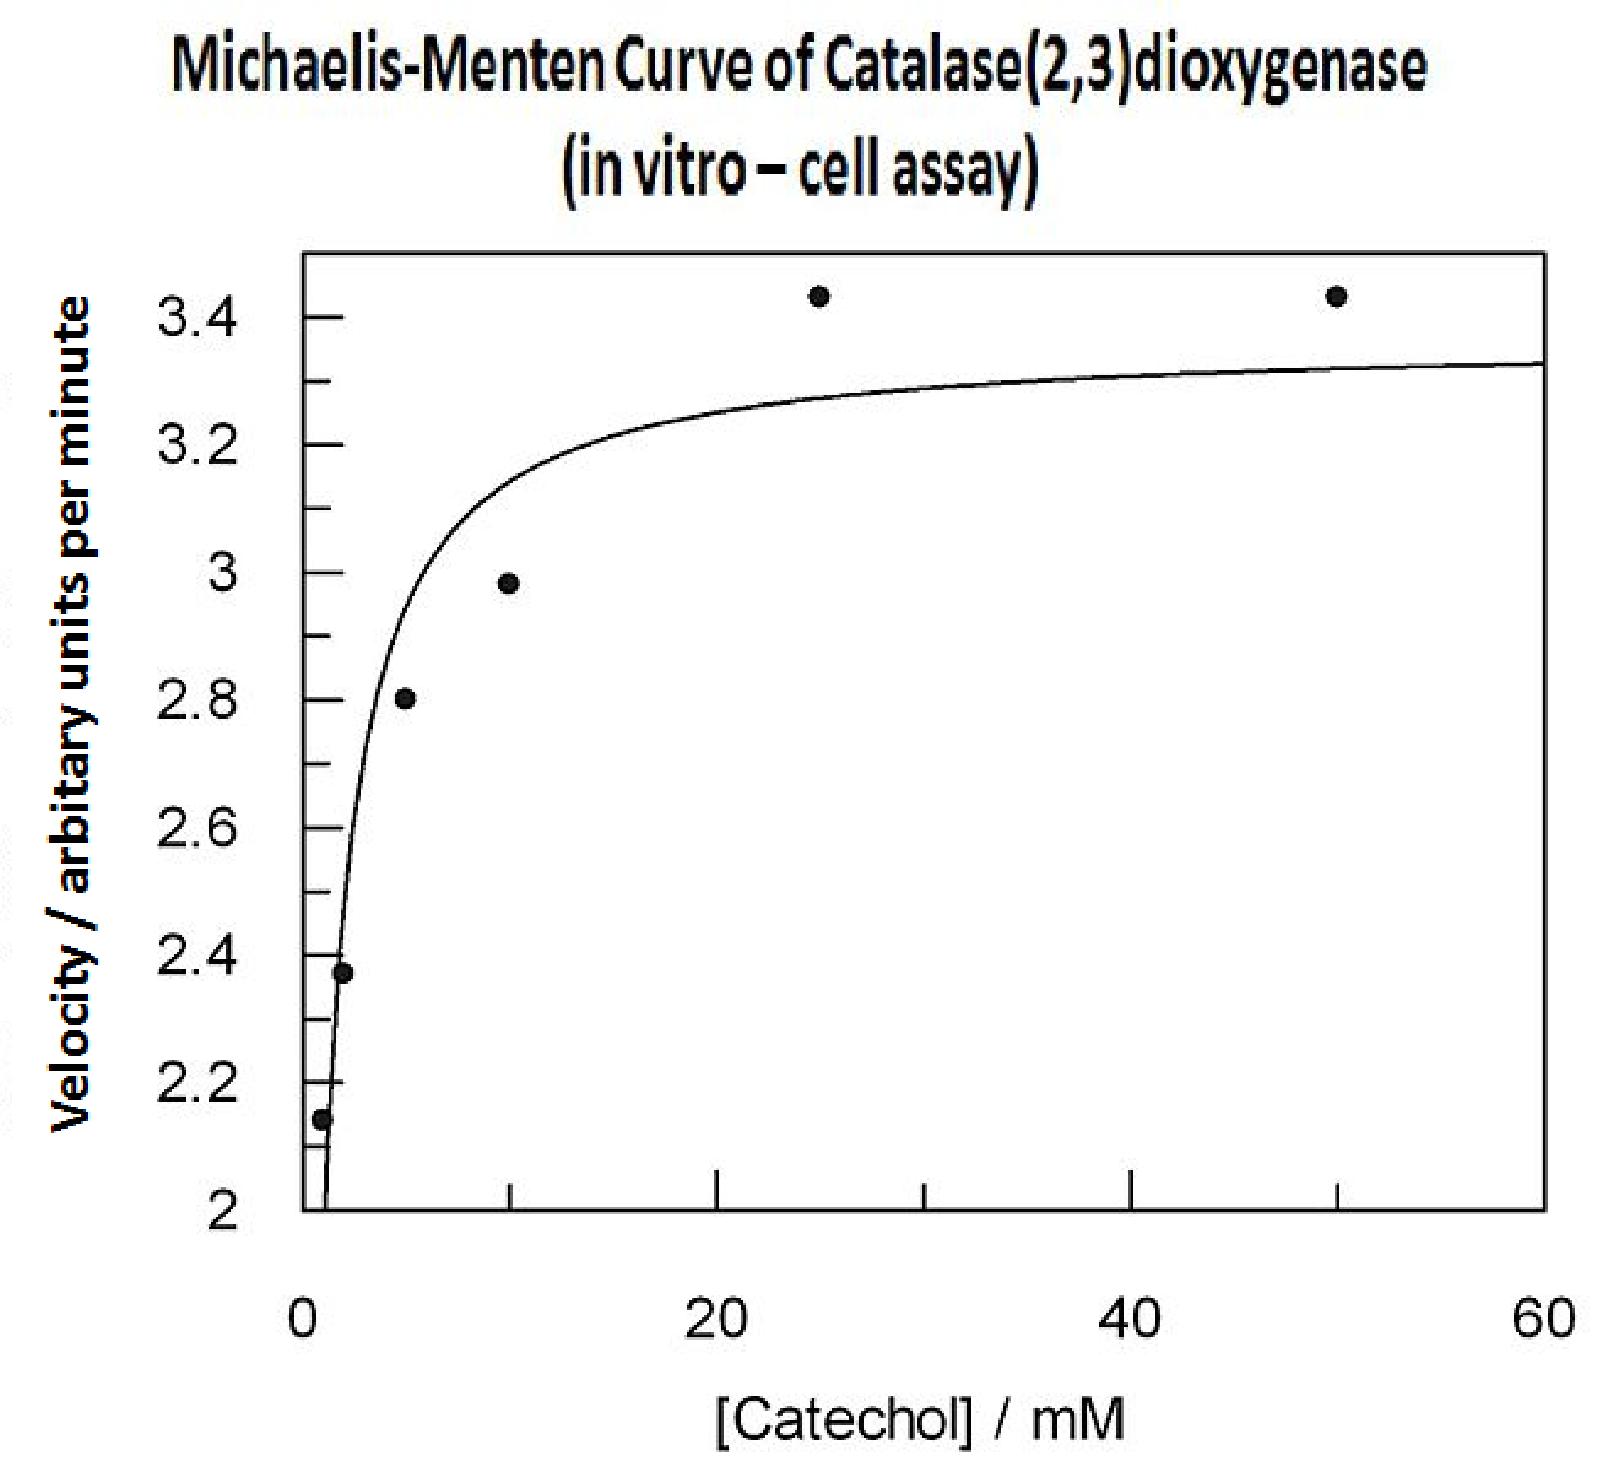
In this experiment cell lysate was assayed with increasing catechol concentrations. The reaction was monitored by measuring colour output of the reaction in the plate reader. The rate at which the yellow HMS product appears is directly proportional to the velocity of the reaction. The cell lysate was prepared from cell culures of XylE expressing cells. Obtaining cell lysate with catechol assay activity allowed us to overcome the technical limitations of over saturating the system too quickly in previous experiment. Diluting the cell lysate will result in lower concentration of total enzyme in the assay, thus less substrate is converted to product per unit of time. This allowed us to take more readings at various time points before the system saturates the detector of the reader. In order to determine what the appropriate dilutions of the cell lysate for the assay, a pre-test was essential where various cell lysate dilutions were tested on their C2,3O activity in respect to the ability of the detector to receive the signal. Data collected from the assay allowed us to construct a Michaelis-Menten curve for the in vitro kinetics of C2,3O in cell lysate. The cell lysate was obtained from a 100ml overnight culture and the lysate was diluted by a factor of 20-fold in order to obtain a suitable concentration of total enzyme for the plate reader assay. The concentrations of catechol used to derive Michaelis-Menten curve were 1, 2, 5, 10, 25, 50 mM, prepared from 1M stock catechol. | |
|
Michaelis-Menten curve was drawn using velocity values calculated from data collected from the catechol assay. The velocity values were calculated from the rate slope at the initial stages of the reaction, as this is the only time when substrate concentration values are accurate. The plot was delineated by non-linear regression analysis using GraFit software tool. The calculated Km is 0.71mM catechol (with a Vmax of 3.37 in O.D. arbitrary units for this dilution of cell lysate). | |
 "
"


