| Results & Conclusions
|
Detection Model
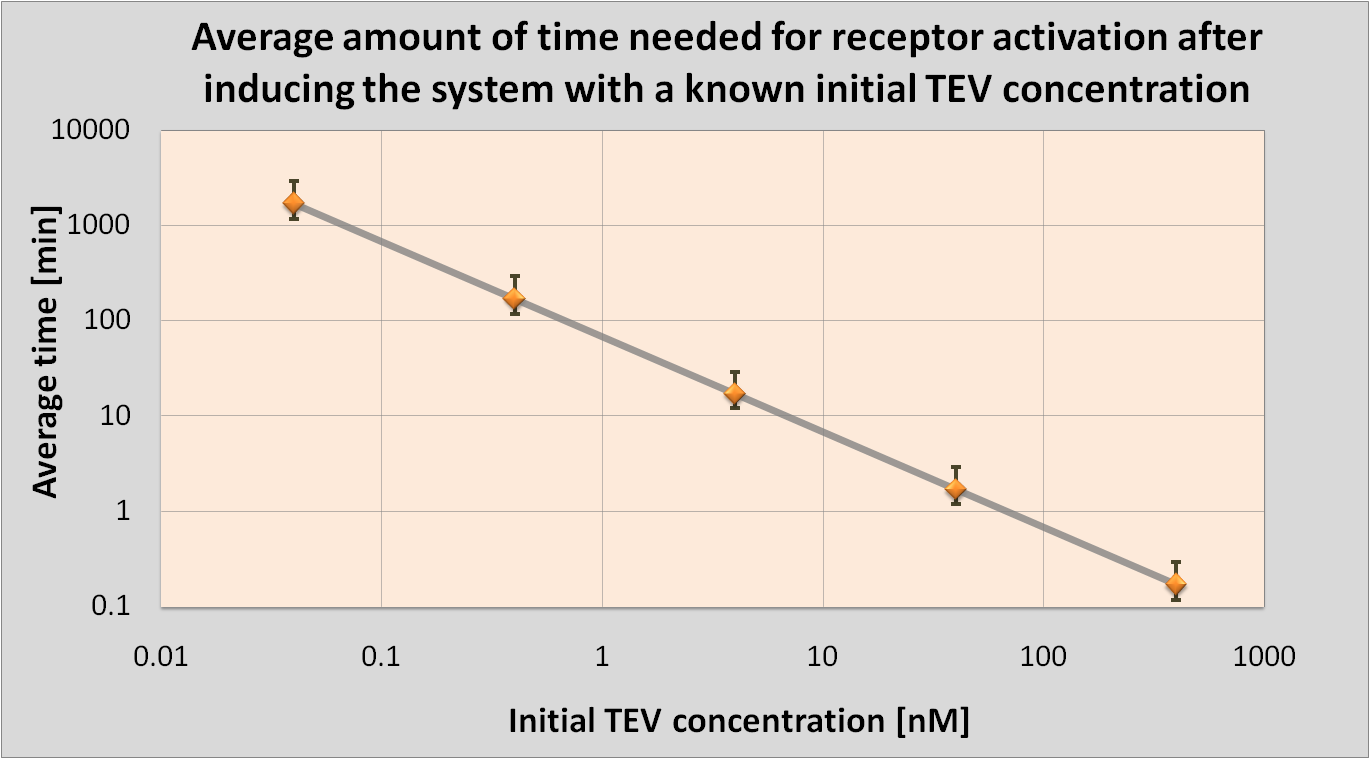
- We determined initial TEV protease concentrations which would result in the optimal activation of the receptor. This optimal activation would happen within 1.5 minutes after elastases come into contact with our cell.

|
| Notice log-log scale.
|
|
Signaling Model
Even though our model of the signaling module is more simplistic than the real life situation, it provided very important results. We were able to determine under which conditions the signaling pathway would be working and could obtain the major constraints of our system. These constraints are that the necessary concentrations for ComD and AIP are reached before signal transduction is started.
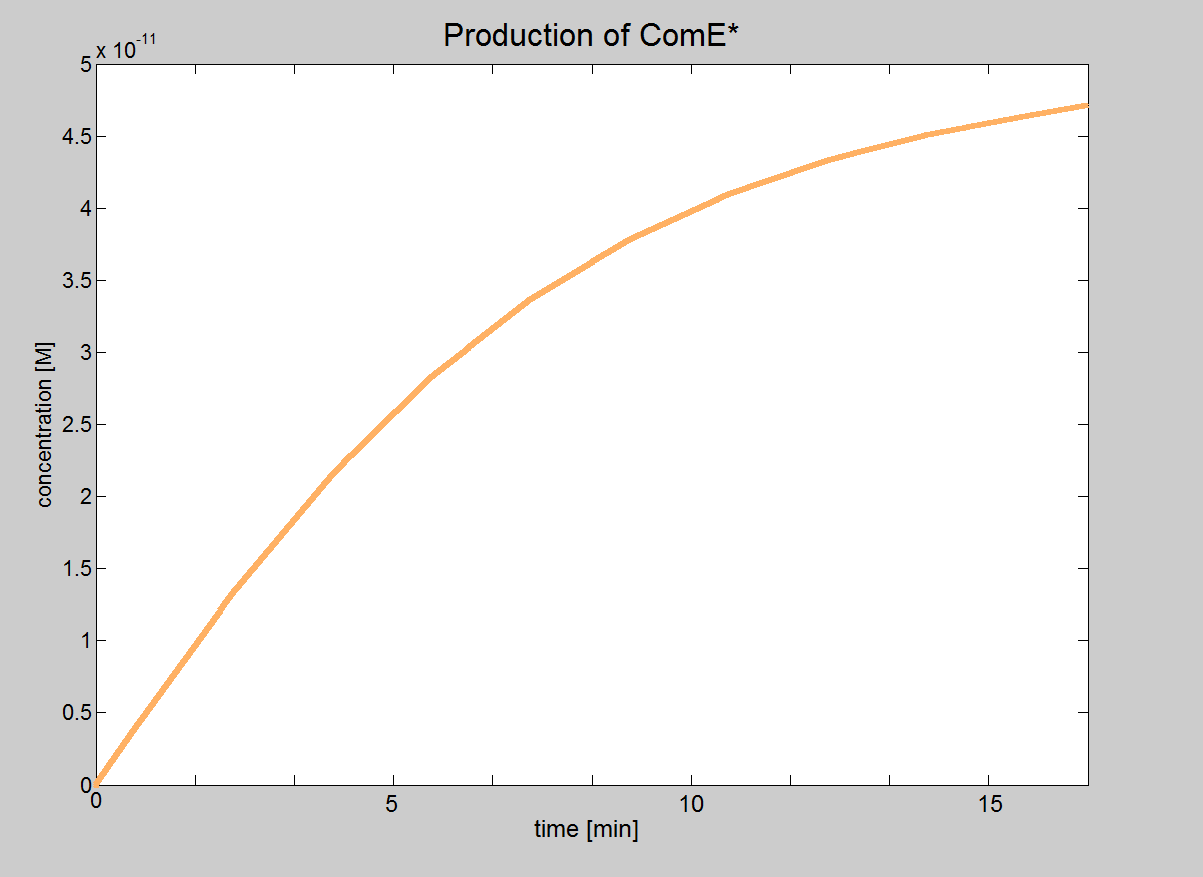
In this model, we will treat phosphorylated ComE (referred to as ComE*) as our "output". Phosphorylated ComE is a transcription factor, which will bind to the DNA to enable transcription.

|
| Graph showing how the concentration of the transcription
|
| factor (phosphorylated ComE) eventually reaches the value 5×10-11M.
|
|
Fast Response Model
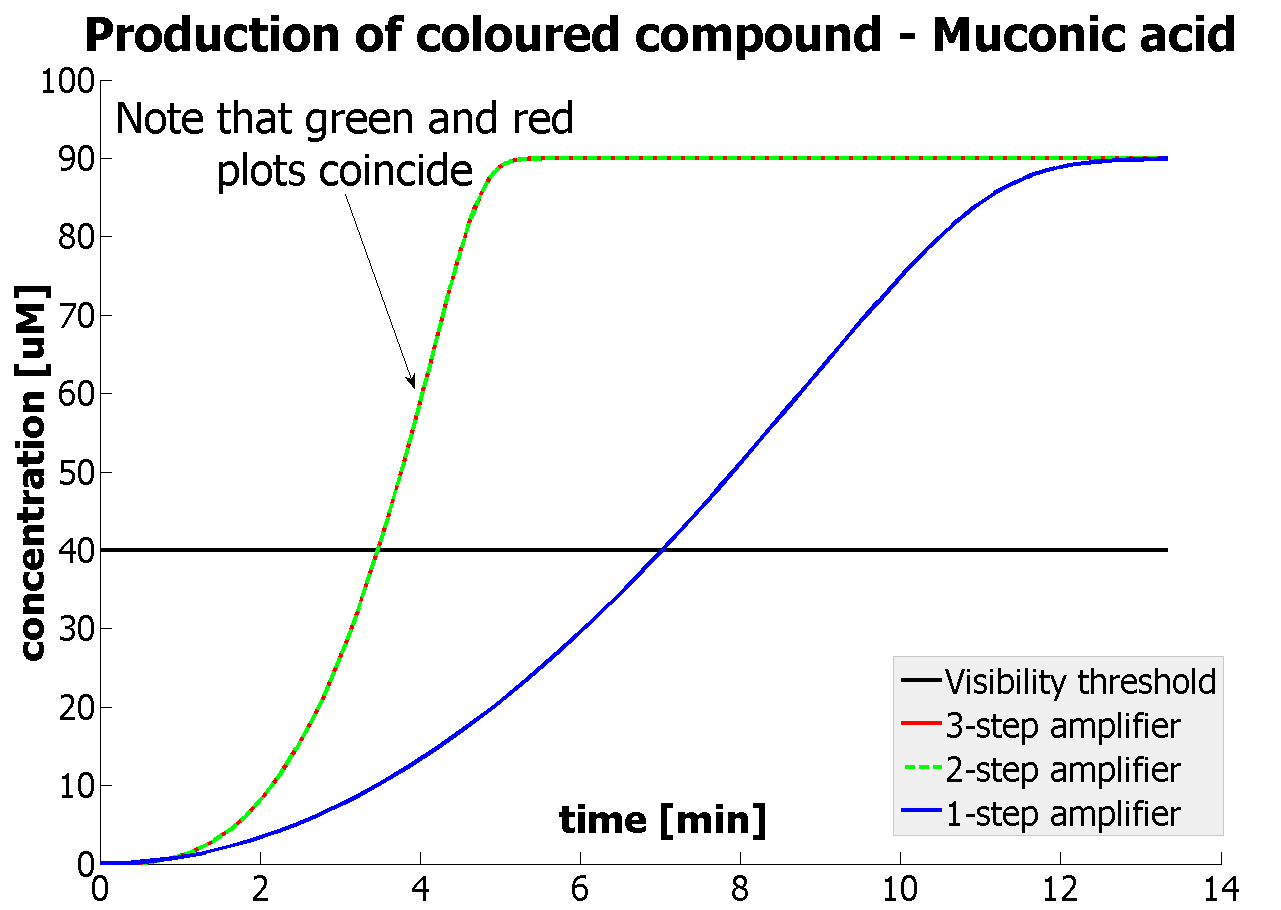
- It was shown that our amplification systems easily outperform the simple production system. Our system can respond within several minutes rather than several hours, which is the case for many currently used reporters.
- It was concluded that there is no advantage of 3-step amplification over 2-step amplification. Therefore, the design of a 3-step amplifier was abandoned.
- The results concerning the 2-step amplification module were not totally conclusive. It could not be firmly decided whether 2-step amplification is going to perform better than 1-step amplification. This is because several of the parameters that 2- and 1-step amplifiers are sensitive to could not be determined with certainty. Two parameters have been recognised as crucial and decisive. These are the protein production rates and the catalytic constants of the enzymes.
- Hence, the conditions for effective amplification were determined (more details are revealed in the Fast Response Model Results page).

|
| Graph showing how our 2-step amplification system outperforms 1-step amplification. Note that time=0 corresponds to when the first transcription happens upon binding of the transcription factor to DNA.
|
|
| Quick overview of the models
|
Detection Model
Goals:
The aim of this model is to determine the concentration of Schistosoma elastase or TEV protease that should be added to the bacteria in order to trigger a response.
It was also attempted to model how long it takes for the protease or elastase to cleave the required amount of peptides to activate receptors.
Elements of the system:
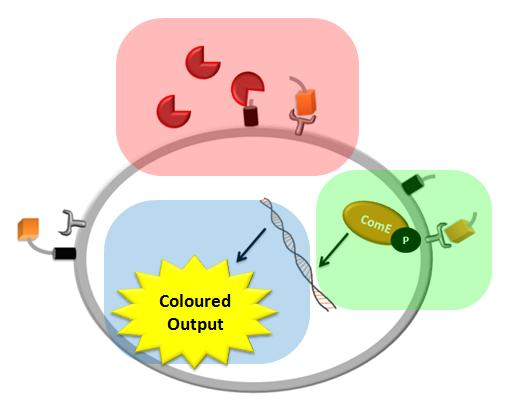
- The surface protein consists of a cell wall binding domain, a linker and AIP (Auto Inducing Peptide)
- Schistosoma elastase (this is the enzyme released by the parasite) cleaves AIP from the cell wall binding domain at the linker site. In the laboratory, we used TEV protease as we could not obtain the Schistosoma elastase.
- The ComD receptor is activated (i.e. AIP concentration is high enough).
Major assumptions:
- The chemical and enzymatic reactions are modelled according to the Law of Mass Action.
- Our model assumes that the modelled system is inert within the bacterial cell or that reactions with other species within the bacterium is negligible. For example, the TEV protease is not supposed to cleave other molecules due to its specifity.
- Due to our carefully chosen cell concentrations, the diffusion of free AIPs could be neglected. However, this restricts the model to the considered cell concentrations only.
- The threshold for receptor activation was defined by one specific value as opposed to considering intermediate states between fully "off" and "on".
|
Signaling Model
Goals:
The aim of this model is to determine under which conditions the signaling transduction will happen in our bacteria.
Elements of the system:
- The signaling model consists of ComD and ComE, which are expressed by our bacteria, as well as AIP and Phosphate. These species are all assumed to be present in the cell at a sufficient concentration.
- The ComD receptor is activated by the AIP. This triggeres phosphorylation of the ComD receptor. The Phosphate group of the ComD receptor then binds to ComE. The phosphorylated ComE binds to the DNA and acts as a transcription factor.
Major assumptions:
- ComD and ComE are present in the cell/cell wall at a high concentration. ComD and ComE are both in steady-state, so the production and degradation constants are negligible.
- AIP and Phosphate are present inside/outside the cell at a high concentration. The degradation rates for these two species are negligible.
- Phosphorylation of the ComD receptor is modelled as an enzymatic reaction, neglecting the formation of an intermediate complex.
|
Fast Response Model
Goals:
This model was mainly developed in order to determine whether simple production is better than 1-, 2- or 3-step amplification. Furthermore, an estimation of the speed of the response was desirable.
Elements of the system:
- Dioxygenase (blue on the diagrams below) is an enzyme that acts on catechol to produce a yellow output. In most of our models, dioxygenase was treated as an output because it was found that active dioxygenase acting on catechol produces the coloured output within a split second.
- GFP-Dioxygenase fusion protein (GFP is shown green on the diagrams). Dioxygenase, which is joined to GFP by the linker, was assumed to be inactive.
- TEV protease (pink on the diagrams below) has the ability to cleave the GFP-Dioxygenase fusion protein, hence, it activates dioxygenase
- Split TEV protease (purple on the diagrams below) is an inactive split form of TEV mounted on coiled coils. It can be activated again by coiled coils being cleaved by another active TEV.

|
| Simple production upon activation of an arbitrary colour output by transcription and translation indicated by the blue arrow.
|

|
| Dioxygenase (C230) is simply produced. Upon activation at time t=0, it acts on catechol (cat.) to produce the yellow output - muconic acid. Catechol is not shown to be produced by the cell as it is added manually at an arbitrary time.
|

|
| The species that are shown in front of the vertical line (which indicates the beginning of the experiment) indicate that they have been accumulated beforehand in the cell. TEV protease activates inactive dioxygenase which acts on catechol to produce colour.
|

|
| This diagram introduces inactive split TEV protease attached to a coiled-coil as the third amplification step. Both inactive compounds have active sites for TEV to activate them, which results in multiple possibilities of action.
|
Major assumptions:
- The chemical and enzymatic reactions are modelled according to the Law of Mass Action.
- Our model assumes that the modelled system is inert within the bacterial cell or that reactions with other species within the bacterium is negligible. For example, the TEV protease is not supposed to cleave other molecules due to its specifity.
|
 "
"


