Team:USTC Software/demoMain
From 2010.igem.org
1. Part: BBa_F2620
Toggle Switch
Modeling Details of Toggle Switch
Repressilator
Modeling Details of Repressilator
Part: BBa_F2620
Part:BBa_F2620 had been fully characterized with data in partsregistry [http://partsregistry.org/Part:BBa_F2620 BBa_F2620] page. It is a composite biobrick with three individual biobricks: pTetR (R0040), LuxR(C0062) and lux pR. Without AHL, transcriptional level of lux pR is extremal low because of lack of activator, LuxR-AHL dimer. If we add AHL into the system within a very short time, expression of mature GFP is expected to increase significantly. To measure behaviors of the system consisting of BBa_F2620 using our software tool, we construct a system using plasmid pSB3C5 and Part:BBa_F2620 as well as a reporter gene:
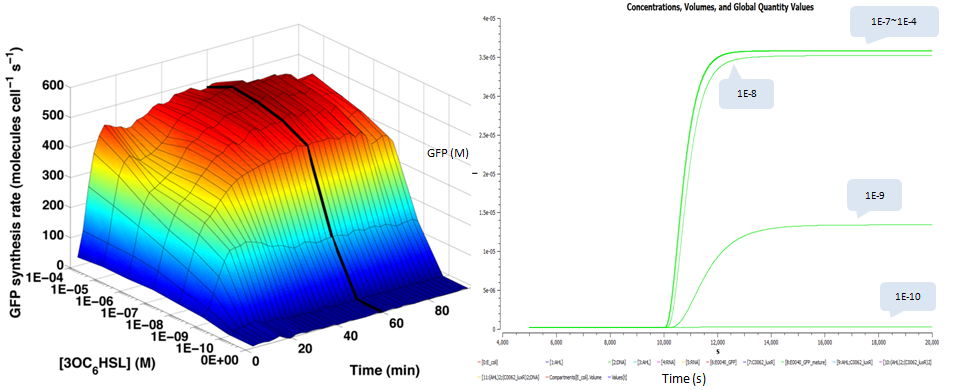
where we use two consecutive terminators to indicate a complete termination. Time course simulation was performed to generate transfer function of stable GFP concentrations versus AHL concentration. It is of high consistence with experiment done by [http://partsregistry.org/Part:BBa_F2620:Transfer_Function Haseloff Lab, MIT]:
where GFP concentration is directly proportional to its synthetic rate. In our simulation, we add AHL of concentration ranging from 1E-10 to 1E-5 M (increasing by order of magnitude) to the reactor within one minute. Details of modeling are described here.
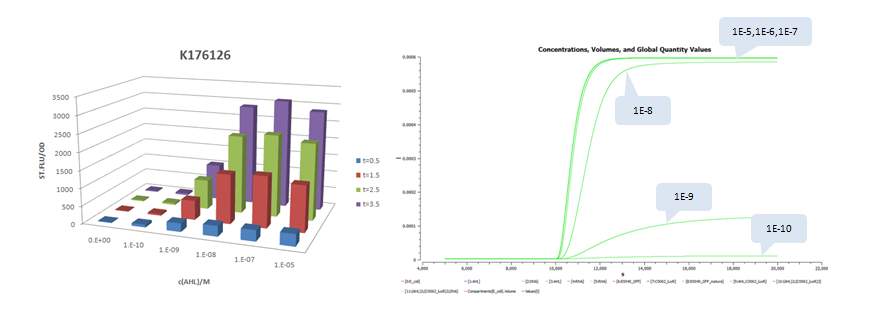
We also plot time and dose response measurements of GFP stable concentration following addition of AHL. We choose the same AHL concentrations as done in testing the transfer function and plot their dynamic curves of GFP:
A similar work to measure system response of luxr-plux to inducer AHL was done by USTC 2009 iGEM team. Besides measurement of dose response of GFP stable concentrations following addition of AHL, they construct four constitutive promoters, [http://partsregistry.org/wiki/index.php/Part:BBa_K176026 BBa_K176026], [http://partsregistry.org/wiki/index.php/Part:BBa_K176126 BBa_K176126], [http://partsregistry.org/wiki/index.php/Part:BBa_K176128 BBa_K176128], [http://partsregistry.org/wiki/index.php/Part:BBa_K176130 BBa_K176130], and quantitatively measured their effects to the response curves. The construction is modified by replacing pTet with the four promoters and pSB3C5 with high copy plasmid pSB1A3 (copy number: 200). Since there are no tetR protein existed in the system, we keep lux pR unchanged (it is equivalent to use pLux/Tet hybrid promoter).
The results is shown for each (we plot GFP concentration versus time and compare it with experiment measument):
- Part:BBa_K176026 (Promoter Strength: 0.55 1/s)
- Part:BBa_K176126 (promoter strength: 0.0192 1/s)
- Part:BBa_K176128 (promoter strength: 0.0016 1/s)
- Part:BBa_K176130 (promoter strength: 6.4E-5 1/s)
Toggle Switch
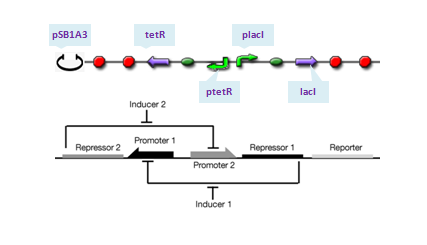
The toggle switch is composed of two repressors and two promoters, each of which is inhibited by the repressor transcribed by the other promoter. We choose pLacI and pTetR as the two promoters, and the repressors are TetR and LacI, respectively. Theoretically, if ratio of LacI to TetR is greater than 1, strong binding of LacI to pLacI repress transcription initiation from pLacI and therefore quantities of TetR will decrease, which in turn relieves its repression to pTet leading to increase of quantities of LacI itself. In this situation, concentration of LacI is far greater than that of tetR, whose expression is repressed at an extream low level and the system enters into its 'LacI' state. Similar analysis will do for TetR and the system will enter into 'TetR' state if its quantity dominates. To show transition between the two states, IPTG is added in 1s after the system enters into 'LacI' state completely. The assembling of parts are construcuted as follows:
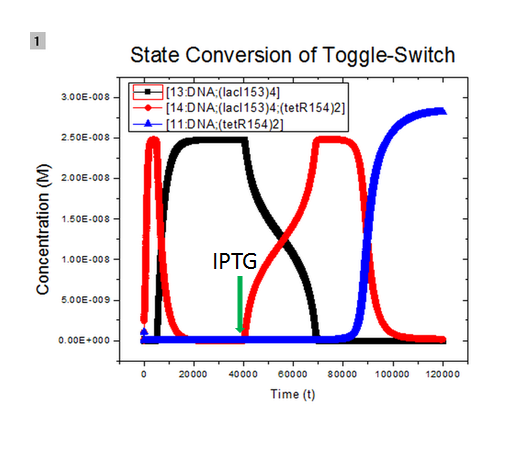
where we use two consecutive terminators to indicate a complete termination. Time course simulation was performed to generate the state transition:
The legend used in the figure is not clear. 13:DNA;(lacI153)4, 11:DNA;(tetR154)2, and 14:DNA;(lacI153)4;(tetR154)2 means binding products of initial plasmid with lacI tetramer at site pLacI gene, with tetR dimer at site pTet gene, and with lacI tetramer and tetR dimer both, respectively. At the beginning, initial plasmids are all bound with lacI tetramer and the system is in its 'LacI' state. After adding inducer IPTG at 40000s, concentration of tetR dimer increases and plasmids bound with lacI tetramer start to bind with tetR dimer and form complex of plasmids, lacI tetramer, and tetR dimer. At about 70000s, all plasmids bound with lacI tetramer are further bound with tetR dimer. At about 85000s, due to repression of expression of lacI, plasmids bound with LacI tetramer and tetR dimer both start to unbind to form plasmids bound with tetR dimer only and the system steps into its 'TetR' state gradually. Details of modeling is available here.
Modeling Details of Toggle Switch
Modeling Details of Toggle Switch
Key points of this modeling are:
- LacI protein tends to form LacI dimer, which tends to form LacI tetramer further.
- Only LacI tetramer binds with pLacI gene and thus repressing expression of its downstream genes.
- TetR protein only forms dimer.
- Only tetR dimer binds with pTet gene and thus repressing expression of its downstream genes.
- One IPTG molecule binds with one LacI tetramer to form complex IPTG:LacI4 and one aTc molecule binds with one tetR dimer to form complex aTc:TetR2.
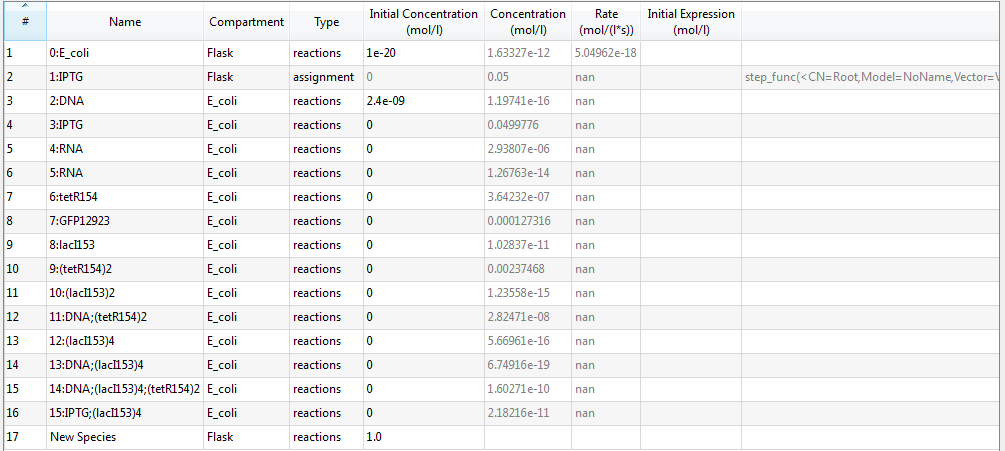
An overview of species list is provided:
where each species with its specific identifier has its own meaning:
- 0:E_coli : E.coli cell;
- 1:IPTG: IPTG in flask;
- 2:DNA: initial transformed plasmids;
- 3:IPTG: IPTG in E.coli due to diffusion;
- 4:RNA: mRNA of tetR and GFP;
- 5:RNA: mRNA of LacI;
- 6:tetR154: tetR protein;
- 7:GFP12923: GFP;
- 8:lacI153: LacI protein;
- 9:(tetR154)2: tetR dimer;
- 10:(lacI153)2: LacI dimer;
- 11:DNA;(tetR154)2: complex of tetR dimer binding to pTet gene of plasmid DNA;
- 12:(lacI153)4: LacI tetramer;
- 13:DNA;(lacI153)4: complex of LacI tetramer binding to pLacI gene of plasmid DNA;
- 14:DNA;(lacI153)4;(tetR154)2: complex of plasmid DNA with both pLacI and pTet genes bound with LacI tetramer and tetR dimer, respectively;
- 15:IPTG;(lacI153)4: complex of IPTG binding with LacI tetramer;
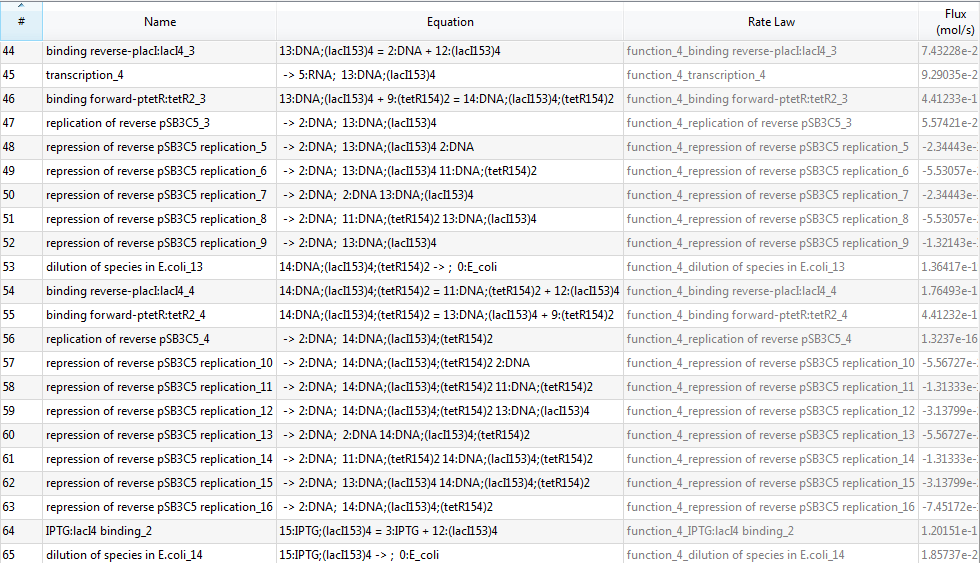
Since there are 65 reactions in total, we only provide a screenshot (we strongly recommend users to run our example to learn more details about automatic modeling):
Moreover, parameters of our modeling network are provided (we spend much efforts on tuning parameters) based on papers and estimates together:
- Initial time: 0 s
- Initial volumes:
- Flask: 0.4 l
- E_coli: 1.6856e-012 l
- Initial concentrations:
- 0:E_coli: 1e-020 mol/l
- 1:IPTG: 0 mol/l
- 2:DNA: 2.4e-009 mol/l
- 3:IPTG: 0 mol/l
- 4:RNA: 0 mol/l
- 5:RNA: 0 mol/l
- 6:tetR154: 0 mol/l
- 7:GFP12923: 0 mol/l
- 8:lacI153: 0 mol/l
- 9:(tetR154)2: 0 mol/l
- 10:(lacI153)2: 0 mol/l
- 11:DNA;(tetR154)2: 0 mol/l
- 12:(lacI153)4: 0 mol/l
- 13:DNA;(lacI153)4: 0 mol/l
- 14:DNA;(lacI153)4;(tetR154)2: 0 mol/l
- 15:IPTG;(lacI153)4: 0 mol/l
- Reaction parameters:
- reproduction of Ecoli cell
- growth constant: 0.000192 1/s
- maximum concentration: 1.66e-012 mol/l
- diffusion of IPTG molecule
- diffusion constant: 0.014 1/s
- transcription
- transcription rate of pTet/pLacI: 0.5 1/s
- replication of reverse pSB3C5
- replication constant: 0.003 1/s
- repression of reverse pSB3C5 replication
- max concentration of pSB3C5: 2.847e-008 mol/l
- translation
- translation rate: 0.1 1/s
- degradation of mRNAs
- degradation of mRNA molecules: 0.0048 1/s
- degradation of proteins in E.coli_3
- degradation rate of proteins: 0.0023 1/s
- Laci-Laci dimerization
- kon: 1.25e+007 l/(mol*s)
- koff: 10 1/s
- binding forward-ptetR:tetR2
- kon: 1e+008 l/(mol*s)
- koff: 0.001 1/s
- tetR-tetR dimerization_2
- kon: 4e+011 1/(mol*s)
- koff: 10 1/s
- LacI2-LacI2 dimerization
- kon: 1e+014 l/(mol*s)
- koff: 10 1/s
- binding reverse-placI:lacI4
- kon: 4e+011 l/(mol*s)
- koff: 0.04 1/s
- IPTG:lacI4 binding
- kon: 154000 l/(mol*s)
- koff: 0.2 1/s
- reproduction of Ecoli cell
Repressilator
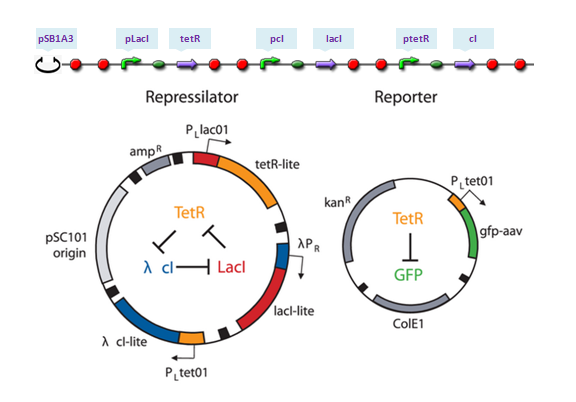
The repressilator is a synthetic genetic regulatory network designed to exhibit a stable oscillation shown via expression of GFP (green fluorescent protein). The work is reported by Michael B. Elowitz and Stanislas Leibler in their [http://www.nature.com/nature/journal/v403/n6767/full/403335a0.html work] at 2000. They constructed a system of three genes connected in a cyclical negative feedback loop so that gene A represses gene B, which represses gene C, which represses gene A. The implementation of this idea used a low copy plasmid encoding the repressilator, and the higher copy reporter, which were used to transform a culture of Escherichia coli.
We construct a model to stimulate the behavior of repressilator, the results are showed as following:
The meanings of the legend used in the figure are demonstrated as follows: [14 (lacI153)4] refers to the binding product of four lacI protein molecules, [12 (CIlam154)2] refers to the binding product of two CIlam protein molecules, while [10 (tetR154)2] refers to the binding product of two tetR protein molecules. The system exhibits oscillation behavior after initial time of 86000, the concentration of (lacI)4, (CIlam)2 and (tetR)2 changes periodically as the function of time. To be specific, the concentration of (tetR)2 increase when the concentration of (lacI)4 declines due to the remove of repression. And the concentration reaches the peak level when the concentration of (LacI)4 reaches its lowest level. Then the concentration of (tetR)2 decreases while the concentration of (CIlam)2 begins to arise because the repression from (tetR)2 is gradually relieved. Noted that the concentration peak level of (CIlam)2 and (tetR)2 are nearly more than twice the max concentration of (lacI)4, this may attribute to the difference of binding tendency between (CIlam)2, (tetR)2 and (lacI)4. The internal binding strength of (tetR)2 dimer and (CIlam)2 dimer are stronger than that of (lacI)4 tetramer. more details
Modeling Details of Repressilator
Modeling Details of Repressilator
Key points of this modeling are:
- LacI protein tends to form LacI dimer, which tends to form LacI tetramer further.
- Only LacI tetramer binds with pLacI gene and thus repressing expression of its downstream genes.
- TetR protein only forms dimer.
- Only tetR dimer binds with pTet gene and thus repressing expression of its downstream genes.
- One IPTG molecule binds with one LacI tetramer to form complex IPTG:LacI4.
- cIlam protein only forms dimer.
- Only cIlam dimer binds with pcIlam gene and thus repressing expression of its downstream genes.
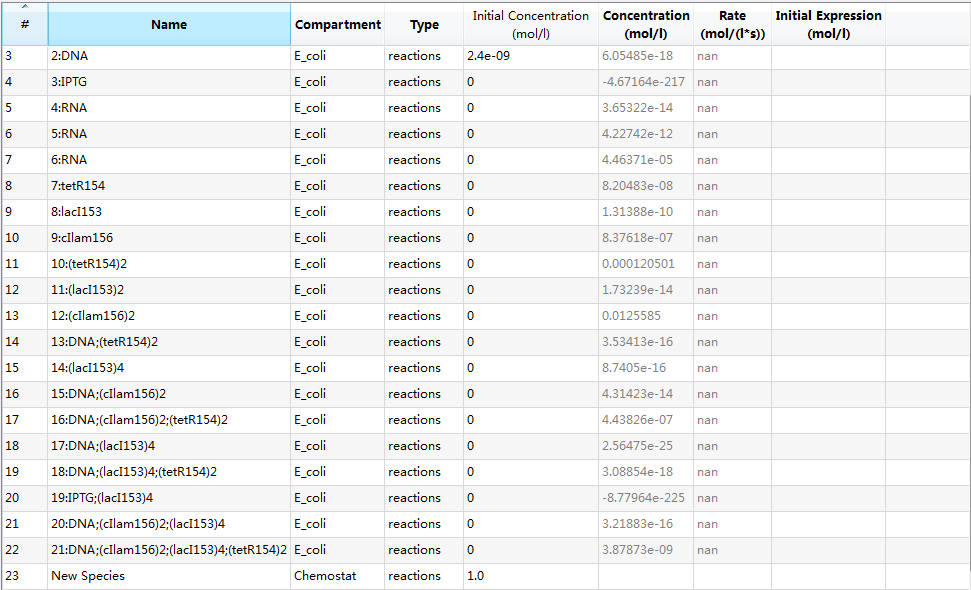
An overview of species list is provided:
where each species with its specific identifier has its own meaning:
- 0:E_coli: E.Coli cell;
- 1:IPTG: IPTG in flask;
- 2:DNA: initial transformed plasmids;
- 3:IPTG: IPTG in E.Coli due to diffusion;
- 4:RNA: mRNA of tetR;
- 5:RNA: mRNA of lacI;
- 6:RNA: mRNA of cIlam;
- 7:tetR154: tetR protein;
- 8:lacI153: lacI protein;
- 9:cIlam156: lacI protein;
- 10:(tetR154)2: tetR dimer;
- 11:(lacI153)2: lacI dimer;
- 12:(cIlam156)2: cIlam dimer;
- 13:DNA;(tetR154)2: complex of tetR dimer binding to pTet gene of plasmid DNA;
- 14:(lacI153)4; lacI tetramer;
- 15:DNA;(cIlam156)2: complex of cIlam dimer binding to pCI gene of plasmid DNA;
- 16:DNA;(cIlam156)2;(tetR154)2: complex of plasmid of DNA with both pCI and pTet genes bound with cIlam dimer and tetR dimer;
- 17:DNA;(lacI153)4: complex of LacI tetramer binding to pLacI gene plasmid DNA;
- 18:DNA;(lacI153)4;(tetR154)2: complex of plasmid DNA with both pLacI and pTet genes bound with LacI tetramer and tetR dimer, respectively;
- 19:IPTG;(lacI153)4: complex of LacI tetramer binding to pLacI gene of plasmid DNA;
- 20:DNA;(cIlam156)2;(lacI153)4: complex of plasmid DNA with both pCI and placI genes bound with cIlam dimer and lacI tetramer, respectively;
- 21:DNA;(cIlam156)2;(lacI153)4;(tetR154)2: complex of plasmid DNA with both pCI, placI and pTet genes bound with cIlam dimer, lacI tetramer and tetR dimer, respectively;
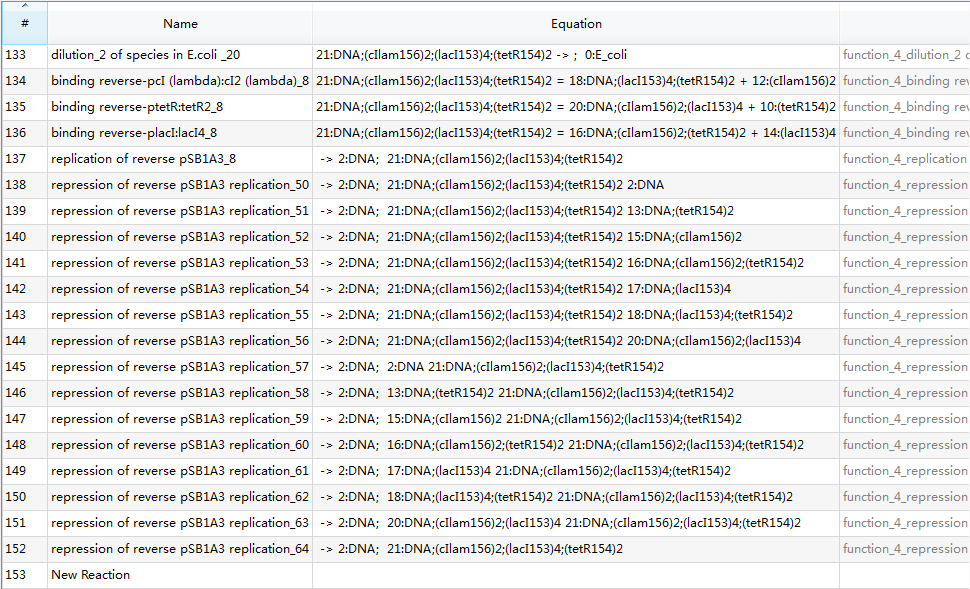
Since there are 153 reactions in total, we only provide a screenshot (we strongly recommend users to run our example to learn more details about automatic modeling):
Moreover, parameters of our modeling network are provided below:
- Initial time: 0 s
- Initial volumes:
- Chemostat 0.1 l
- E_coli 4.4247e-006 l
- Initial concentrations:
- 0:E_coli 1.05e-013 mol/l
- 1:IPTG 0.001 mol/l
- 2:DNA 2.4e-009 mol/l
- 3:IPTG 0 mol/l
- 4:RNA 0 mol/l
- 5:RNA 0 mol/l
- 6:RNA 0 mol/l
- 7:tetR154 0 mol/l
- 8:lacI153 0 mol/l
- 9:cIlam156 0 mol/l
- 10:(tetR154)2 0 mol/l
- 11:(lacI153)2 0 mol/l
- 12:(cIlam156)2 0 mol/l
- 13:DNA;(tetR154)2 0 mol/l
- 14:(lacI153)4 0 mol/l
- 15:DNA;(cIlam156)2 0 mol/l
- 16:DNA;(cIlam156)2;(tetR154)2 0 mol/l
- 17:DNA;(lacI153)4 0 mol/l
- 18:DNA;(lacI153)4;(tetR154)2 0 mol/l
- 19:IPTG;(lacI153)4 0 mol/l
- 20:DNA;(cIlam156)2;(lacI153)4 0 mol/l
- 21:DNA;(cIlam156)2;(lacI153)4;(tetR154)2 0 mol/l
- Initial values of global quantities:
- ts 0
- te 40000
- s 0.001
- t 0
- Reaction parameters:
- reproduction of Ecoli cell
- kgr 0.000192 1/s
- maxc 1.66e-012 mol/l
- dilution of species in chemostat
- k1 0.00017 1/s
- diffusion of IPTG molecule
- k_diff 0.014 ?
- dilution_2 of species in E.coli
- kgr 0.000192 1/s
- maxc 1.66e-012 mol/l
- transcription
- k_tc 0.5 1/s
- replication of reverse pSB1A3
- kgr 0.003 1/s
- repression of reverse pSB1A3 replication
- kgr -0.003 ?
- maxc 4.746e-007 ?
- translation
- k_tl 0.1 1/s
- degradation of mRNAs
- k1 0.0048 1/s
- tetR-tetR dimerization
- kon 1.79e+011 l/(mol*s)
- degradation of proteins in E.coli
- k1 0.0023 1/s
- Laci-Laci dimerization
- kon 1.25e+007 l/(mol*s)
- cI (lambda)-cI (lambda) dimerization
- kon 1.79e+011 l/(mol*s)
- binding reverse-ptetR:tetR2
- kon 1e+008 l/(mol*s)
- LacI2-LacI2 dimerization
- kon 1e+014 l/(mol*s)
- binding reverse-pcI (lambda):cI2 (lambda)
- kon 1e+009 l/(mol*s)
- binding reverse-placI:lacI4
- kon 4e+011 l/(mol*s)
- IPTG:lacI4 binding
- kon 154000 l/(mol*s)
 "
"


