Team:Newcastle/28 July 2010
From 2010.igem.org

| |||||||||||||
| |||||||||||||
Contents |
PCR Experiment
Aims
The aim of this experiment is to prove that Bacillus subtilis 168 and 3610 chromosomal DNA extraction worked by amplifying anaR gene using PCR.
Materials and Protocol
Please refer to: PCR for GoTaq PCR.
Result
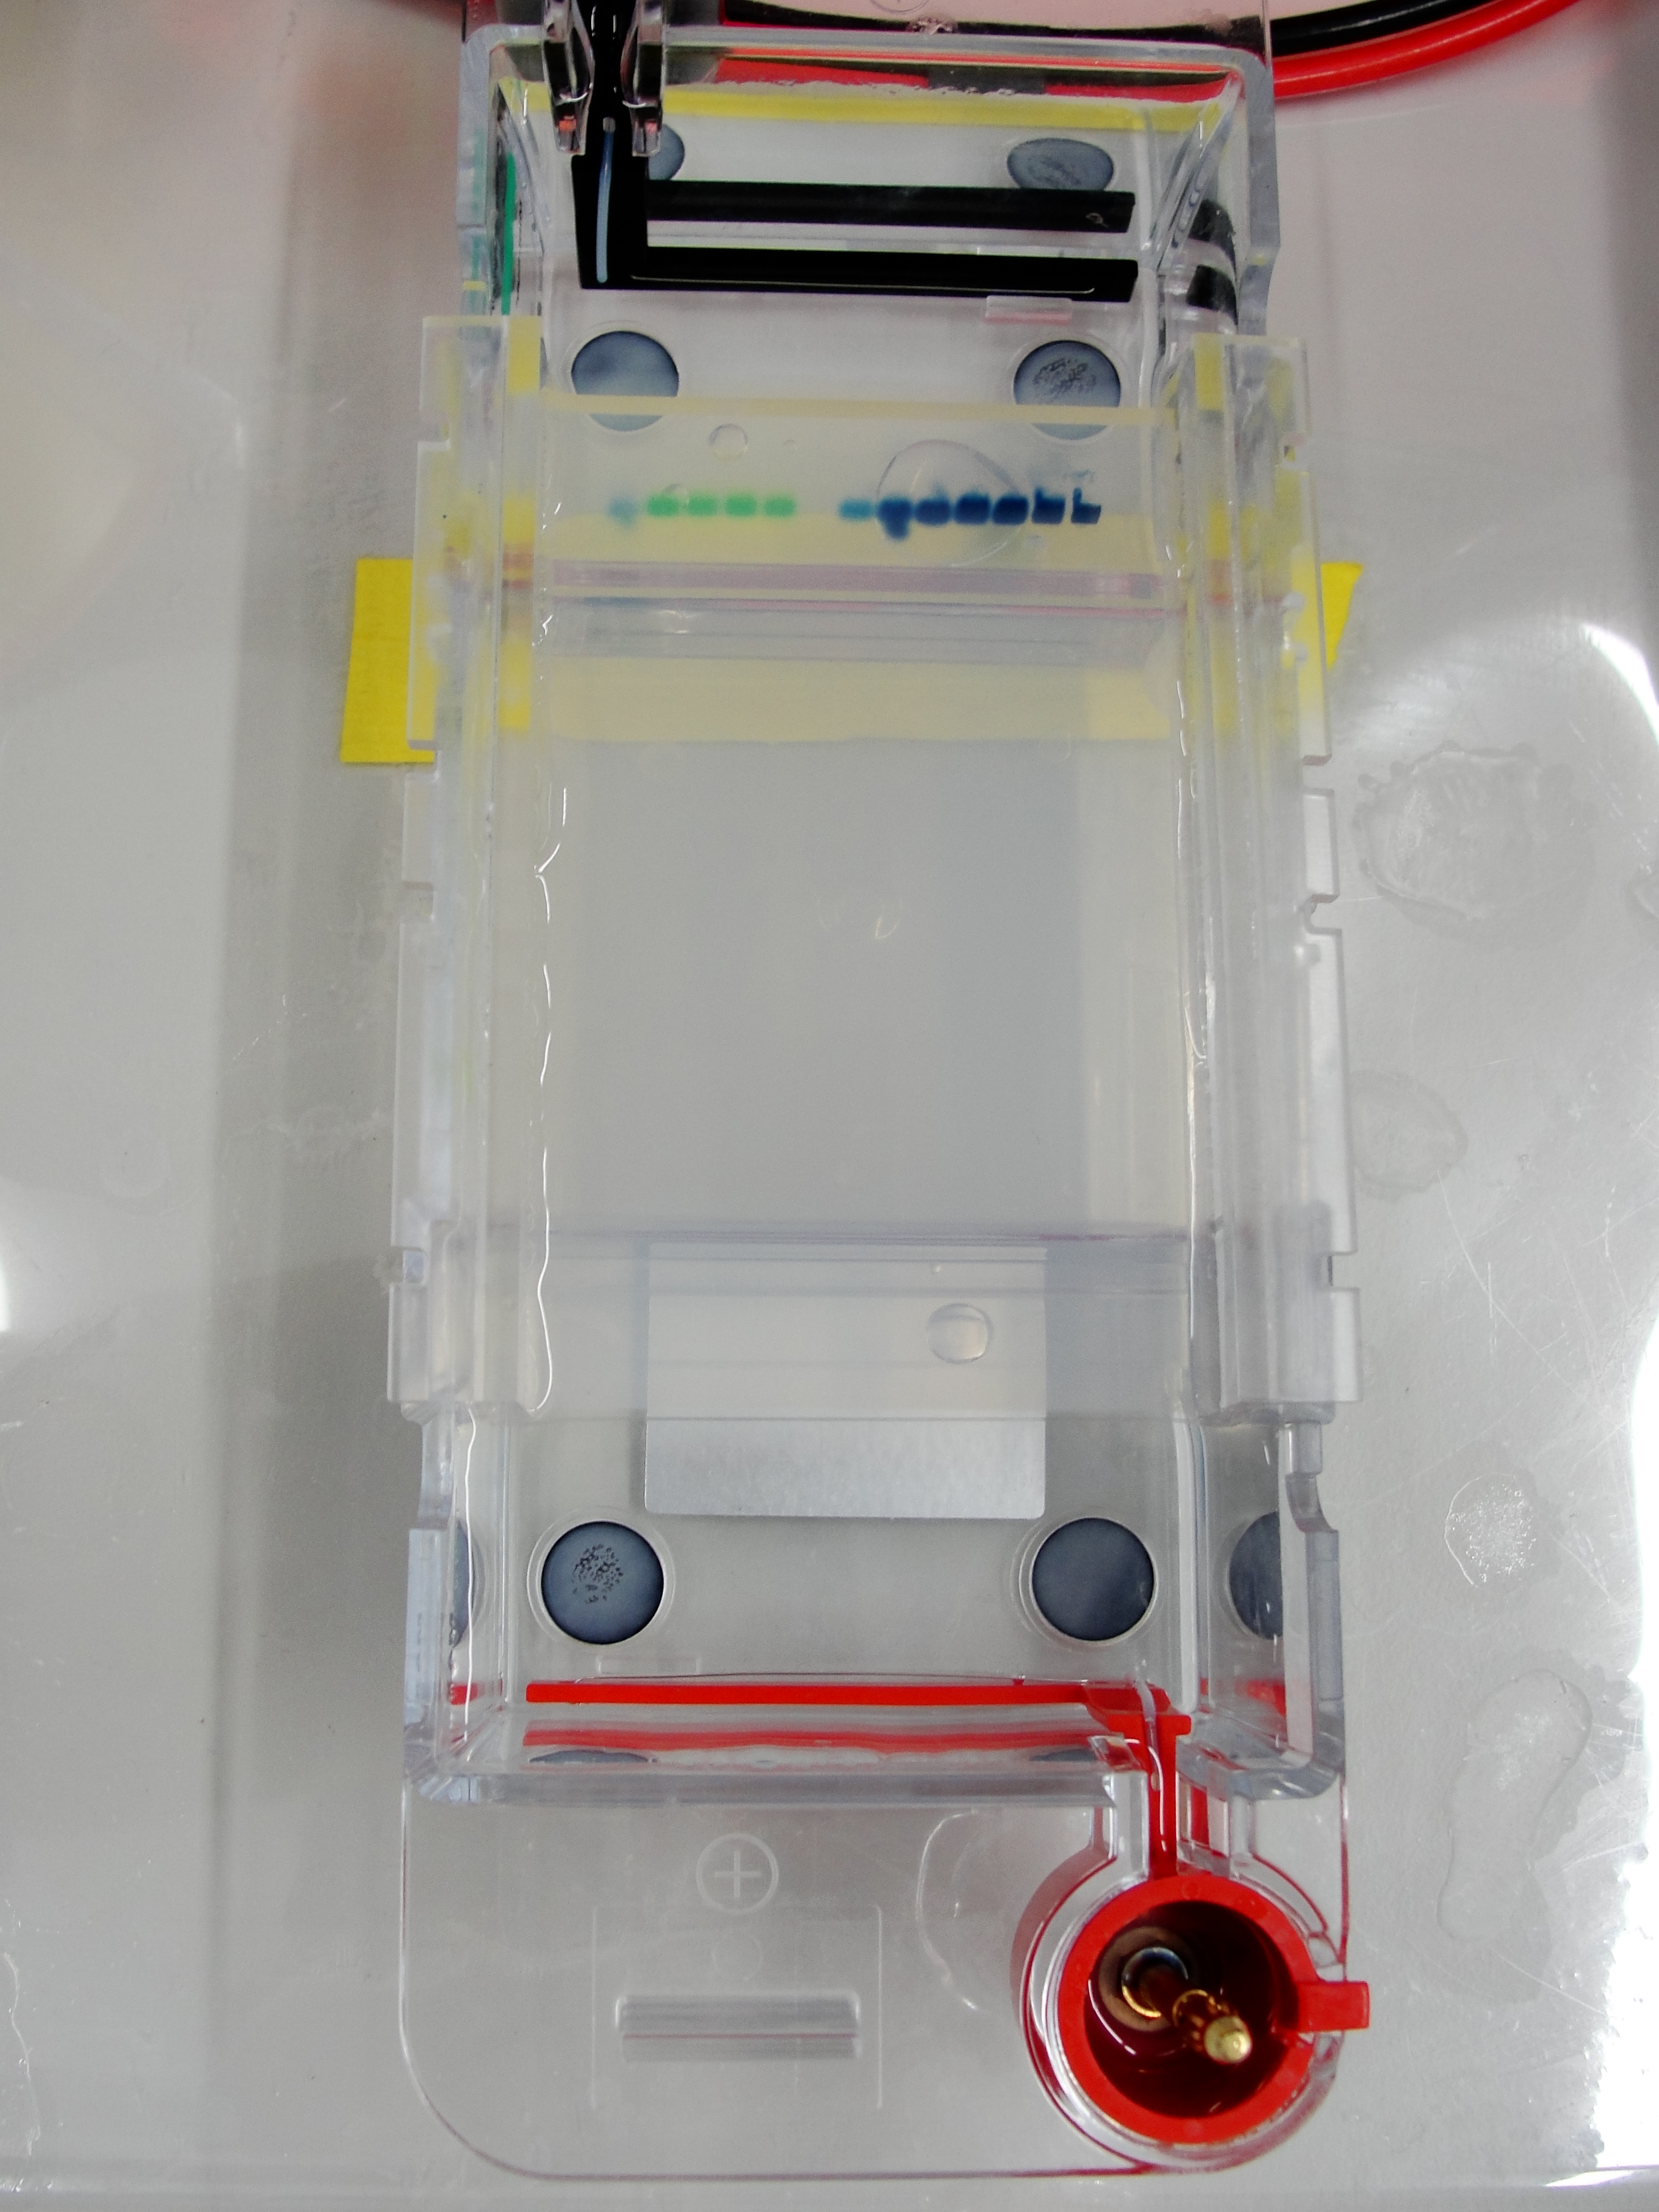
- Lane 1: 1kb DNA ladder
- Lane 2: B. subtilis 168 chromosomal DNA containing anaR gene
- Lane 3: B. subtilis 168 chromosomal DNA containing anaR gene
- Lane 4: B. subtilis 3610 chromosomal DNA containing anaR gene
- Lane 5: B. subtilis 3610 chromosomal DNA containing anaR gene
Discussion
We found bands in the lane 2, 3, 4 and 5 of around 200 bp size which is an approximate size of the anaR gene which is found on the chromosome of both B. subtilis 168 and 3610.
Conclusion
This experiment proves that the DNA extraction from both B. subtilis 168 and 3610 done on 27th July, 2010 was successful.
Plasmid Miniprep Experiment
Aims
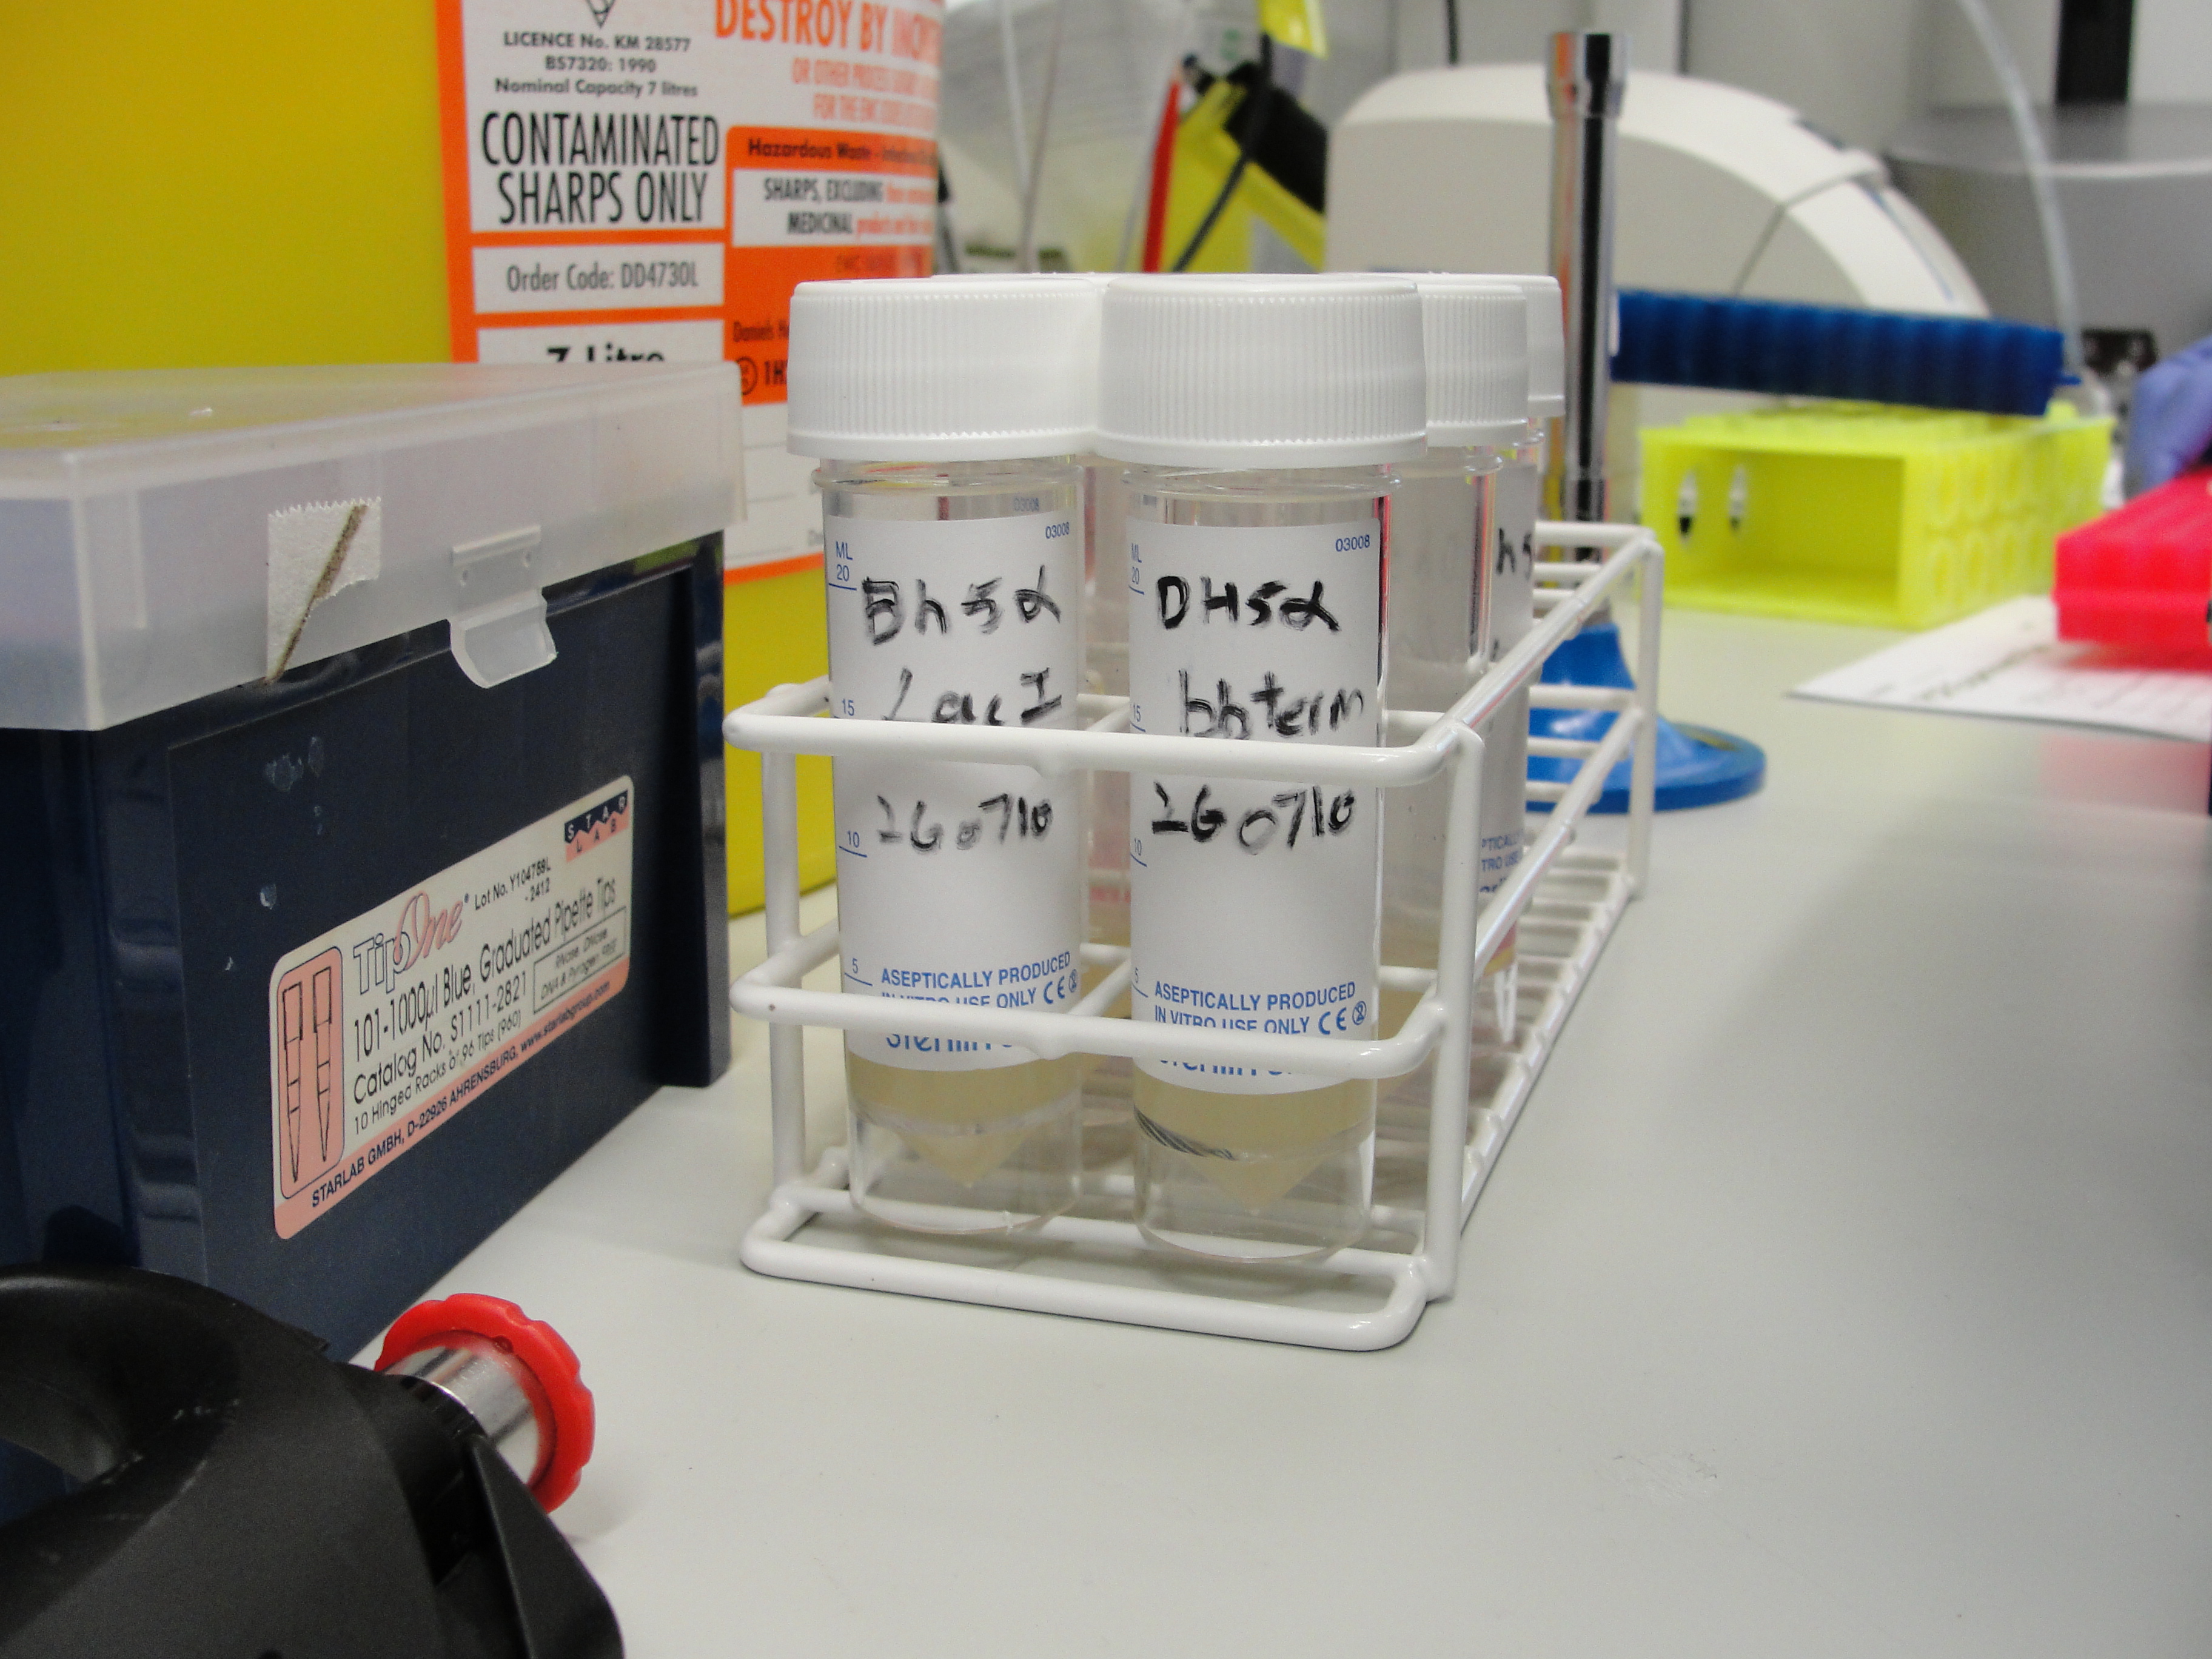
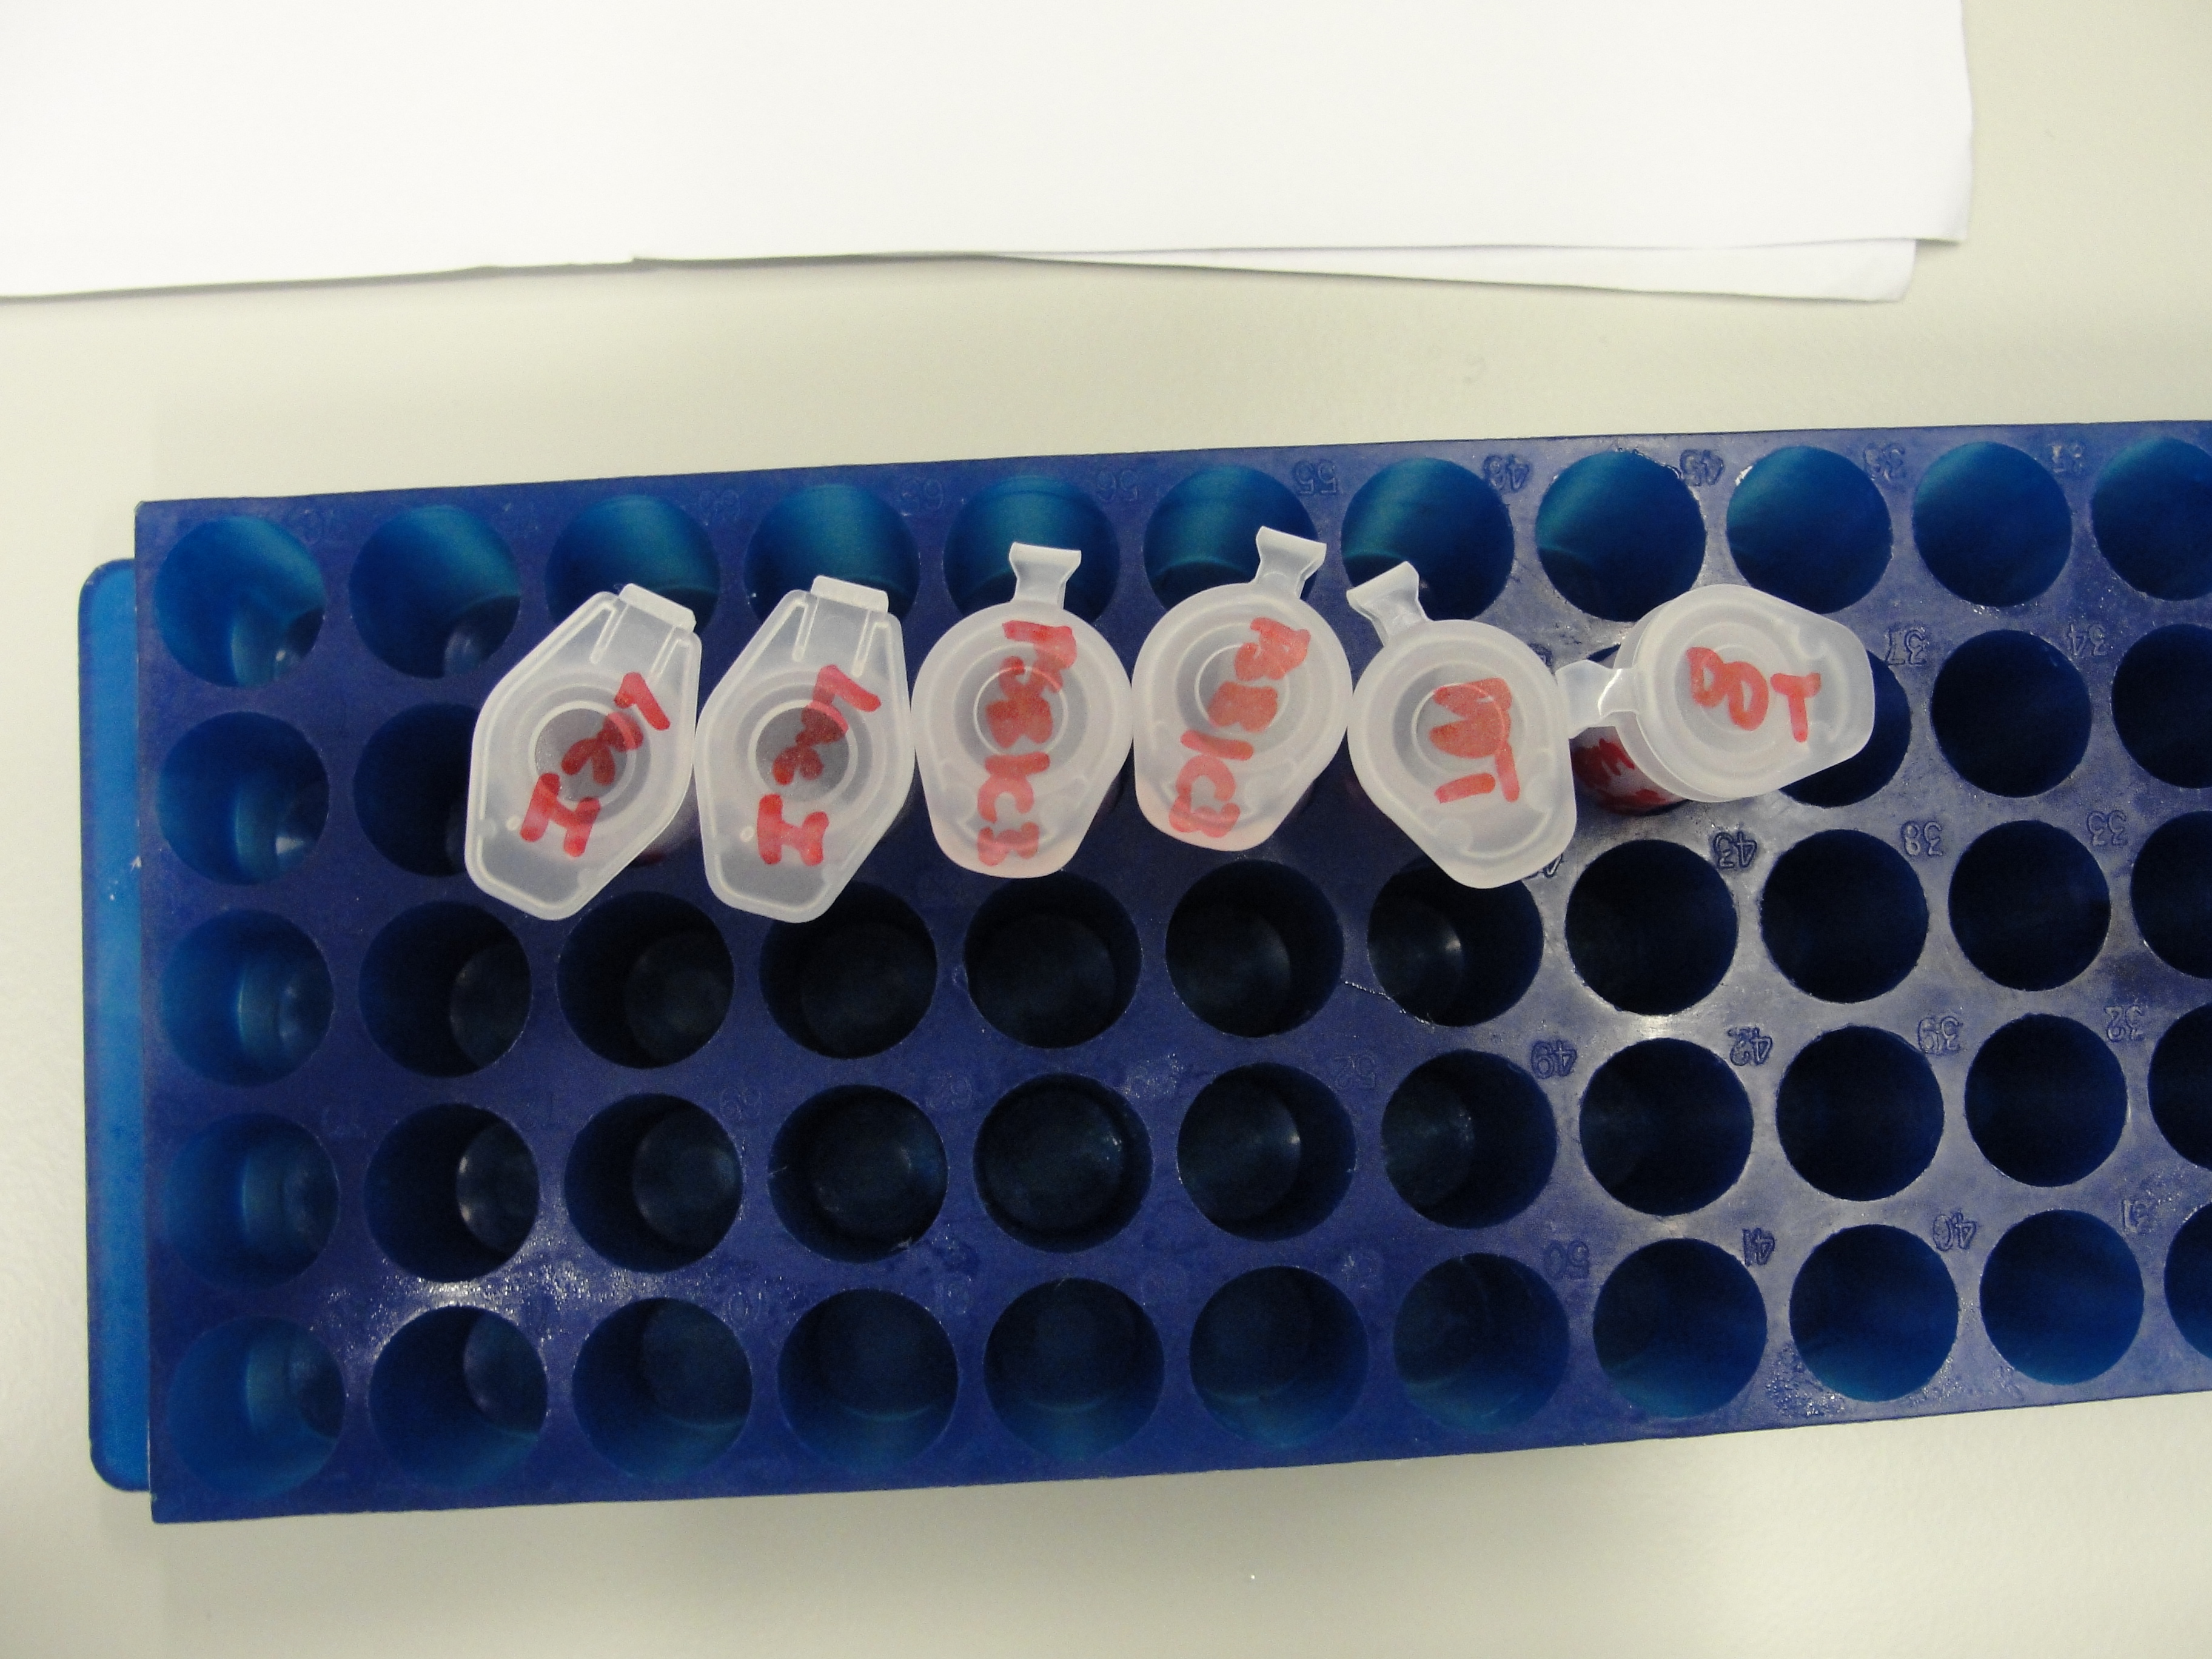
The aim of this experiment is to extract plasmid DNA pSB1C3, pSB1AK3 and plasmid containing lacI Biobrick from E. coli DH5α cells with the help of Qiagen miniprep kit and confirming the extraction with the help of nanodrop experiment.
Materials and Protocol
Please refer to: Minipreps for Qiagen miniprep protocol and Nanodrop Spectrophotometer for nanodrop protocol.
Result
- Lane 1: 1kb DNA ladder
- Lane 2: Extraction of pSB1C3 plasmid
- Lane 3: Extraction of pSB1C3 plasmid
- Lane 4: Extraction of plasmid containing lacI
- Lane 5: Extraction of plasmid containing lacI
- Lane 6: Extraction of pSB1AK3 plasmid containing double terminator
- Lane 7: Extraction of pSB1AK3 plasmid containing double terminator
| Lane 1 | Lane 2 | Lane 3 | Lane 4 | Lane 5 | Lane 6 | Lane 7 |
|---|---|---|---|---|---|---|
| N/A | 29.9 µl/ml | 28.9 µl/ml | 34.0 µl/ml | 29.8 µl/ml | 6.1 µl/ml | 6.7 µl/ml |
Table 1: Nanodrop spectrophotometer experiment result. Table represents the amount of plasmid present in µl/ml quantity.
Discussion
We found bands in the lane 2, 3, 4, 5 and 6 showing the presence of plasmid in E. coli DH5α cells. The ideal concentration of DNA calculated using nanodrop experiment is 150 µg/ml but in the table 1, where all the values have been less than 150 µg/ml which shows that even though there is plasmid present in the cells but it is present in very low amount. One possible explanation for this to happen could be that when the transformed E. coli DH5α cells were grown overnight for the plasmid extraction protocol, the medium in which they were grown did not contain any antibiotics and because of this the cells did not require plasmid which conferred bacteria with antibiotic resistance and this process is called as plasmid shuffle.
Conclusion
This experiment shows that there is plasmid present in the E. coli DH5α cells but they are present in a very low amount possibly due to plasmid shuffle which could have occurred during overnight growth in the cultures which did not contain antibiotics against which plasmid provides resistance to the cell.
 
|
 "
"
