Team:Imperial College London/Modelling/Signalling/Results and Conclusion
From 2010.igem.org
(Difference between revisions)
m |
m |
||
| Line 22: | Line 22: | ||
|- | |- | ||
| - | |'''Equation 1:'''AIP + ComD <html>↔</html> AIP-ComD | + | |'''Equation 1:''' AIP + ComD <html>↔</html> AIP-ComD |
|- | |- | ||
|<div ALIGN=CENTER> | |<div ALIGN=CENTER> | ||
{| style="background:#e7e7e7;text-align:center;font-family: helvetica, arial, sans-serif;color:#555555;margin- top:5px;padding: 2px;" cellspacing="5"; | {| style="background:#e7e7e7;text-align:center;font-family: helvetica, arial, sans-serif;color:#555555;margin- top:5px;padding: 2px;" cellspacing="5"; | ||
|- | |- | ||
| - | |[[Image:IC_Signalling_Results2.png| | + | |[[Image:IC_Signalling_Results2.png|300px]] |
|- | |- | ||
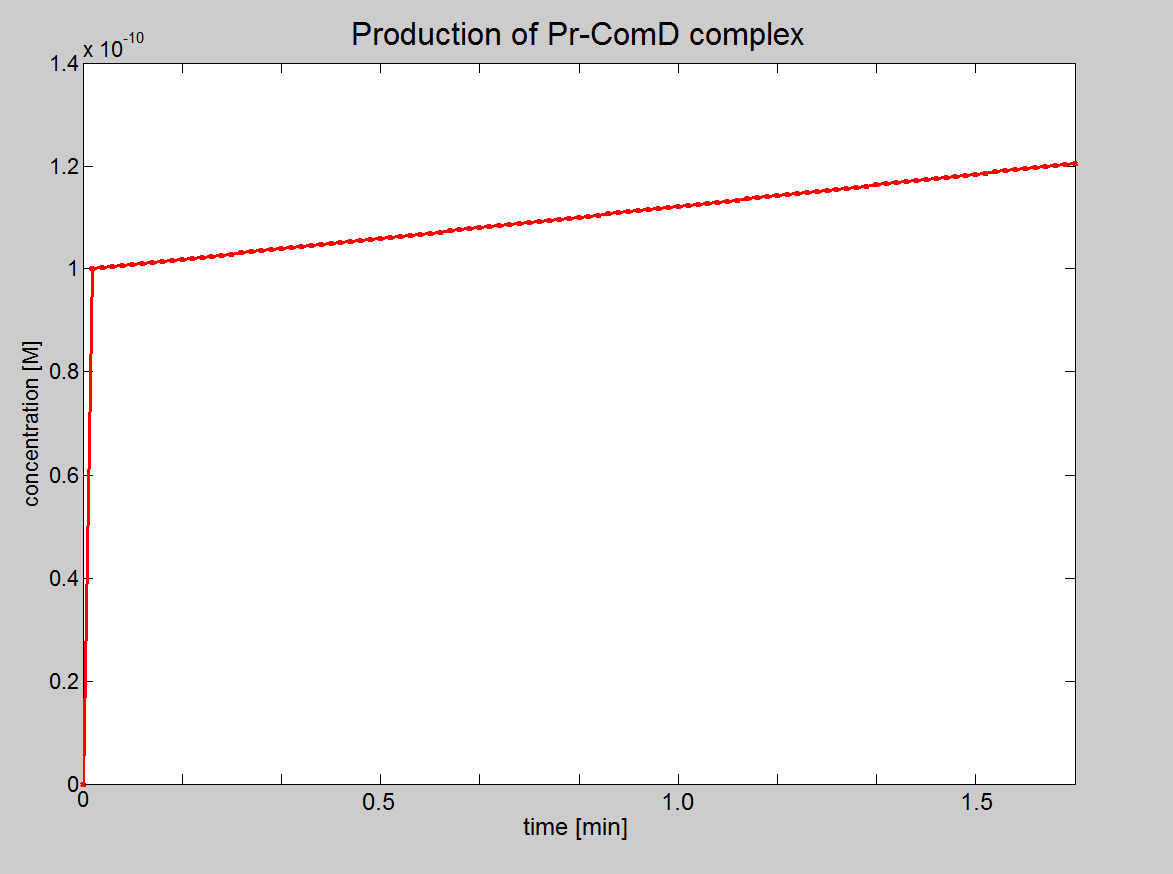
|Graph showing the production of Pr-ComD complex. | |Graph showing the production of Pr-ComD complex. | ||
| Line 38: | Line 38: | ||
{| style="background:#e7e7e7;text-align:center;font-family: helvetica, arial, sans-serif;color:#555555;margin- top:5px;padding: 2px;" cellspacing="5"; | {| style="background:#e7e7e7;text-align:center;font-family: helvetica, arial, sans-serif;color:#555555;margin- top:5px;padding: 2px;" cellspacing="5"; | ||
|- | |- | ||
| - | |[[Image:IC_Signalling_Results3.png| | + | |[[Image:IC_Signalling_Results3.png|300px]] |
|- | |- | ||
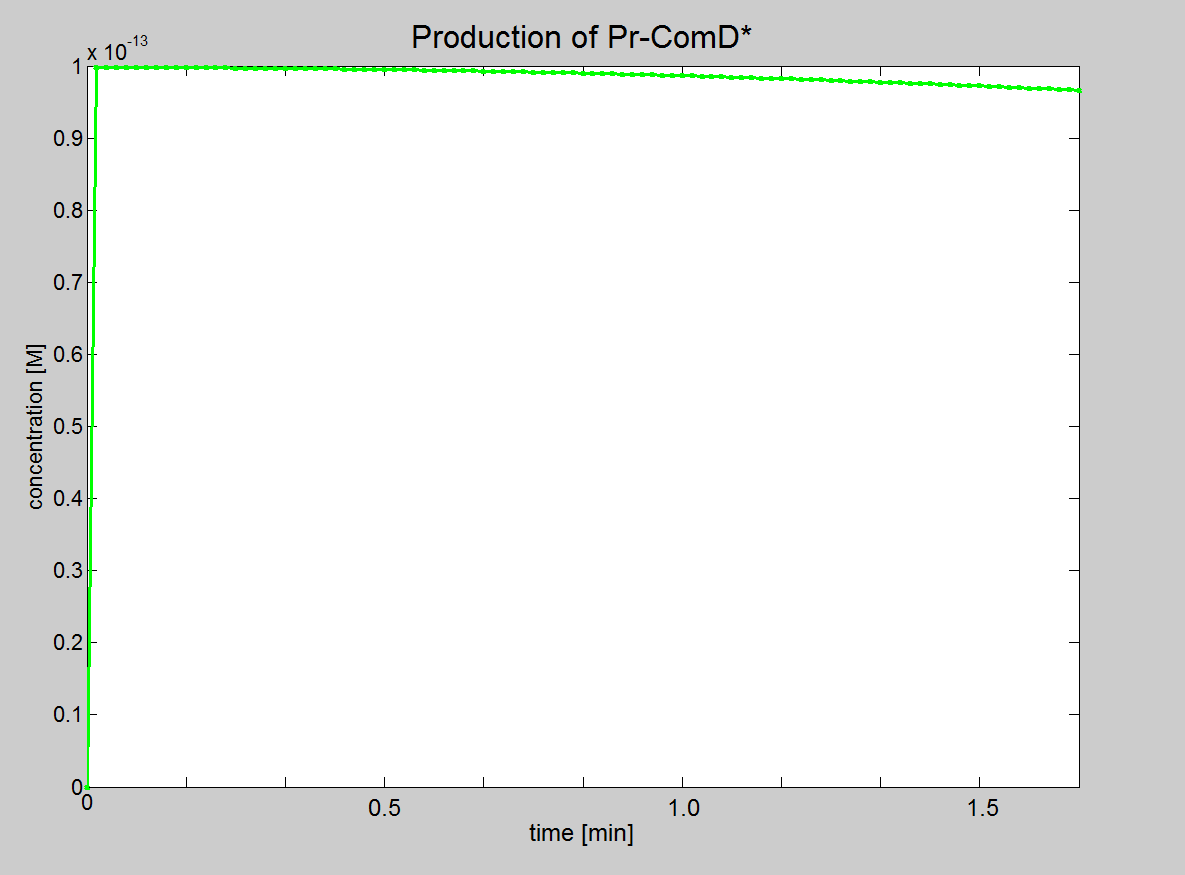
|Graph showing the production of phosphorylated Pr-ComD* complex. | |Graph showing the production of phosphorylated Pr-ComD* complex. | ||
| Line 49: | Line 49: | ||
{| style="background:#e7e7e7;text-align:center;font-family: helvetica, arial, sans-serif;color:#555555;margin- top:5px;padding: 2px;" cellspacing="5"; | {| style="background:#e7e7e7;text-align:center;font-family: helvetica, arial, sans-serif;color:#555555;margin- top:5px;padding: 2px;" cellspacing="5"; | ||
|- | |- | ||
| - | |[[Image:IC_Signalling_Results4.png| | + | |[[Image:IC_Signalling_Results4.png|285px]] |
|- | |- | ||
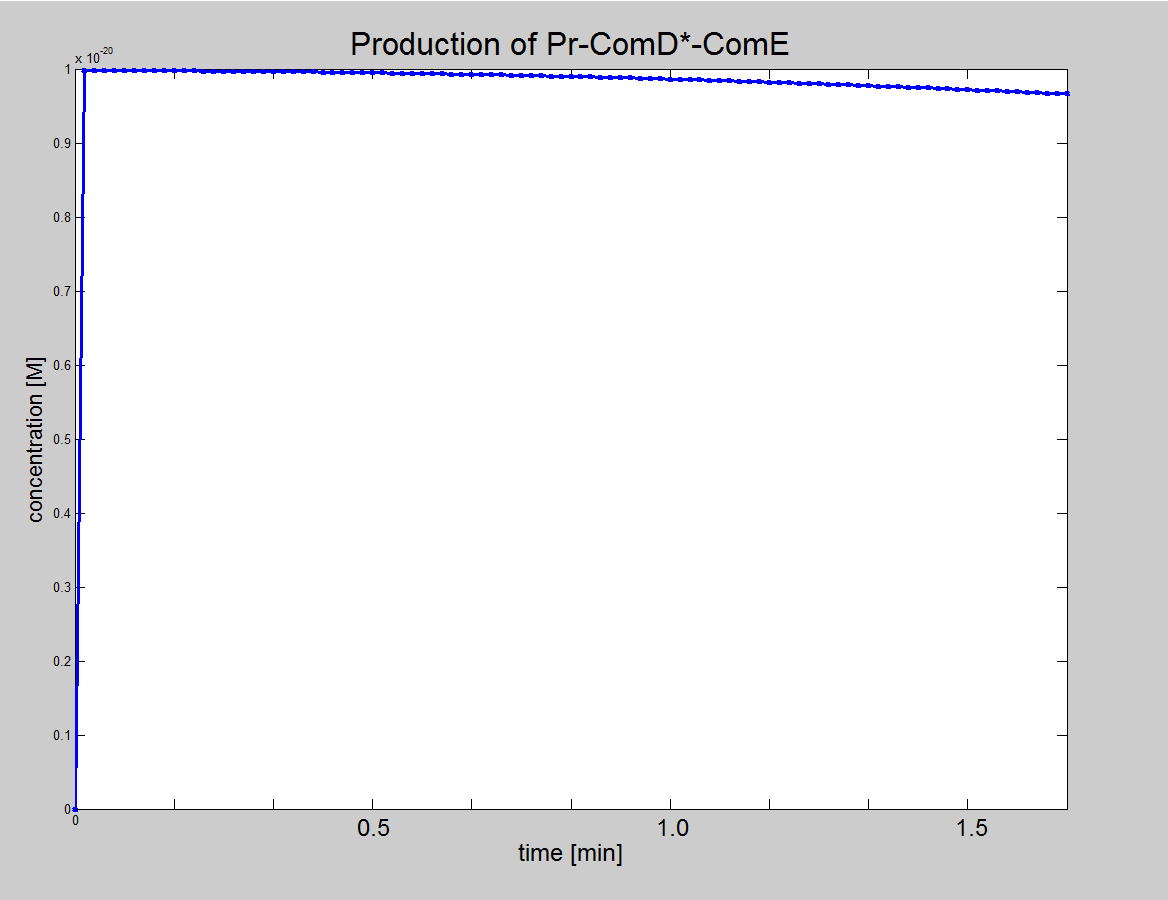
|Graph showing the production of Pr-ComD*-ComE complex. | |Graph showing the production of Pr-ComD*-ComE complex. | ||
Revision as of 15:18, 27 October 2010
| Modelling | Overview | Detection Model | Signaling Model | Fast Response Model | Interactions |
| A major part of the project consisted of modelling each module. This enabled us to decide which ideas we should implement. Look at the Fast Response page for a great example of how modelling has made a major impact on our design! | |
| Objectives | Description | Results | Constants | MATLAB Code |
| Results and Conclusion |
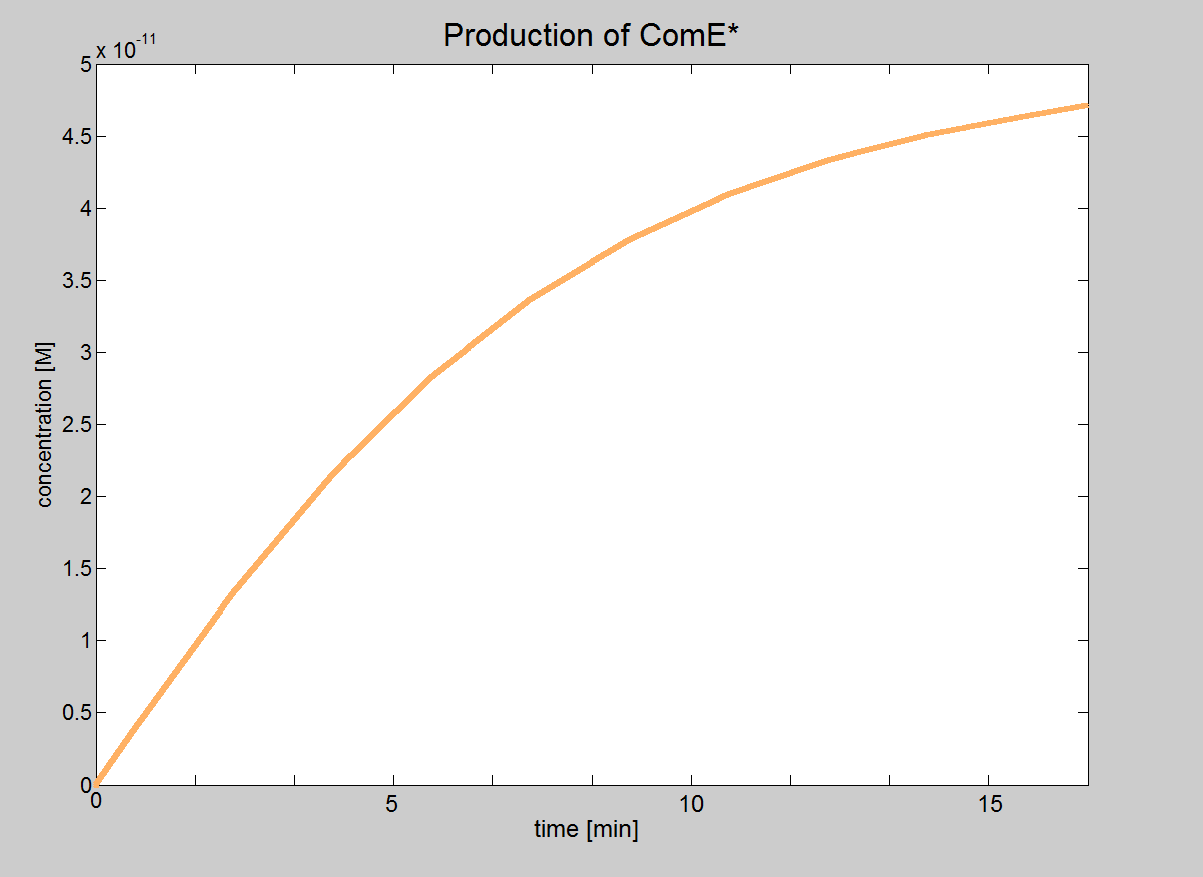
| Using this model, we can show that the phosphorylated ComE* is proportional to both initial concentration of AIP and ComD.
If the initial concentration of AIP or ComD is zero, there is no formation of ComE*. We are assuming an initial concentration of Phosphate and ComE of 100nM. If we change either [AIP]0 or [ComE]0, then the final concentration of ComE* will always tend towards 5×10-11M. [ComE*]final will always tend towards this value, unless the initial concentrations of Phosphate and ComE are changed. However, if we increase both [AIP]0 and [ComE]0 at the same time, then [ComE*]final will be reached much faster (i.e. slope increases). |
| Final Equation: AIP-ComD*-ComE ↔ AIP-ComD + ComE* |
| Equation 1: AIP + ComD ↔ AIP-ComD |
| Equation 2: AIP-ComD + Phosphate ↔ AIP-ComD* |
| Equation 3: AIP-ComD* + ComE ↔ AIP-ComD*-ComE |
 "
"


