Team:Peking/Project/Application/KitOperation
From 2010.igem.org
Evamonlight (Talk | contribs) |
|||
| (14 intermediate revisions not shown) | |||
| Line 19: | Line 19: | ||
<html> | <html> | ||
<img src="https://static.igem.org/mediawiki/2010/9/91/PKU_Adobe_Reader_Logo.jpg" width=20> | <img src="https://static.igem.org/mediawiki/2010/9/91/PKU_Adobe_Reader_Logo.jpg" width=20> | ||
| - | <a href="" target="blank"> download PDF version</a> | + | <a href="https://static.igem.org/mediawiki/2010/1/1c/Kit_Operation_PKU.pdf" target="blank"> download PDF version</a> |
</html> | </html> | ||
| Line 29: | Line 29: | ||
'''Fig 1. Structure of Tri-node response system. According to the results of modeling, we designed the specific genetic circuit to realize the linear response function. Node A is a generator of MerR. For Node B, the gene is the activator which can activate the psid promoter. Node C is GFP whose expression was driven by Psid (activated by activator) and PmerT (activated by MerR). ''' | '''Fig 1. Structure of Tri-node response system. According to the results of modeling, we designed the specific genetic circuit to realize the linear response function. Node A is a generator of MerR. For Node B, the gene is the activator which can activate the psid promoter. Node C is GFP whose expression was driven by Psid (activated by activator) and PmerT (activated by MerR). ''' | ||
| - | |||
| - | |||
[[Image:Figure12PKU.png|center|650px]] | [[Image:Figure12PKU.png|center|650px]] | ||
| Line 36: | Line 34: | ||
'''Fig 2. Our bioreporter with tri-node response system will possess a linear transfer function (right) rather than the natural hill function (left). ''' | '''Fig 2. Our bioreporter with tri-node response system will possess a linear transfer function (right) rather than the natural hill function (left). ''' | ||
| - | Before wiki freezing, data collecting of the final result (linear transfer function transformed from hill function) | + | Before wiki freezing, data collecting of the final result (linear transfer function transformed from hill function) were still under progressing. Primary result demonstrated that it worked as expected, which will be show at Jamboree. |
| - | + | ||
| + | If the transfer function of bioreporter response represents linear , the working range of the bioreporter will be expanded, and the error rating will be reduced. This type of bioreporter will be excellent for in lab accurate measurement or heavy metal pollution assessment. | ||
To determine the pollution level in field, we developed an assay easy to understand and accessible to the general public, called traffic light bioassay. By using bacteria strains with different sensitivity threshold to mercury, the heavy metal concentration can be easily determined by the number of reporter strains reacting to a sample, which is representative to different heavy metal concentration range (Fig.3). | To determine the pollution level in field, we developed an assay easy to understand and accessible to the general public, called traffic light bioassay. By using bacteria strains with different sensitivity threshold to mercury, the heavy metal concentration can be easily determined by the number of reporter strains reacting to a sample, which is representative to different heavy metal concentration range (Fig.3). | ||
| - | [[Image:Figure13PKU.png|center]] | + | [[Image:Figure13PKU.png|center|400px]] |
'''Fig 3. The schematic sketch of how the biosensor functions.''' | '''Fig 3. The schematic sketch of how the biosensor functions.''' | ||
| - | '''Fig 4. The primary result of traffic light bioassay, which was performed in the 96-well plate. The response of whole-cell bioreporter incubated with simulated mercury containing polluted water was recorded by digital image at 10h, 15h, 20h and 30h. 3 replicates of 1 biosensor strain behaved very similarly with respect | + | [[Image:Figure19PKU.png|center|650px]] |
| + | |||
| + | '''Fig 4. The primary result of traffic light bioassay, which was performed in the 96-well plate. The response of whole-cell bioreporter incubated with simulated mercury containing polluted water was recorded by digital image at 10h, 15h, 20h and 30h. 3 replicates of 1 biosensor strain behaved very similarly with respect to indicating the mercury concentration range in a wide time window. Surprisingly, the biosensor strain we selected was able to response to 7*10^-9M mercury (II) with repeatability and the color contrast of mercury concentration near the threshold seemed to be good. ''' | ||
| + | |||
| + | After the heavy metal concentration determined, it’s time for our bioabsorbent to decontaminate the heavy metal ions from water. Firstly, bacteria switch on MBP generating device and facilitation module to get ready-to-use (Fig 5A). Then bioabsorbent will be applied to the contaminated water, to absorb heavy metal ions, for instance, mercury (II) with high performance (Fig 5B). At the same time, a genetic cascade will amplify the input (presence of mercury) and Ag43 will be expressed finally with a time delay and high intensity. When the bacteria sedimentate, post treatment will be ready to be conducted (Fig 5C). | ||
| + | |||
| + | [[Image:Figure10PKU.png|center|550px]] | ||
| + | [[Image:Figure20PKU.png|center|520px]] | ||
| + | [[Image:Figure21PKU.png|center|550px]] | ||
| + | |||
| + | '''Fig. 5 The schematic of how our bioabsorbent functions. A: bioabsorbent gets ready-to-use; B: bioabsorbent absorbs heavy metal ions from water; C: bioabsorbent autoagretate at a population level.''' | ||
| + | |||
| + | To better demonstrate the function and performance of our bioreporter, we used the characterized indicator for direct visualization of mercury detoxification and bacterial aggregation process, using method described at MBP Expression Page of our wiki. | ||
| + | |||
| + | [[Image:Figure22PKU.png|center|550px]] | ||
| - | + | '''Fig. 6 Direct visualization of mercury detoxification and bacterial aggregation process. Water-soluble metal indicator with colorimetric selectivity for heavy metals was exploited to indicate the mercury concentration in the water. The lower limit of metal concentration for color transition was 0.8×10⁻⁵M. (A) The indicator represented rosy color, indicating that high concentration of mercury existed (for more details, see our MBP Expression Page). (B) When applied with our mercury bioabsorbent, after shaking cultured at 37℃ for 10 min, evident color change emerged, indicating that the absorption was under progressing. (C) 30 min later, bacteria aggregated even under slight shaking cultivating at 37℃ in an aslant tube, forming a visible pellet at the bottom. It’s notable that mercury had been decontaminated because the significant color change of the indicator.''' | |
| - | |||
| - | To conclude the above work, we have developed a | + | To conclude the above work, we have developed a extensible method to construct heavy metal decontamination kits consisting of efficient bioreporters and bioabsorbents both for in field application and in lab use. Compared with the technologies we have now, this biological engineering approach gives advantages to its bioavailability assessment, relatively low cost and less resource consumption. More importantly, it clearly points the way of future development. As a revolutionary progress, we believe, the conceptual advancement if of great value when the potential of bio-decontamination is unveiled. At present, it is highly probable that bioremediation is confined in the laboratory study, taking possible defects of mass application and public panic over transgenic products into consideration. However, as long as this promising field is constantly being probed into, we are firmly convinced that, there will be more experts devoted into relevant research, thus optimizing the bio-decontamination method. This is not remote, but imminent; for the biological science and technology is marked by tremendously rapid and ever-accelerating change. Hopefully, we are involved in the exciting improvement and contribute to the rescuing of the environment and human beings ourselves. |
<html> | <html> | ||
Latest revision as of 02:18, 28 October 2010

Here is a general view of how our heavy metal decontamination biokit functions. Our biokit consists of two parts: the bioreporter and the bioabsorbent. We can firstly determine the heavy metal pollution level by the bioreporter, and then clean the contaminated water exploiting the bioabsorbent.
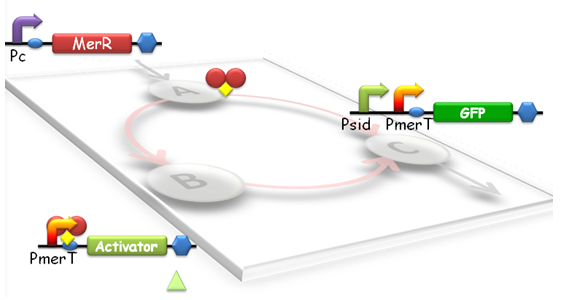
When heavy metal emerges, a tri-node response will be switched on in our biosensor (Fig.1). Different strains with parameter variations between the nodes will have different response threshold to heavy metal ions, such as mercury.
Fig 1. Structure of Tri-node response system. According to the results of modeling, we designed the specific genetic circuit to realize the linear response function. Node A is a generator of MerR. For Node B, the gene is the activator which can activate the psid promoter. Node C is GFP whose expression was driven by Psid (activated by activator) and PmerT (activated by MerR).
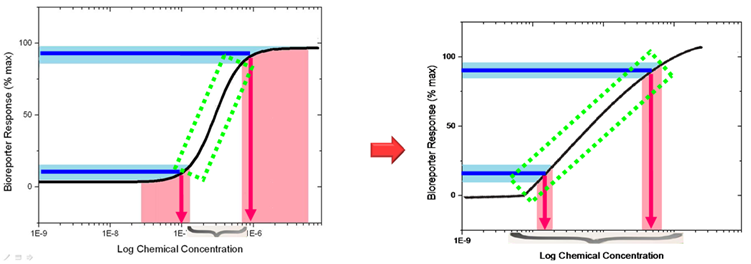
Fig 2. Our bioreporter with tri-node response system will possess a linear transfer function (right) rather than the natural hill function (left).
Before wiki freezing, data collecting of the final result (linear transfer function transformed from hill function) were still under progressing. Primary result demonstrated that it worked as expected, which will be show at Jamboree.
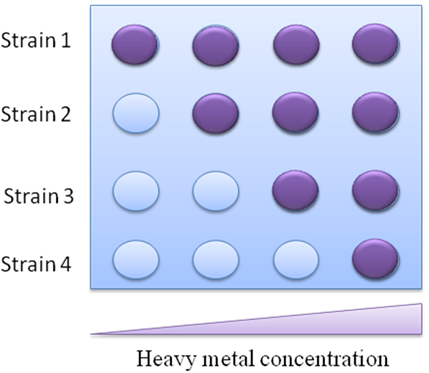
If the transfer function of bioreporter response represents linear , the working range of the bioreporter will be expanded, and the error rating will be reduced. This type of bioreporter will be excellent for in lab accurate measurement or heavy metal pollution assessment. To determine the pollution level in field, we developed an assay easy to understand and accessible to the general public, called traffic light bioassay. By using bacteria strains with different sensitivity threshold to mercury, the heavy metal concentration can be easily determined by the number of reporter strains reacting to a sample, which is representative to different heavy metal concentration range (Fig.3).
Fig 3. The schematic sketch of how the biosensor functions.
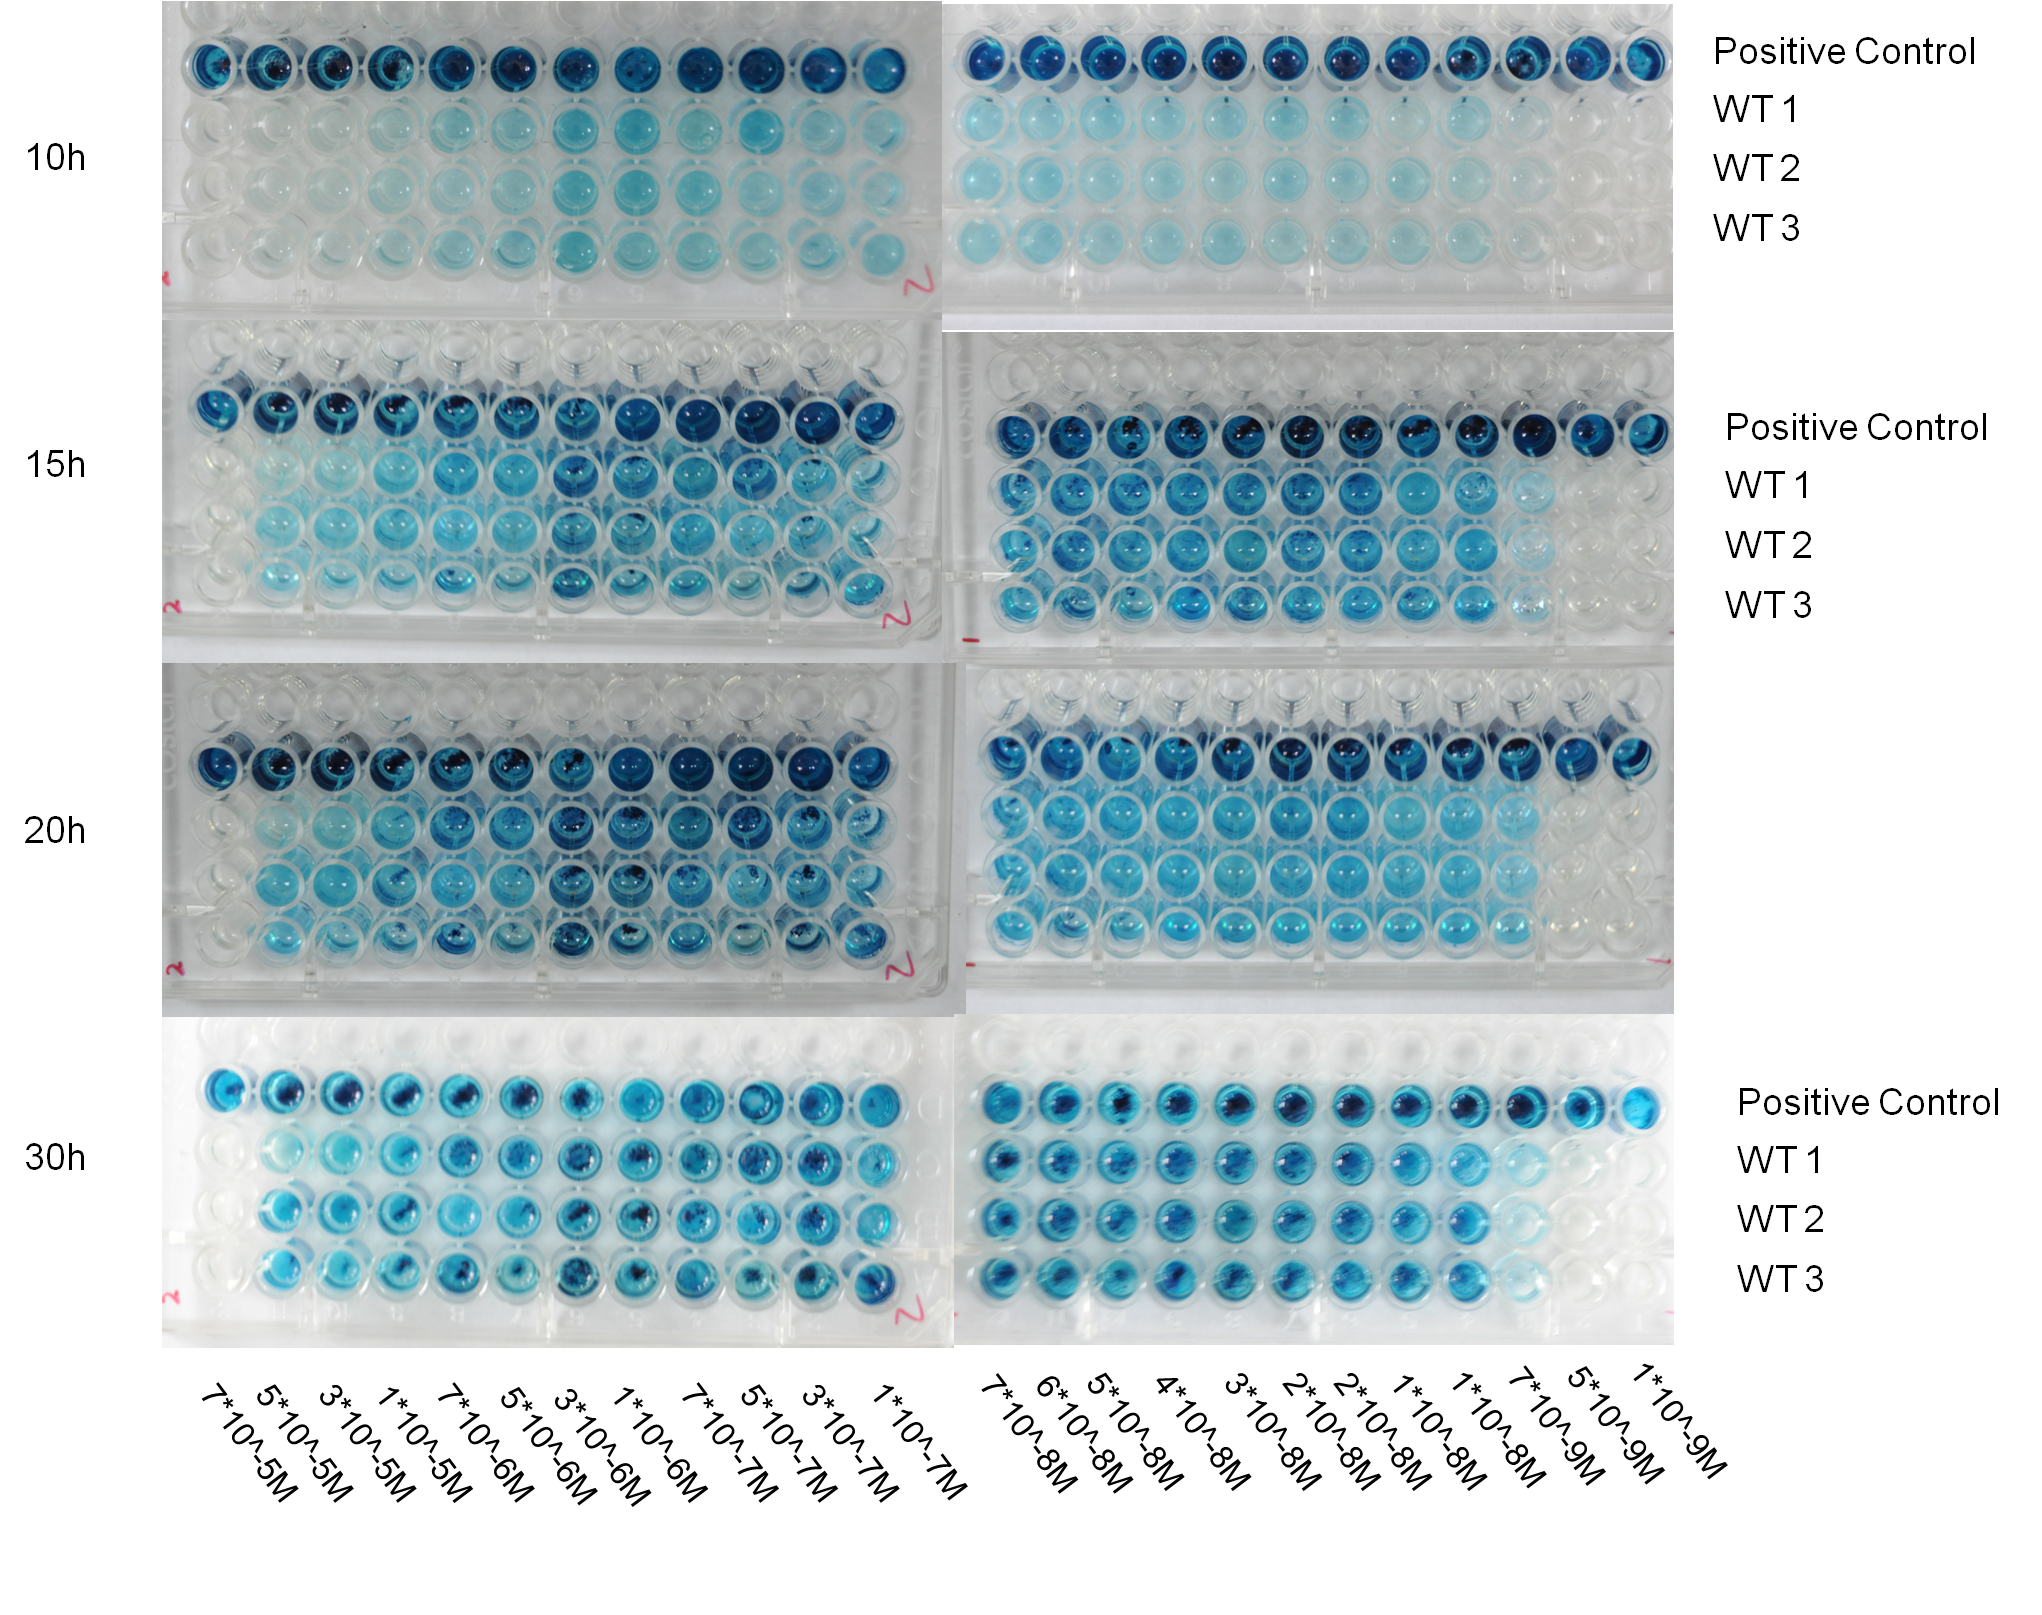
Fig 4. The primary result of traffic light bioassay, which was performed in the 96-well plate. The response of whole-cell bioreporter incubated with simulated mercury containing polluted water was recorded by digital image at 10h, 15h, 20h and 30h. 3 replicates of 1 biosensor strain behaved very similarly with respect to indicating the mercury concentration range in a wide time window. Surprisingly, the biosensor strain we selected was able to response to 7*10^-9M mercury (II) with repeatability and the color contrast of mercury concentration near the threshold seemed to be good.
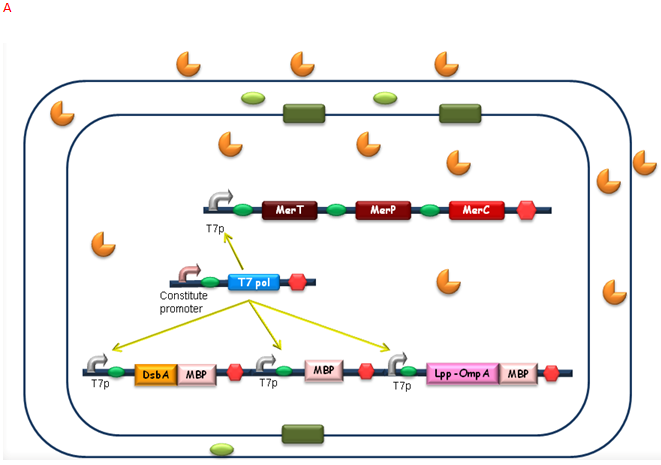
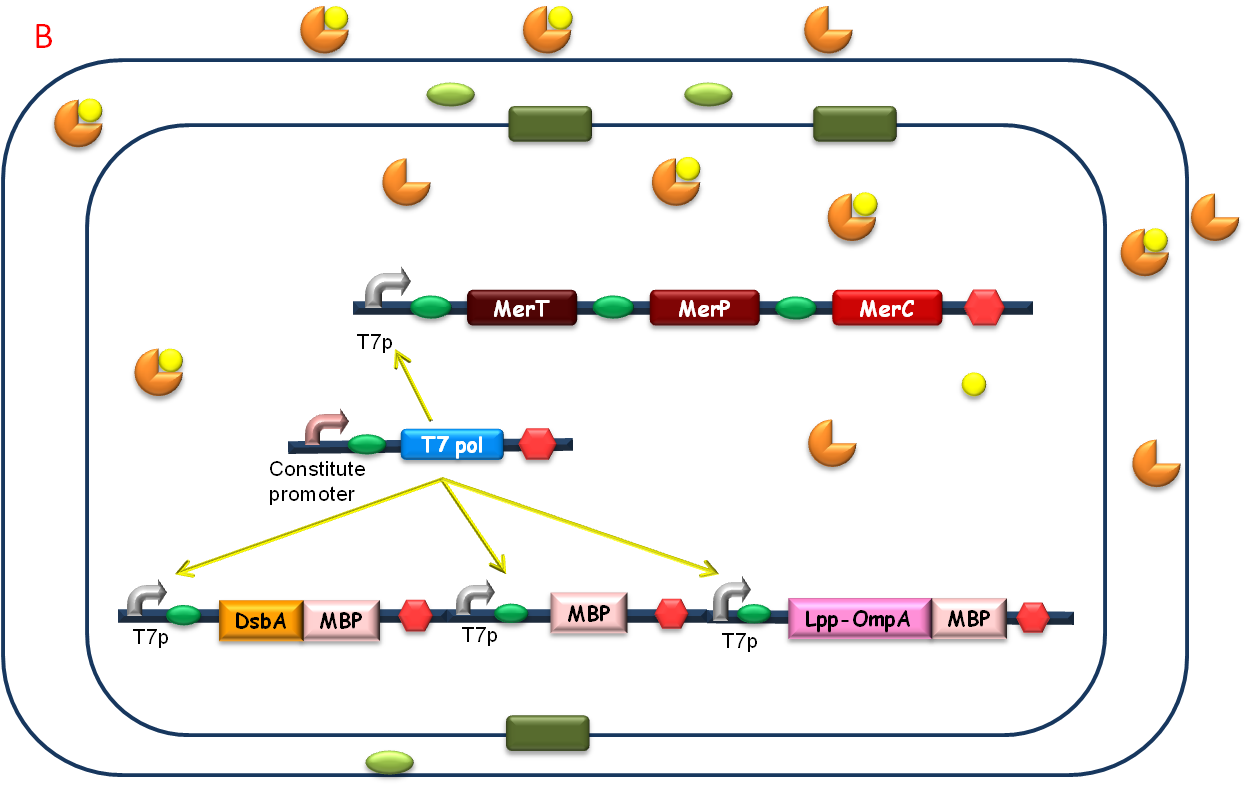
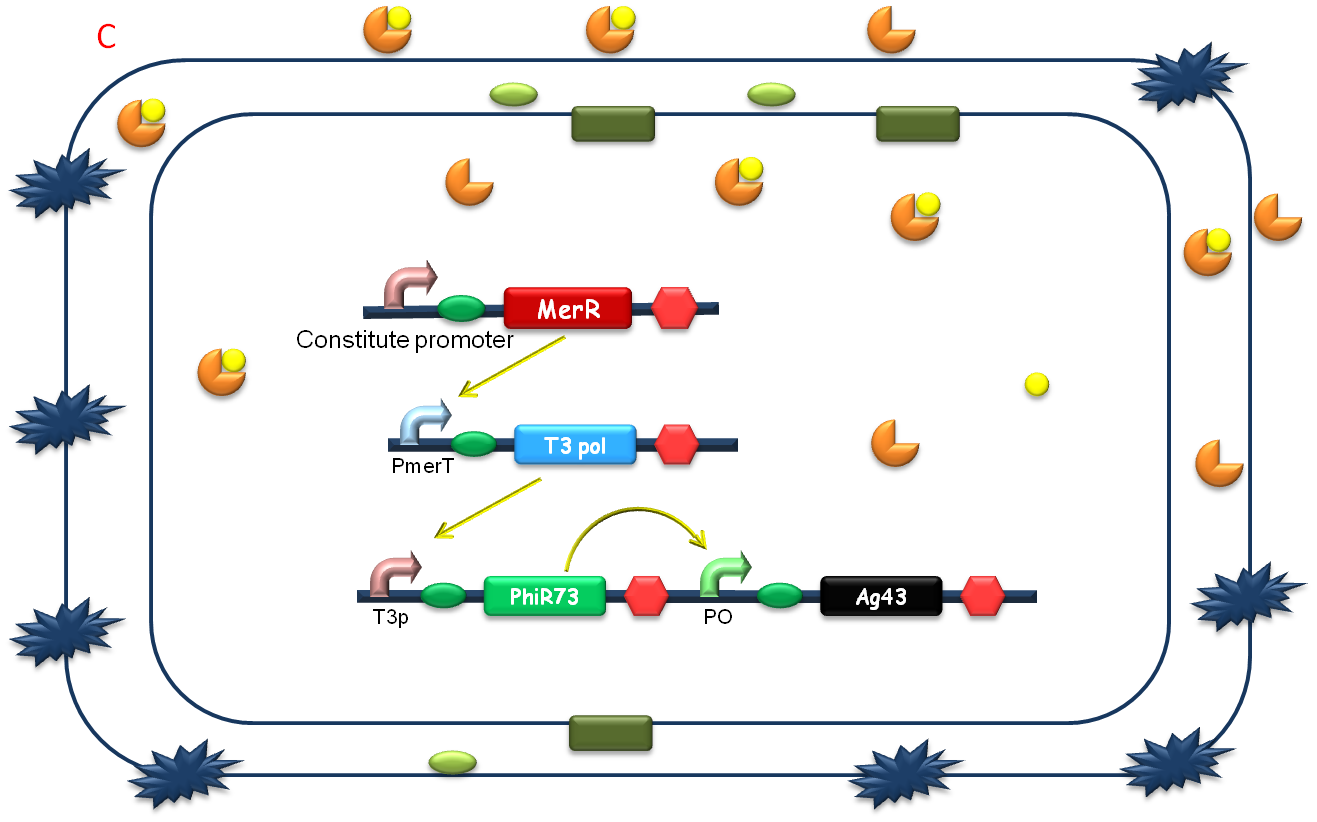
After the heavy metal concentration determined, it’s time for our bioabsorbent to decontaminate the heavy metal ions from water. Firstly, bacteria switch on MBP generating device and facilitation module to get ready-to-use (Fig 5A). Then bioabsorbent will be applied to the contaminated water, to absorb heavy metal ions, for instance, mercury (II) with high performance (Fig 5B). At the same time, a genetic cascade will amplify the input (presence of mercury) and Ag43 will be expressed finally with a time delay and high intensity. When the bacteria sedimentate, post treatment will be ready to be conducted (Fig 5C).
Fig. 5 The schematic of how our bioabsorbent functions. A: bioabsorbent gets ready-to-use; B: bioabsorbent absorbs heavy metal ions from water; C: bioabsorbent autoagretate at a population level.
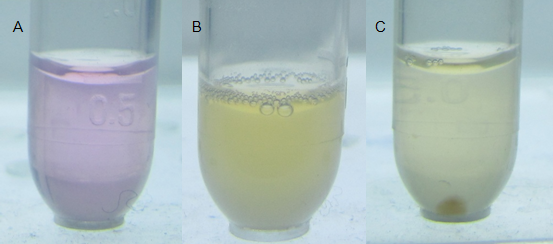
To better demonstrate the function and performance of our bioreporter, we used the characterized indicator for direct visualization of mercury detoxification and bacterial aggregation process, using method described at MBP Expression Page of our wiki.
Fig. 6 Direct visualization of mercury detoxification and bacterial aggregation process. Water-soluble metal indicator with colorimetric selectivity for heavy metals was exploited to indicate the mercury concentration in the water. The lower limit of metal concentration for color transition was 0.8×10⁻⁵M. (A) The indicator represented rosy color, indicating that high concentration of mercury existed (for more details, see our MBP Expression Page). (B) When applied with our mercury bioabsorbent, after shaking cultured at 37℃ for 10 min, evident color change emerged, indicating that the absorption was under progressing. (C) 30 min later, bacteria aggregated even under slight shaking cultivating at 37℃ in an aslant tube, forming a visible pellet at the bottom. It’s notable that mercury had been decontaminated because the significant color change of the indicator.
To conclude the above work, we have developed a extensible method to construct heavy metal decontamination kits consisting of efficient bioreporters and bioabsorbents both for in field application and in lab use. Compared with the technologies we have now, this biological engineering approach gives advantages to its bioavailability assessment, relatively low cost and less resource consumption. More importantly, it clearly points the way of future development. As a revolutionary progress, we believe, the conceptual advancement if of great value when the potential of bio-decontamination is unveiled. At present, it is highly probable that bioremediation is confined in the laboratory study, taking possible defects of mass application and public panic over transgenic products into consideration. However, as long as this promising field is constantly being probed into, we are firmly convinced that, there will be more experts devoted into relevant research, thus optimizing the bio-decontamination method. This is not remote, but imminent; for the biological science and technology is marked by tremendously rapid and ever-accelerating change. Hopefully, we are involved in the exciting improvement and contribute to the rescuing of the environment and human beings ourselves.
 "
"
