Team:ArtScienceBangalore/Project
From 2010.igem.org
Aaronjoseph (Talk | contribs) |
Aaronjoseph (Talk | contribs) |
||
| (11 intermediate revisions not shown) | |||
| Line 16: | Line 16: | ||
</html> | </html> | ||
'''Synthetic/Post-Natural Ecologies''' | '''Synthetic/Post-Natural Ecologies''' | ||
| + | [[Image:Playinggods.jpg]] | ||
| - | In our second year as artists and designers working with synthetic biology, we have decided to investigate the consequences of a synthetic ecology, an ecology in which organisms created in a techno-scientific environment interact with organisms in the wild. C. elegans live on a diet of a variety of bacteria. E.coli being one of them. Genetically modified E. | + | |
| + | In our second year as artists and designers working with synthetic biology, we have decided to investigate the consequences of a synthetic ecology, an ecology in which organisms created in a techno-scientific environment interact with organisms in the wild. C. elegans live on a diet of a variety of bacteria. E.coli being one of them. Genetically modified E.coli can be fed to C.elegans which can then express any double stranded RNA of interest. The dsRNA can knock off specific genes which causes changes in C.elegans.Our experiments have a range of an external factors in two sets, temperature and IPTG. C.elegans, then will act as a marker to express a range of temperatures and concentrations of IPTG in a any given sample.On a utilitarian level, our project investigates the use of C.elegans as a visual marker for changes in environmental conditions and on a more critical level, we are using C.elegans to study the consequences of interactions between engineered organisms and the 'natural' world. | ||
| + | |||
| + | Our goal was to create biobricks that enable indirect engineering of C.elegans behavior mediated by the E.coli. | ||
'''In the beginning...''' | '''In the beginning...''' | ||
| - | Through the summer, we started brain storming with the designers James King and Daisy Ginsberg. Our intentions were to explore the nature of interactions between "synthetic organisms" and a natural ecosystem. The narrative of synthetic biology with its promise of engineered solutions to problems depends on studies of such interactions. Initially, we chose among other organisms penicillium. On the advice of Dr. Mukund Thattai, we chose to work with C. | + | Through the summer, we started brain storming with the designers James King and Daisy Ginsberg. Our intentions were to explore the nature of interactions between "synthetic organisms" and a natural ecosystem. The narrative of synthetic biology with its promise of engineered solutions to problems depends on studies of such interactions. Initially, we chose among other organisms penicillium. On the advice of Dr. Mukund Thattai, we chose to work with C.elegans. |
'''The Experiments''' | '''The Experiments''' | ||
| - | We used the glycerol stocks of the bacterial strains encoding for dsRNA against the genes H14N18.1 and T14F9.1 in the nematode, C. | + | We used the glycerol stocks of the bacterial strains encoding for dsRNA against the genes H14N18.1 and T14F9.1 in the nematode, C. elegans. The vector contained ampR for ampicillin resistance and the C elegans’ genes were introduced after procuring genes of interest using PCR amplification and restriction enzymes. The bacterial strain HT115 (DE3) contained the feeding vector L4440, which contained the H14N18.1 and T14F9.1 genes with T7 promoters on both sides of the MCS. The bacterial RNA polymerase bound to the lac Z promoter only in the presence of IPTG, present in the worm plates. Transcription took place and mRNA was produced, which after translation, produced T7 RNA polymerase. |
Due to the presence of T7 promoters on either side of the MCS, there were two strands of mRNA produced, which were complementary to each other thus producing dsRNA. HT115 (DE3) was RNAase deficient and could not degrade RNA. Therefore, dsRNA molecules were free floating molecules in the bacterial cell. | Due to the presence of T7 promoters on either side of the MCS, there were two strands of mRNA produced, which were complementary to each other thus producing dsRNA. HT115 (DE3) was RNAase deficient and could not degrade RNA. Therefore, dsRNA molecules were free floating molecules in the bacterial cell. | ||
| - | Once inside the worm, dsRNA was able to cross tissue barriers and enter all cells. Proteins present in the cell | + | Once inside the worm, dsRNA was able to cross tissue barriers and enter all cells. Proteins present in the cell recognized dsRNA, bound to it and separated the double stranded structure. One strand bound to the endogenous C.elegans mRNA and degraded the mRNA. Thus, no protein was produced. The other strand produced its complement using RNA dependent RNA polymerase. This process was repeated on loop and thus all protein synthesis was prohibited, causing the worms to have defects in motion, growth and cuticle development. |
| + | |||
| + | [[Image:_MG_9006.JPG|340px]] | ||
| + | [[Image:_MG_9008.JPG|340px]] | ||
| + | |||
| + | [[Image:_MG_9022.JPG|340px]] | ||
| + | [[Image:_MG_9024.JPG|340px]] | ||
| + | |||
| + | [[Image:_MG_9033.JPG|340px]] | ||
| + | [[Image:_MG_9041.JPG|340px]] | ||
| + | |||
| + | [[Image:_MG_9013.JPG|340px]] | ||
| + | [[Image:_MG_9109.JPG|340px]] | ||
'''Protocol''' | '''Protocol''' | ||
| - | For feeding plates, NGM agar was prepared including 25 μg/ml carbenicillin (carb)and 0.0, 0.5 and1mM IPTG; 2.5 ml of agar was dispensed into 35 mm plates. | + | For feeding plates, NGM agar was prepared including 25 μg/ml carbenicillin (carb)and 0.0, 0.5 and1mM IPTG; 2.5 ml of agar was dispensed into 35 mm plates. Plates were allowed to dry inverted for 4–8 days at room temperature before use. Bacteria from glycerol stocks were spotted onto LB–agar plates including 50 μg/ml Amp. Large innocula of bacteria were picked, inoculated into LB with 50 μg/ml Amp, and grown for 6–8 h with shaking at 37 °C; 1 drop of this culture was seeded per well into the above NGM derivative plates, and the plates were dried thoroughly before being incubated overnight (12–24 h) at room temperature to allow the bacteria to grow and to begin induction. N2 gravid adults were bleached, L4 larvae were picked and five were transferred into each plate. Plates were incubated at 22 °C. This was done in 3 plates of the same concentration of IPTG, thereby performing each experiment in triplicate to ensure reproducibility of results. The worms were allowed to lay eggs. After allowing surviving eggs to hatch, embryonic lethality and early larval phenotypes could be scored using a dissecting microscope. Post embryonic phenotypes were scored at successive 24-h |
intervals. | intervals. | ||
| + | |||
| + | [[Image:_IMG_3747.JPG|340px]] | ||
| + | [[Image:_MG_9114.JPG|152px]] | ||
| + | [[Image:_IMG_3775.JPG|152px]] | ||
| + | |||
| + | [[Image:_IMG_3284.JPG|340px]] | ||
| + | [[Image:ASB_pic.jpg|340px]] | ||
| + | |||
| + | [[Image:_IMG_3787.JPG|340px]] | ||
| + | [[Image:_IMG_3751.JPG|340px]] | ||
| + | |||
| + | [[Image:_IMG_8775.JPG|340px]] | ||
| + | [[Image:_IMG_8816.JPG|340px]] | ||
| + | |||
| Line 104: | Line 134: | ||
[[Image:09th_H14_-_0.5.jpg|200px|thumb|H14N18.1 with 0.5 conc of IPTG|none]] | [[Image:09th_H14_-_0.5.jpg|200px|thumb|H14N18.1 with 0.5 conc of IPTG|none]] | ||
[[Image:09th_H14_-_1.0.jpg|200px|thumb|H14N18.1 with 1.0 conc of IPTG|none]] | [[Image:09th_H14_-_1.0.jpg|200px|thumb|H14N18.1 with 1.0 conc of IPTG|none]] | ||
| + | |||
| + | |||
| Line 110: | Line 142: | ||
[[Image:10th_H14-0.0.jpg|200px|thumb|H14N18.1 with 0.0 conc of IPTG|none]] [[Image:10th_H14-0.5.jpg|200px|thumb|H14N18.1 with 0.5 conc of IPTG|none]] [[Image:10th_H14-1.0.jpg|200px|thumb|H14N18.1 with 1.0 conc of IPTG|none]] | [[Image:10th_H14-0.0.jpg|200px|thumb|H14N18.1 with 0.0 conc of IPTG|none]] [[Image:10th_H14-0.5.jpg|200px|thumb|H14N18.1 with 0.5 conc of IPTG|none]] [[Image:10th_H14-1.0.jpg|200px|thumb|H14N18.1 with 1.0 conc of IPTG|none]] | ||
| + | |||
| + | |||
| Line 116: | Line 150: | ||
[[Image:11th_Wild.jpg|140px|thumb|Wildtype|none]] | [[Image:11th_Wild.jpg|140px|thumb|Wildtype|none]] | ||
[[Image:11th_H14-0.0.jpg|140px|thumb|H14N18.1 with 0.0 conc of IPTG|none]] [[Image:11th_H14-0.5.jpg|140px|thumb|H14N18.1 with 0.5 conc of IPTG|none]] [[Image:11th_H14-1.0.jpg|140px|thumb|H14N18.1 with 1.0 conc of IPTG|none]] | [[Image:11th_H14-0.0.jpg|140px|thumb|H14N18.1 with 0.0 conc of IPTG|none]] [[Image:11th_H14-0.5.jpg|140px|thumb|H14N18.1 with 0.5 conc of IPTG|none]] [[Image:11th_H14-1.0.jpg|140px|thumb|H14N18.1 with 1.0 conc of IPTG|none]] | ||
| + | |||
| + | |||
| Line 125: | Line 161: | ||
[[Image:12th_H14-0.5.jpg|140px|thumb|H14N18.1 with 0.5 conc of IPTG|none]] | [[Image:12th_H14-0.5.jpg|140px|thumb|H14N18.1 with 0.5 conc of IPTG|none]] | ||
[[Image:12th_H14-1.0.jpg|140px|thumb|H14N18.1 with 1.0 conc of IPTG|none]] | [[Image:12th_H14-1.0.jpg|140px|thumb|H14N18.1 with 1.0 conc of IPTG|none]] | ||
| + | |||
| + | |||
| Line 133: | Line 171: | ||
[[Image:13th_H14-0.5.jpg|140px|thumb|H14N18.1 with 0.5 conc of IPTG|none]] | [[Image:13th_H14-0.5.jpg|140px|thumb|H14N18.1 with 0.5 conc of IPTG|none]] | ||
[[Image:13th_H14-1.0.jpg|140px|thumb|H14N18.1 with 1.0 conc of IPTG|none]] | [[Image:13th_H14-1.0.jpg|140px|thumb|H14N18.1 with 1.0 conc of IPTG|none]] | ||
| + | |||
| + | |||
| Line 141: | Line 181: | ||
[[Image:14th_H14-0.5.jpg|140px|thumb|H14N18.1 with 0.5 conc of IPTG|none]] | [[Image:14th_H14-0.5.jpg|140px|thumb|H14N18.1 with 0.5 conc of IPTG|none]] | ||
[[Image:14th_H14-1.0.jpg|140px|thumb|H14N18.1 with 1.0 conc of IPTG|none]] | [[Image:14th_H14-1.0.jpg|140px|thumb|H14N18.1 with 1.0 conc of IPTG|none]] | ||
| + | |||
| + | |||
| Line 200: | Line 242: | ||
[[Image:11th_T14-0.5.jpg|200px|thumb|T14F9.1 with 0.5 conc of IPTG|none]] | [[Image:11th_T14-0.5.jpg|200px|thumb|T14F9.1 with 0.5 conc of IPTG|none]] | ||
[[Image:11th_T14-1.0.jpg|200px|thumb|T14F9.1 with 1.0 conc of IPTG|none]] | [[Image:11th_T14-1.0.jpg|200px|thumb|T14F9.1 with 1.0 conc of IPTG|none]] | ||
| + | |||
| + | |||
| Line 207: | Line 251: | ||
[[Image:12th_T14-0.5.jpg|200px|thumb|T14F9.1 with 0.5 conc of IPTG|none]] | [[Image:12th_T14-0.5.jpg|200px|thumb|T14F9.1 with 0.5 conc of IPTG|none]] | ||
[[Image:12th_T14-1.0.jpg|200px|thumb|T14F9.1 with 1.0 conc of IPTG|none]] | [[Image:12th_T14-1.0.jpg|200px|thumb|T14F9.1 with 1.0 conc of IPTG|none]] | ||
| + | |||
| + | |||
| Line 214: | Line 260: | ||
[[Image:13th_T14-0.5.jpg|200px|thumb|T14F9.1 with 0.5 conc of IPTG|none]] | [[Image:13th_T14-0.5.jpg|200px|thumb|T14F9.1 with 0.5 conc of IPTG|none]] | ||
[[Image:13th_T14-1.0.jpg|200px|thumb|T14F9.1 with 1.0 conc of IPTG|none]] | [[Image:13th_T14-1.0.jpg|200px|thumb|T14F9.1 with 1.0 conc of IPTG|none]] | ||
| + | |||
| + | |||
| Line 221: | Line 269: | ||
[[Image:14th_T14-0.5.jpg|200px|thumb|T14F9.1 with 0.5 conc of IPTG|none]] | [[Image:14th_T14-0.5.jpg|200px|thumb|T14F9.1 with 0.5 conc of IPTG|none]] | ||
[[Image:14th_T14-1.0.jpg|200px|thumb|T14F9.1 with 1.0 conc of IPTG|none]] | [[Image:14th_T14-1.0.jpg|200px|thumb|T14F9.1 with 1.0 conc of IPTG|none]] | ||
| + | |||
| + | |||
| Line 258: | Line 308: | ||
[[Image:11th_CV-0.5.jpg|200px|thumb|Control Vector with 0.5 conc of IPTG|none]] | [[Image:11th_CV-0.5.jpg|200px|thumb|Control Vector with 0.5 conc of IPTG|none]] | ||
[[Image:11th_CV-1.0.jpg|200px|thumb|Control Vector with 1.0 conc of IPTG|none]] | [[Image:11th_CV-1.0.jpg|200px|thumb|Control Vector with 1.0 conc of IPTG|none]] | ||
| + | |||
| + | |||
| Line 265: | Line 317: | ||
[[Image:12th_CV-0.5.jpg|200px|thumb|Control Vector with 0.5 conc of IPTG|none]] | [[Image:12th_CV-0.5.jpg|200px|thumb|Control Vector with 0.5 conc of IPTG|none]] | ||
[[Image:12th_CV-1.0.jpg|200px|thumb|Control Vector with 1.0 conc of IPTG|none]] | [[Image:12th_CV-1.0.jpg|200px|thumb|Control Vector with 1.0 conc of IPTG|none]] | ||
| + | |||
| + | |||
| Line 272: | Line 326: | ||
[[Image:13th_CV-0.5.jpg|200px|thumb|Control Vector with 0.5 conc of IPTG|none]] | [[Image:13th_CV-0.5.jpg|200px|thumb|Control Vector with 0.5 conc of IPTG|none]] | ||
[[Image:13th_CV-1.0.jpg|200px|thumb|Control Vector with 1.0 conc of IPTG|none]] | [[Image:13th_CV-1.0.jpg|200px|thumb|Control Vector with 1.0 conc of IPTG|none]] | ||
| + | |||
| + | |||
| Line 279: | Line 335: | ||
[[Image:14th_CV-0.5.jpg|200px|thumb|Control Vector with 0.5 conc of IPTG|none]] | [[Image:14th_CV-0.5.jpg|200px|thumb|Control Vector with 0.5 conc of IPTG|none]] | ||
[[Image:14th_CV-1.0.jpg|200px|thumb|Control Vector with 1.0 conc of IPTG|none]] | [[Image:14th_CV-1.0.jpg|200px|thumb|Control Vector with 1.0 conc of IPTG|none]] | ||
| + | |||
| + | |||
| Line 338: | Line 396: | ||
Wild type = 84.06198 μm\sec | Wild type = 84.06198 μm\sec | ||
| + | <html> | ||
| + | <object width="480" height="385"><param name="movie" value="http://www.youtube.com/v/PEtFjsuB0DQ?fs=1&hl=en_US"></param><param name="allowFullScreen" value="true"></param><param name="allowscriptaccess" value="always"></param><embed src="http://www.youtube.com/v/PEtFjsuB0DQ?fs=1&hl=en_US" type="application/x-shockwave-flash" allowscriptaccess="always" allowfullscreen="true" width="480" height="385"></embed></object> | ||
| + | </html> | ||
| - | + | Video graphic Observation on 16.10.10 for Wildtype, H14N18.1, T14F9.1 and Control Vector | |
'''Conclusion''' | '''Conclusion''' | ||
| - | There were some phenotypes of the H14N18.1 gene (roller gene) that were expressed. It is to be noted that phenotypes were expressed more explicitly in larval stages 3 and 4 than stages 1 and 2. Phenotypes related primarily to locomotion and confused coiling movement. Their motion appeared to be slow and sluggish, which is a typical phenotype of the H14 gene in the C | + | There were some phenotypes of the H14N18.1 gene (roller gene) that were expressed. It is to be noted that phenotypes were expressed more explicitly in larval stages 3 and 4 than stages 1 and 2. Phenotypes related primarily to locomotion and confused coiling movement. Their motion appeared to be slow and sluggish, which is a typical phenotype of the H14 gene in the C.elegans. Additionally, they did not respond to external stimuli once past the 2nd larval stage. Larval stages 1 and 2 showed quicker growth than 3 and 4, which might denote that RNAi took effect sometime during stages 2 and 3. |
We observed no phenotypes corresponding to the collagen and cuticle- based cuticle development in the H14. | We observed no phenotypes corresponding to the collagen and cuticle- based cuticle development in the H14. | ||
In the T14F9.1 gene, we observed phenotypes relating to cuticle development, growth and motion. While motion slowed down and eventually almost ceased, dark patterns started to form on the body of the worm. Blisters on the body were apparent, but very few in number. Death was prominent among larval stages 3 and 4, which might again indicate that RNAi took effect during and between stages 2 and 3. | In the T14F9.1 gene, we observed phenotypes relating to cuticle development, growth and motion. While motion slowed down and eventually almost ceased, dark patterns started to form on the body of the worm. Blisters on the body were apparent, but very few in number. Death was prominent among larval stages 3 and 4, which might again indicate that RNAi took effect during and between stages 2 and 3. | ||
When L4 worms reached adulthood, F2 generation started almost immediately. On observation, it was recorded that the F2 generation started to express the phenotype in stages 2 and 3, as opposed to F1 generation which expressed results during stages 3 and 4. Since F2 larvae expressed stronger phenotypes in less time, it might indicate that RNAi took effect sooner in the F2 larvae. | When L4 worms reached adulthood, F2 generation started almost immediately. On observation, it was recorded that the F2 generation started to express the phenotype in stages 2 and 3, as opposed to F1 generation which expressed results during stages 3 and 4. Since F2 larvae expressed stronger phenotypes in less time, it might indicate that RNAi took effect sooner in the F2 larvae. | ||
However, we did observe that lower levels of IPTG did not result in weaker phenotypes. Plates containing 0.0 concentration of IPTG showed similar results as those containing 0.5 concentration and 1.0 concentration. Control animals did not express any phenotypes despite presence of different IPTG concentrations. | However, we did observe that lower levels of IPTG did not result in weaker phenotypes. Plates containing 0.0 concentration of IPTG showed similar results as those containing 0.5 concentration and 1.0 concentration. Control animals did not express any phenotypes despite presence of different IPTG concentrations. | ||
| + | |||
| + | |||
| + | '''Reference Photos''' | ||
| + | |||
| + | [[Image:__MG_9117.JPG|340px]] | ||
| + | [[Image:_IMG_3656.JPG|340px]] | ||
| + | |||
| + | [[Image:_IMG_3657.JPG|340px]] | ||
| + | [[Image:_IMG_3658.JPG|340px]] | ||
| + | |||
| + | [[Image:_IMG_3753.JPG|340px]] | ||
| + | [[Image:_IMG_3768.JPG|340px]] | ||
| + | |||
| + | [[Image:_IMG_3810.JPG|340px]] | ||
| + | [[Image:_IMG_8765.JPG|340px]] | ||
| + | |||
| + | [[Image:_IMG_8766.JPG|340px]] | ||
| + | [[Image:_IMG_8769.JPG|340px]] | ||
| + | |||
| + | [[Image:_IMG_8770.JPG|340px]] | ||
| + | [[Image:_IMG_8773.JPG|340px]] | ||
| + | |||
| + | [[Image:_IMG_8778.JPG|340px]] | ||
| + | [[Image:_IMG_8781.JPG|340px]] | ||
| + | |||
| + | [[Image:_IMG_8783.JPG|340px]] | ||
| + | [[Image:_IMG_8788.JPG|340px]] | ||
| + | |||
| + | [[Image:_IMG_8792.JPG|340px]] | ||
| + | [[Image:_IMG_8802.JPG|340px]] | ||
| + | |||
| + | [[Image:_MG_9023.JPG|340px]] | ||
| + | [[Image:_MG_9027.JPG|340px]] | ||
| + | |||
| + | [[Image:_MG_9044.JPG|340px]] | ||
| + | [[Image:_MG_9047.JPG|340px]] | ||
| + | |||
| + | [[Image:_MG_9049.JPG|340px]] | ||
| + | [[Image:_MG_9064.JPG|340px]] | ||
| + | |||
| + | |||
| + | |||
Latest revision as of 15:55, 27 October 2010
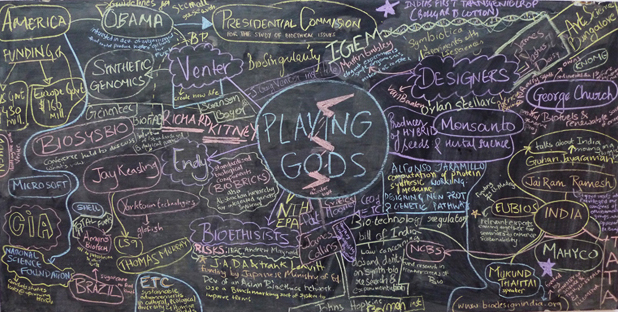
In our second year as artists and designers working with synthetic biology, we have decided to investigate the consequences of a synthetic ecology, an ecology in which organisms created in a techno-scientific environment interact with organisms in the wild. C. elegans live on a diet of a variety of bacteria. E.coli being one of them. Genetically modified E.coli can be fed to C.elegans which can then express any double stranded RNA of interest. The dsRNA can knock off specific genes which causes changes in C.elegans.Our experiments have a range of an external factors in two sets, temperature and IPTG. C.elegans, then will act as a marker to express a range of temperatures and concentrations of IPTG in a any given sample.On a utilitarian level, our project investigates the use of C.elegans as a visual marker for changes in environmental conditions and on a more critical level, we are using C.elegans to study the consequences of interactions between engineered organisms and the 'natural' world.
Our goal was to create biobricks that enable indirect engineering of C.elegans behavior mediated by the E.coli.
In the beginning...
Through the summer, we started brain storming with the designers James King and Daisy Ginsberg. Our intentions were to explore the nature of interactions between "synthetic organisms" and a natural ecosystem. The narrative of synthetic biology with its promise of engineered solutions to problems depends on studies of such interactions. Initially, we chose among other organisms penicillium. On the advice of Dr. Mukund Thattai, we chose to work with C.elegans.
The Experiments
We used the glycerol stocks of the bacterial strains encoding for dsRNA against the genes H14N18.1 and T14F9.1 in the nematode, C. elegans. The vector contained ampR for ampicillin resistance and the C elegans’ genes were introduced after procuring genes of interest using PCR amplification and restriction enzymes. The bacterial strain HT115 (DE3) contained the feeding vector L4440, which contained the H14N18.1 and T14F9.1 genes with T7 promoters on both sides of the MCS. The bacterial RNA polymerase bound to the lac Z promoter only in the presence of IPTG, present in the worm plates. Transcription took place and mRNA was produced, which after translation, produced T7 RNA polymerase. Due to the presence of T7 promoters on either side of the MCS, there were two strands of mRNA produced, which were complementary to each other thus producing dsRNA. HT115 (DE3) was RNAase deficient and could not degrade RNA. Therefore, dsRNA molecules were free floating molecules in the bacterial cell. Once inside the worm, dsRNA was able to cross tissue barriers and enter all cells. Proteins present in the cell recognized dsRNA, bound to it and separated the double stranded structure. One strand bound to the endogenous C.elegans mRNA and degraded the mRNA. Thus, no protein was produced. The other strand produced its complement using RNA dependent RNA polymerase. This process was repeated on loop and thus all protein synthesis was prohibited, causing the worms to have defects in motion, growth and cuticle development.
Protocol
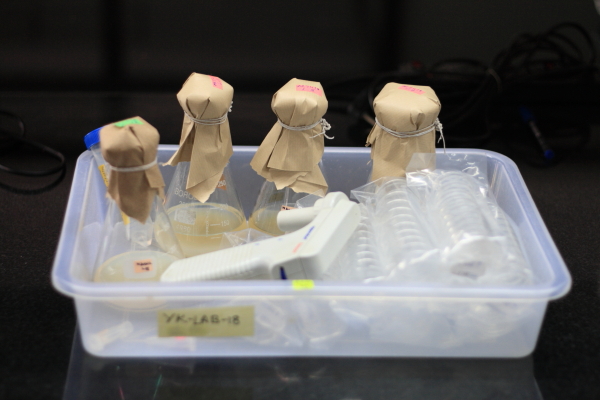
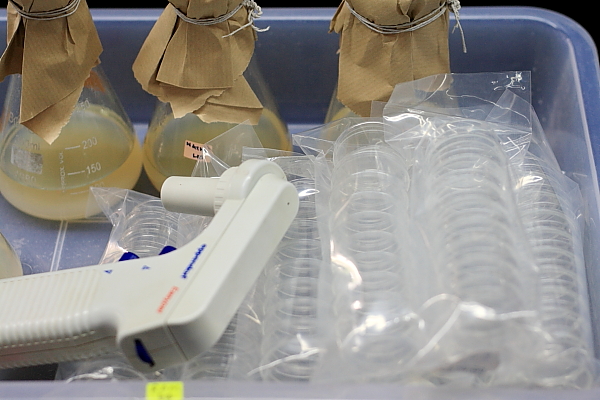
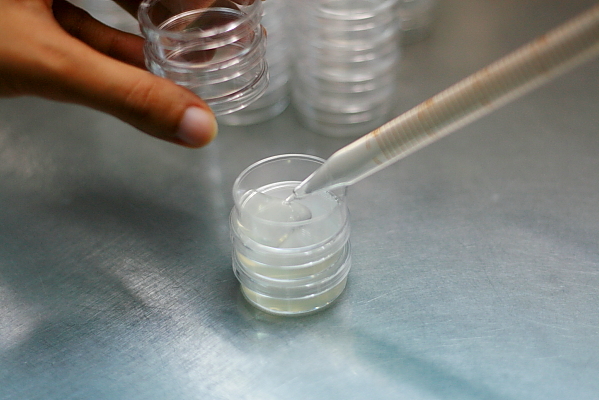
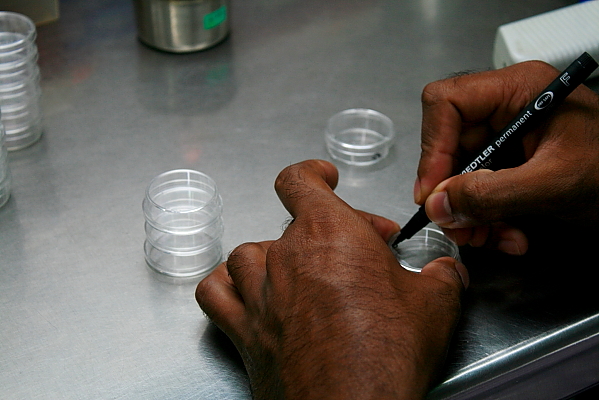
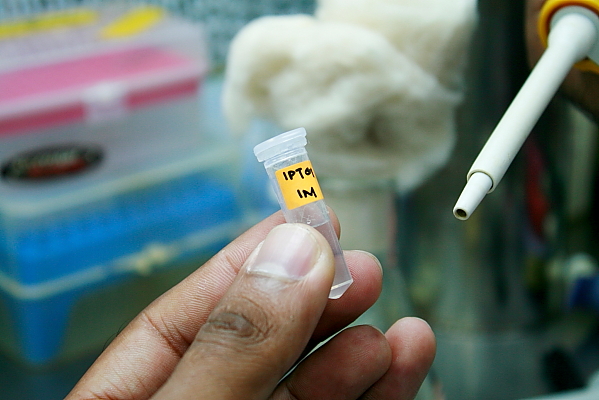
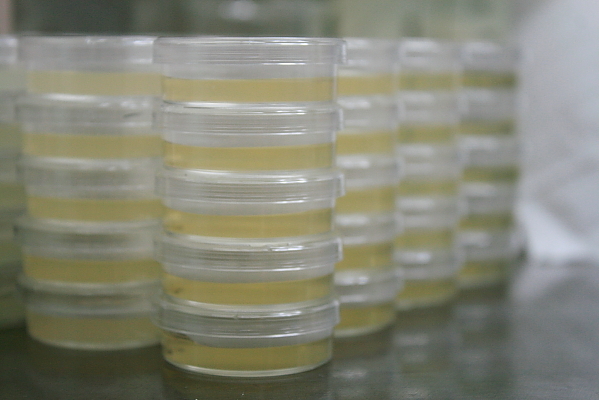
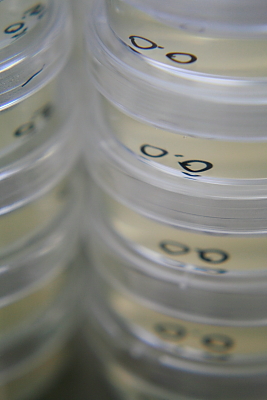
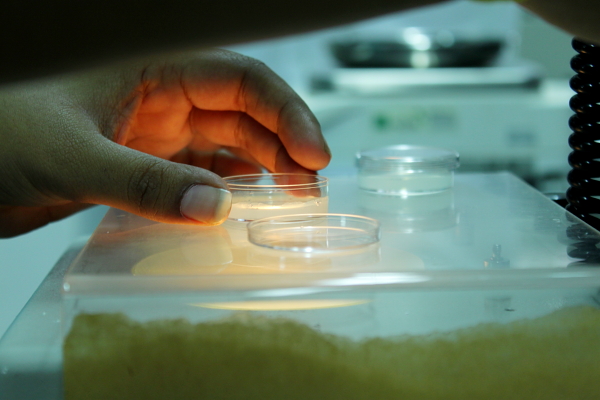
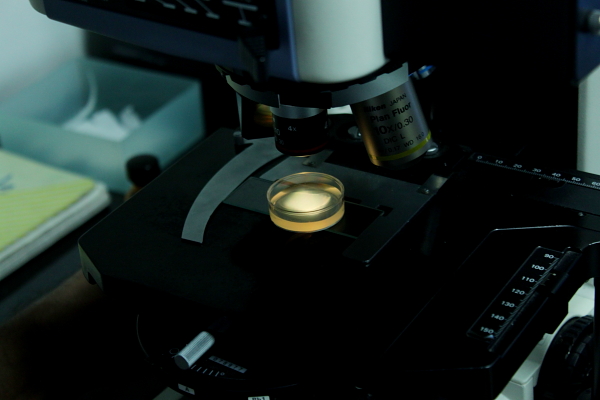
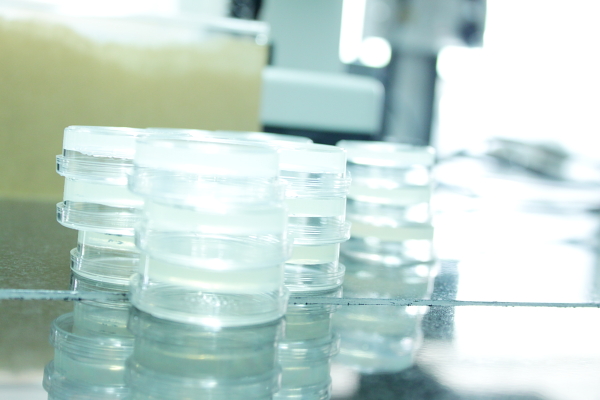
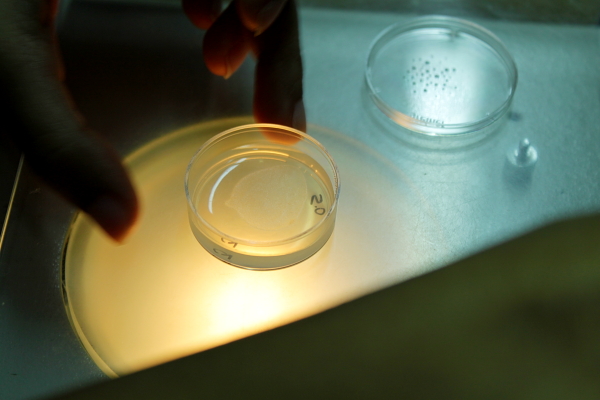
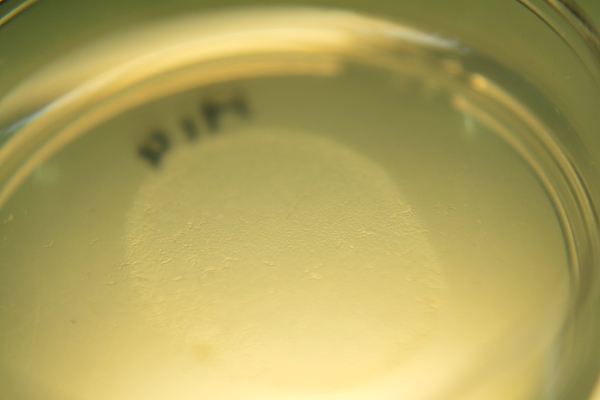
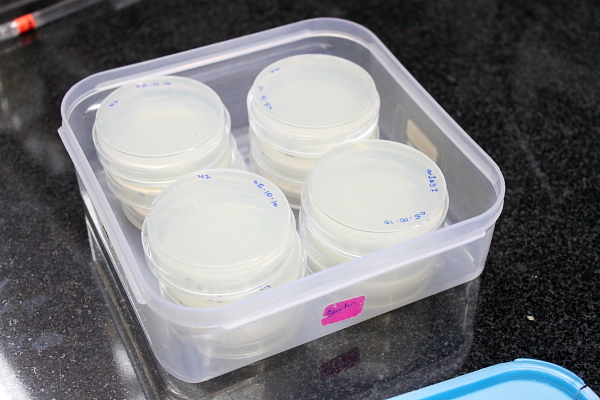
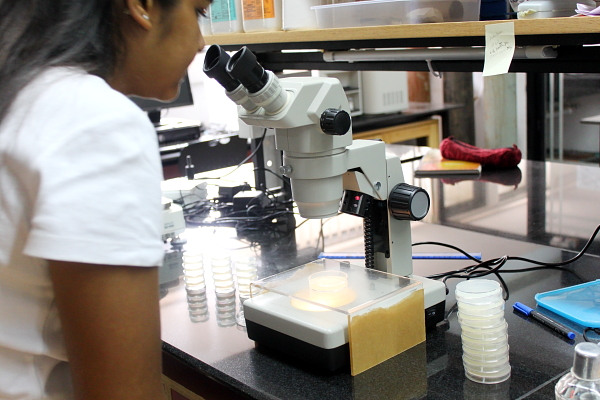
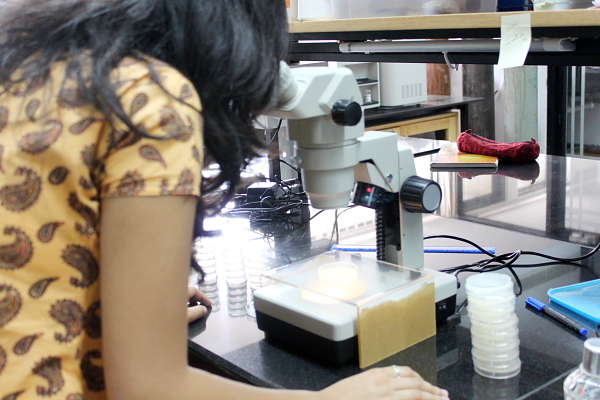
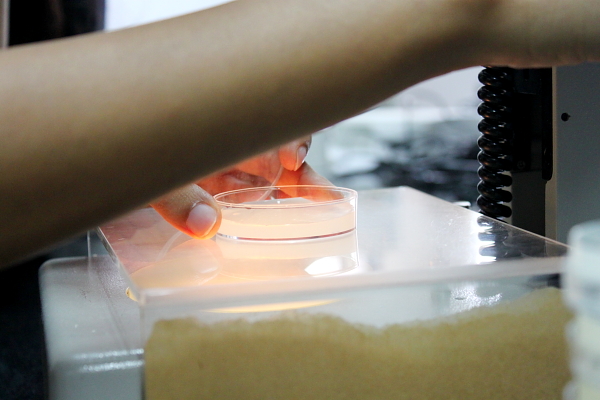
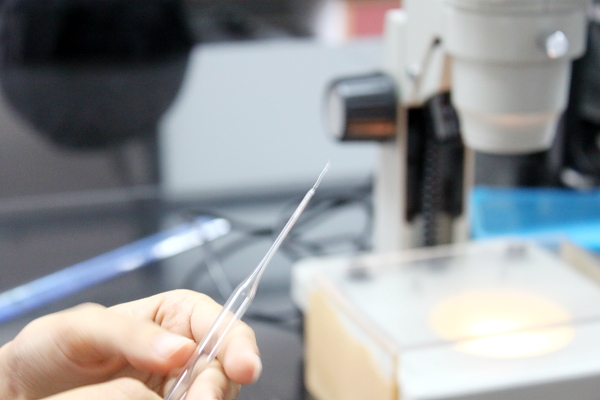
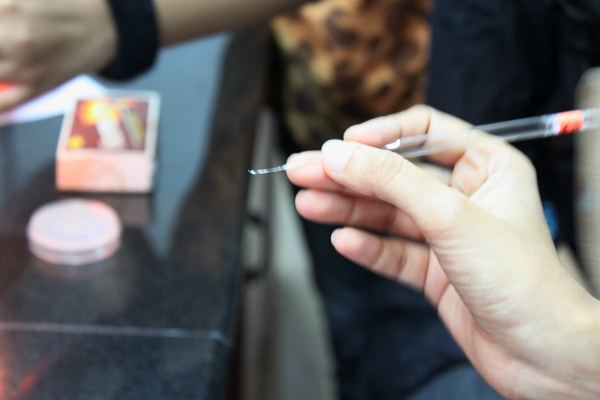
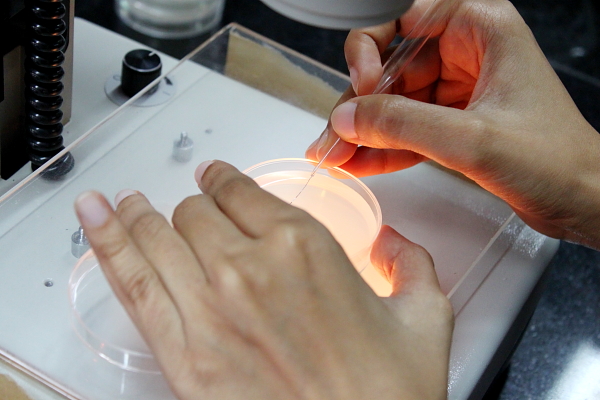
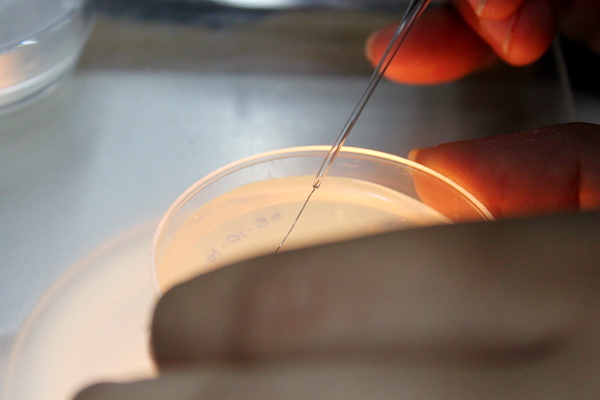
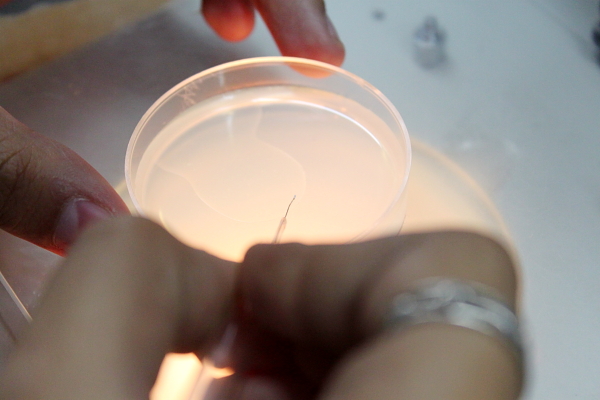
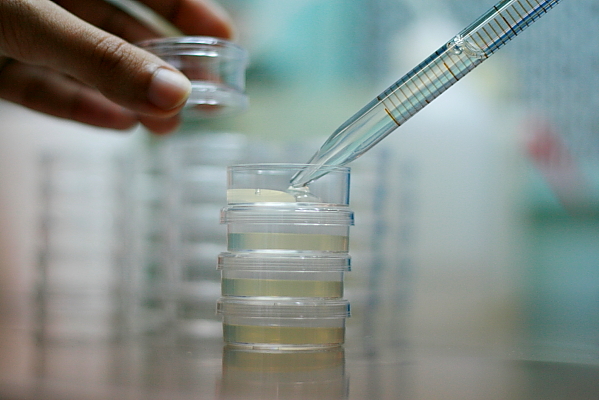
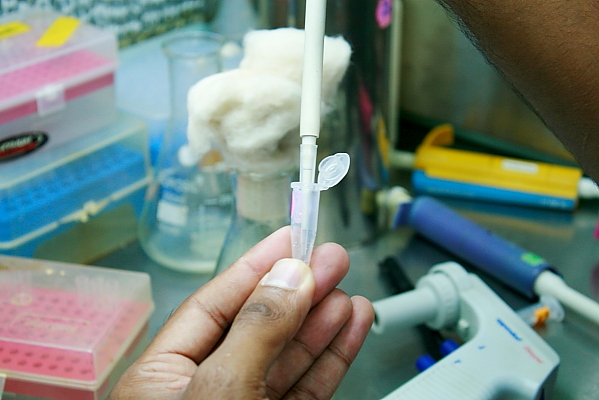
For feeding plates, NGM agar was prepared including 25 μg/ml carbenicillin (carb)and 0.0, 0.5 and1mM IPTG; 2.5 ml of agar was dispensed into 35 mm plates. Plates were allowed to dry inverted for 4–8 days at room temperature before use. Bacteria from glycerol stocks were spotted onto LB–agar plates including 50 μg/ml Amp. Large innocula of bacteria were picked, inoculated into LB with 50 μg/ml Amp, and grown for 6–8 h with shaking at 37 °C; 1 drop of this culture was seeded per well into the above NGM derivative plates, and the plates were dried thoroughly before being incubated overnight (12–24 h) at room temperature to allow the bacteria to grow and to begin induction. N2 gravid adults were bleached, L4 larvae were picked and five were transferred into each plate. Plates were incubated at 22 °C. This was done in 3 plates of the same concentration of IPTG, thereby performing each experiment in triplicate to ensure reproducibility of results. The worms were allowed to lay eggs. After allowing surviving eggs to hatch, embryonic lethality and early larval phenotypes could be scored using a dissecting microscope. Post embryonic phenotypes were scored at successive 24-h intervals.
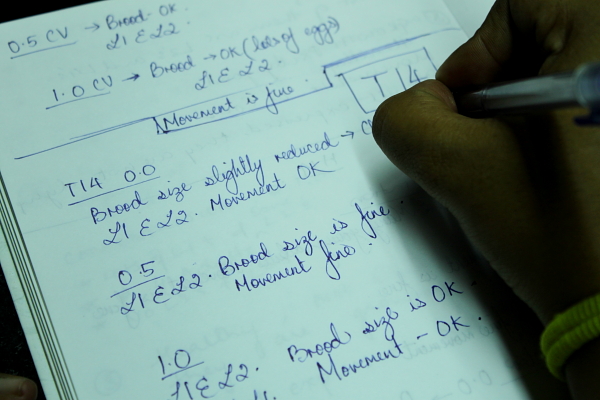
Observation & Analysis
It is to be noted that:
1. There was some bacterial discoloration in T14F9.1 plates. The plates seemed to have a brown tint while they were being cultured.
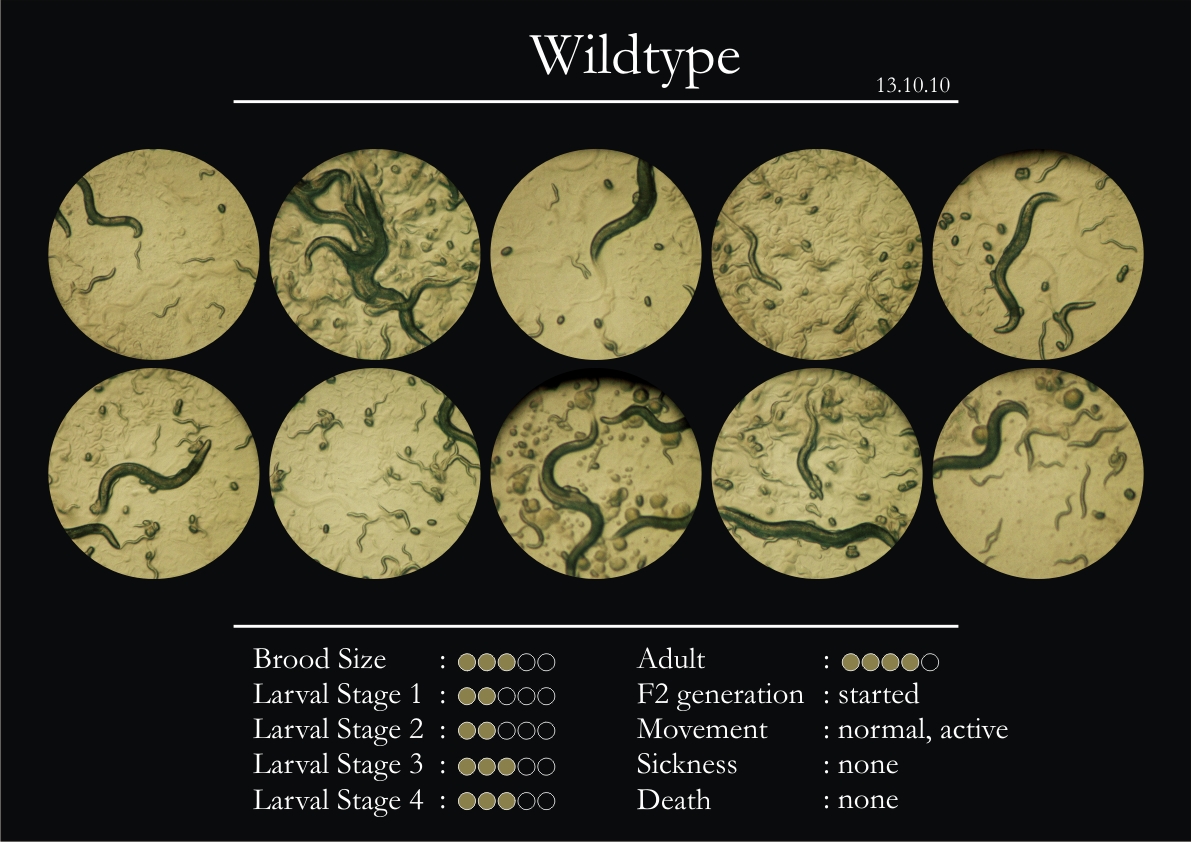
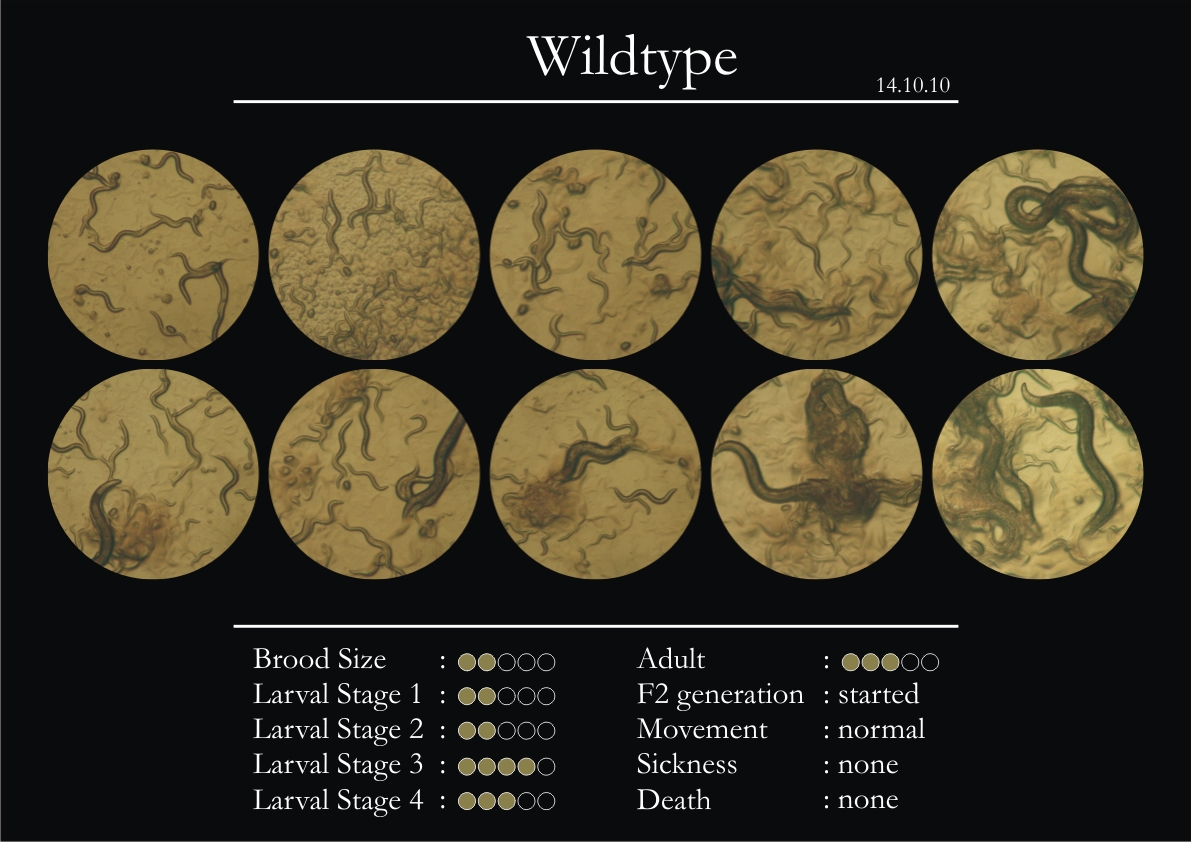
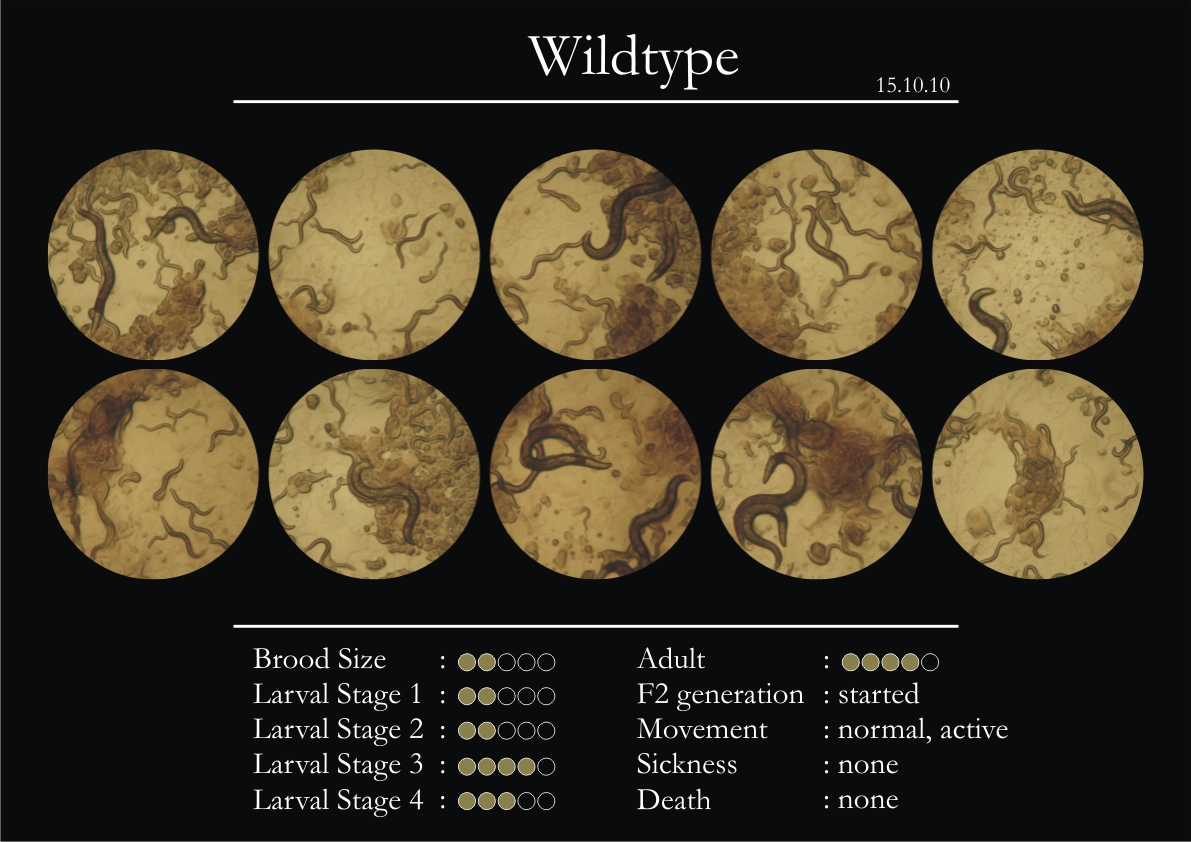
2. 5 wild type adults were introduced into each plate.
3. T14F9.1 gene plates were plated two days after the H14N18.1 gene plates.
4. Each day’s observation was in comparison to the previous day’s observation, i.e. the last observation (LO).
5. 0.0 concentration of IPTG was rounded to 5 molecules of IPTG.
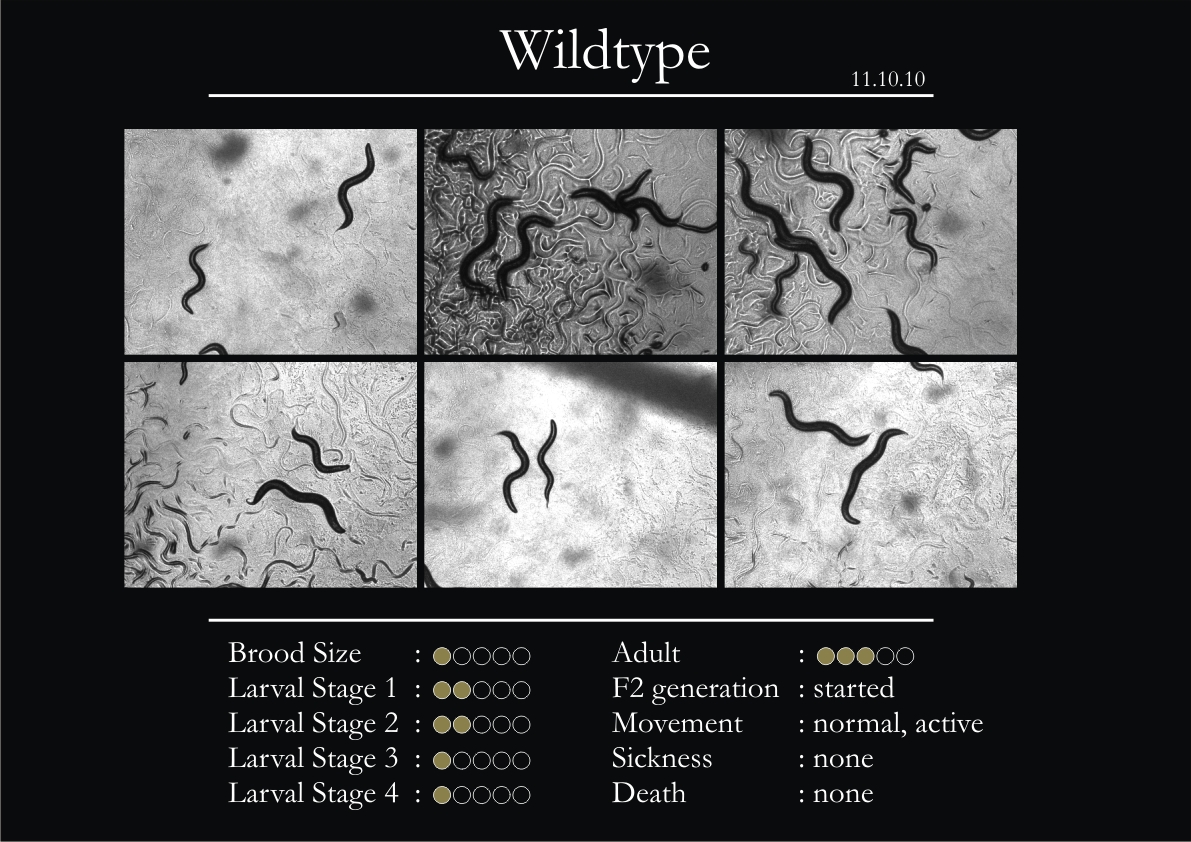
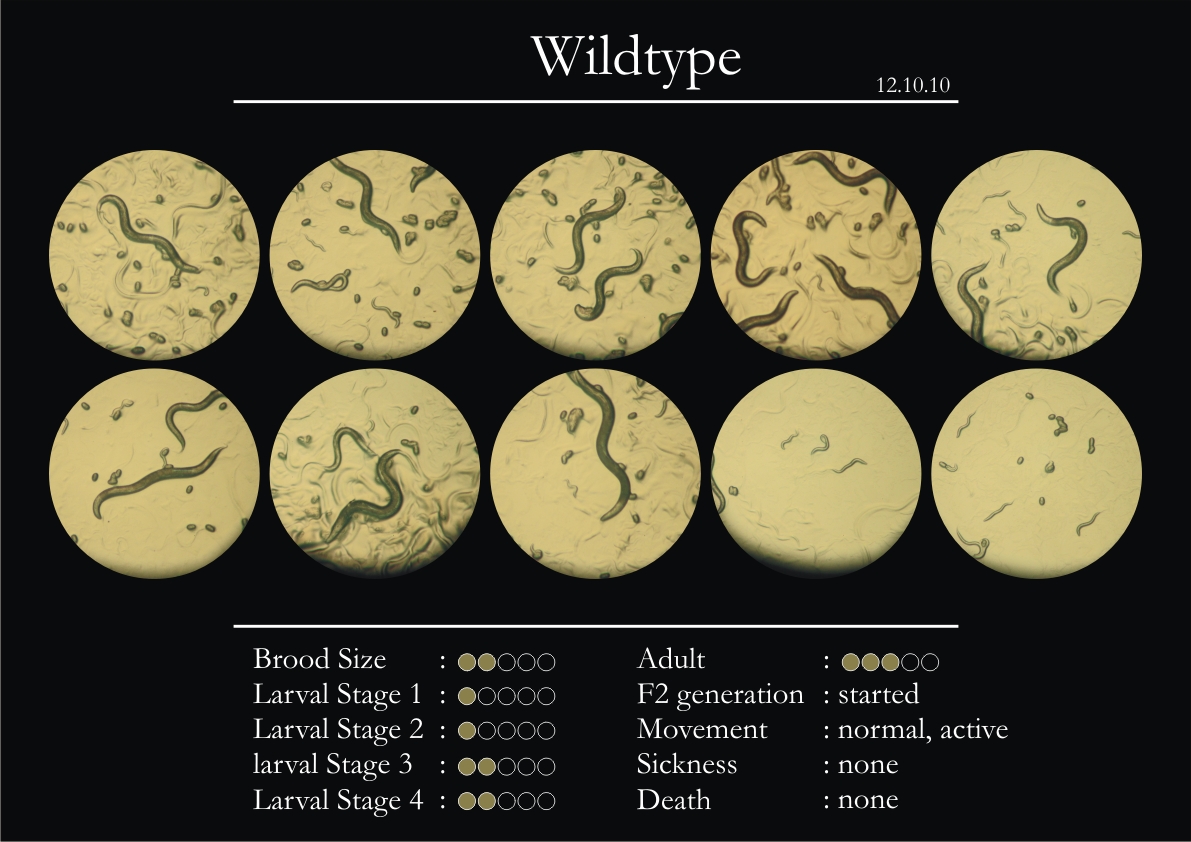
6. All observations with respect to movement were in comparison to the wild type.
7. All the observations were made at a constant magnification of 1.5 X.
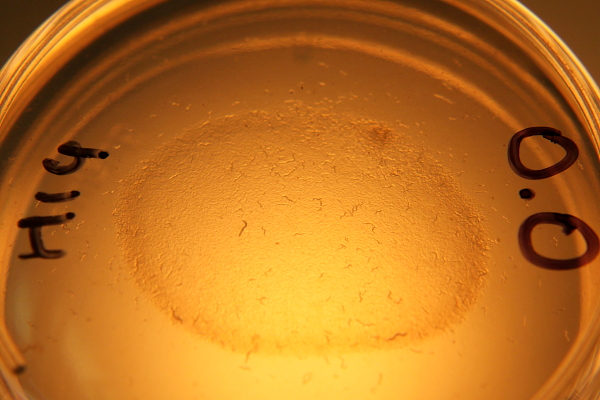
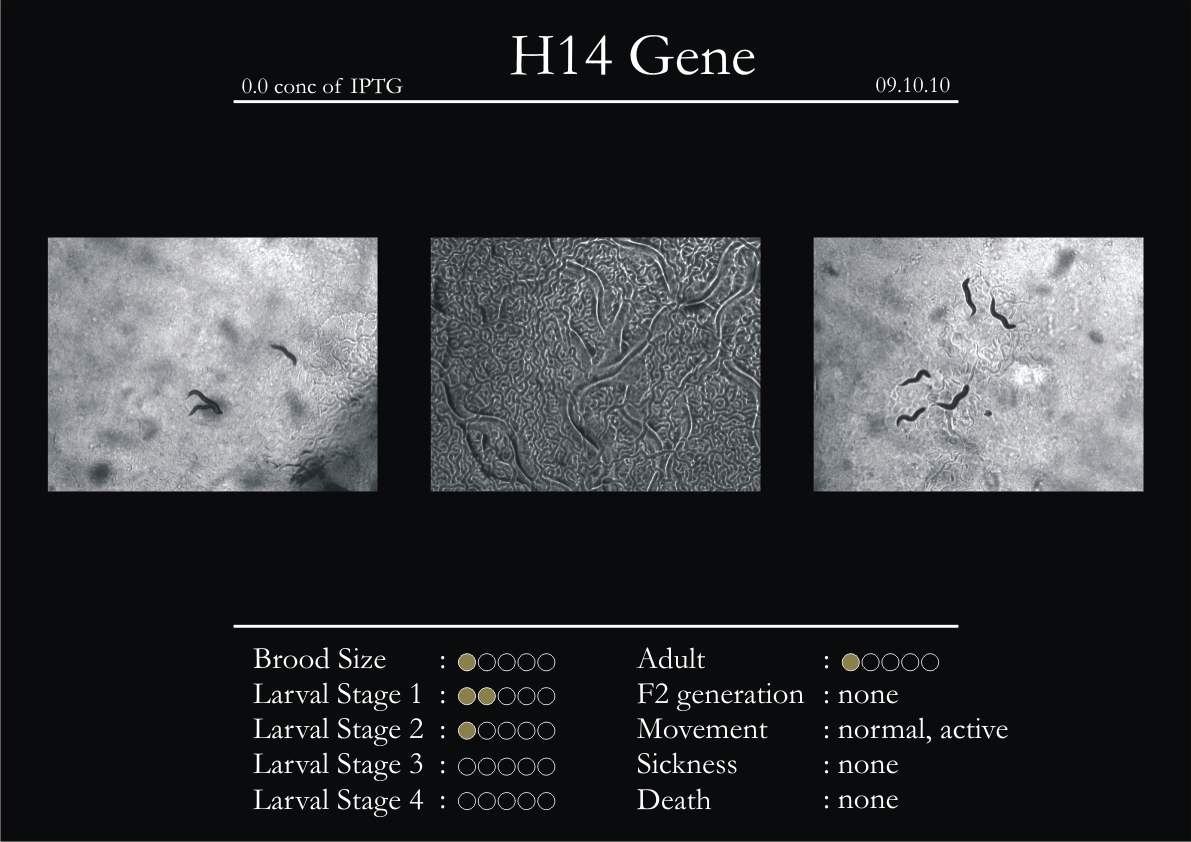
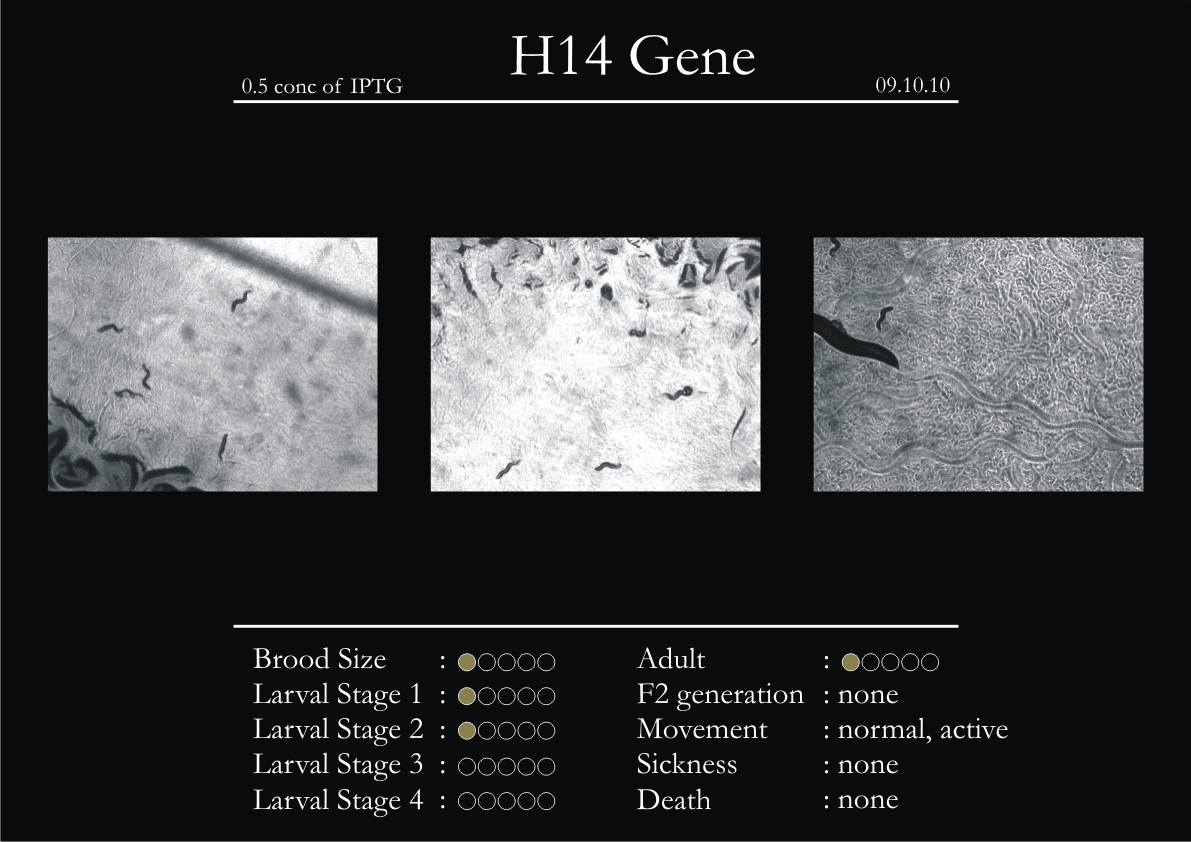
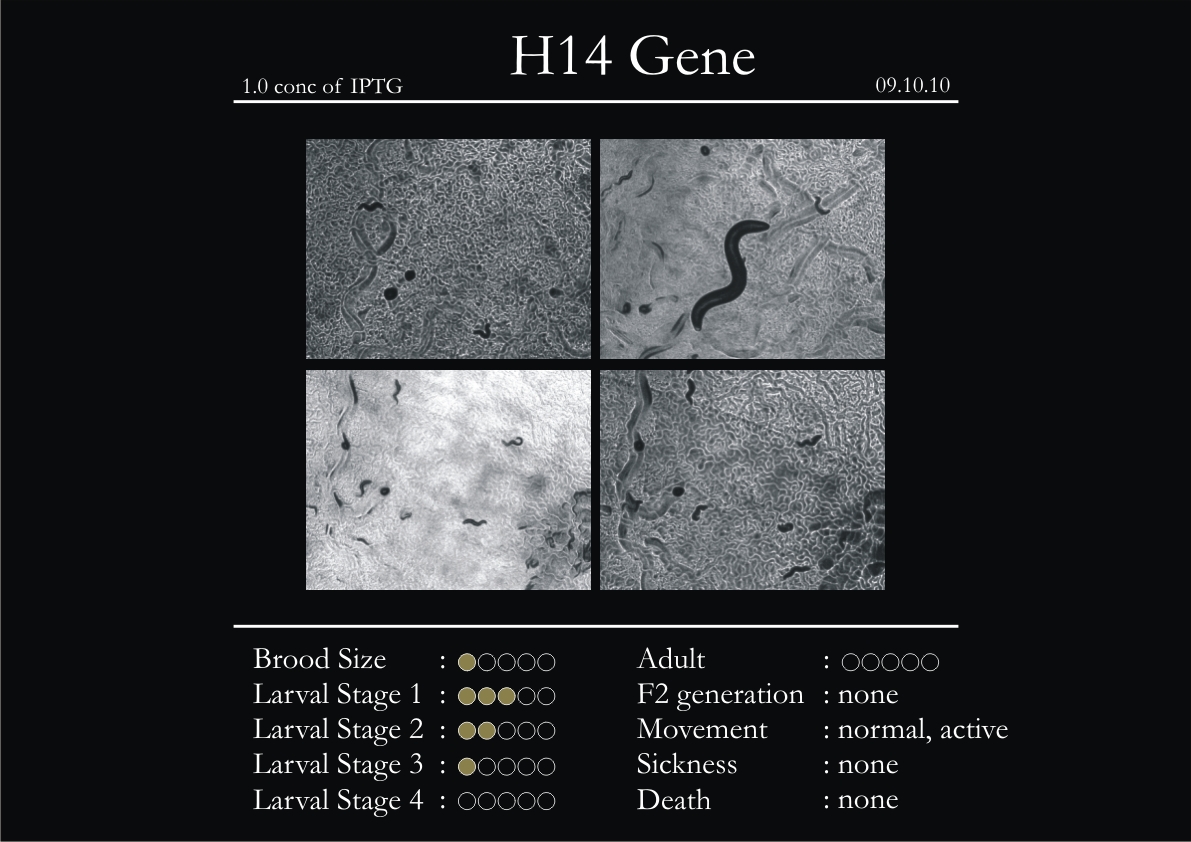
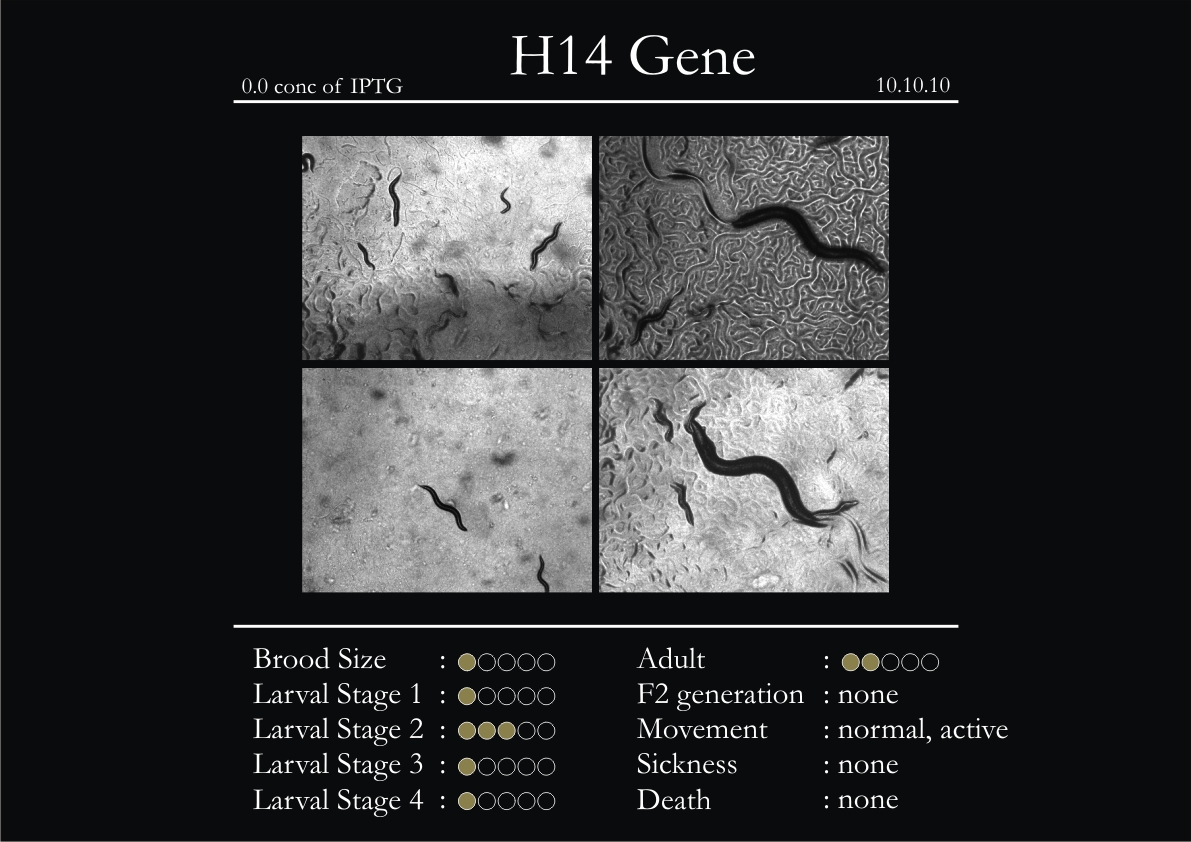
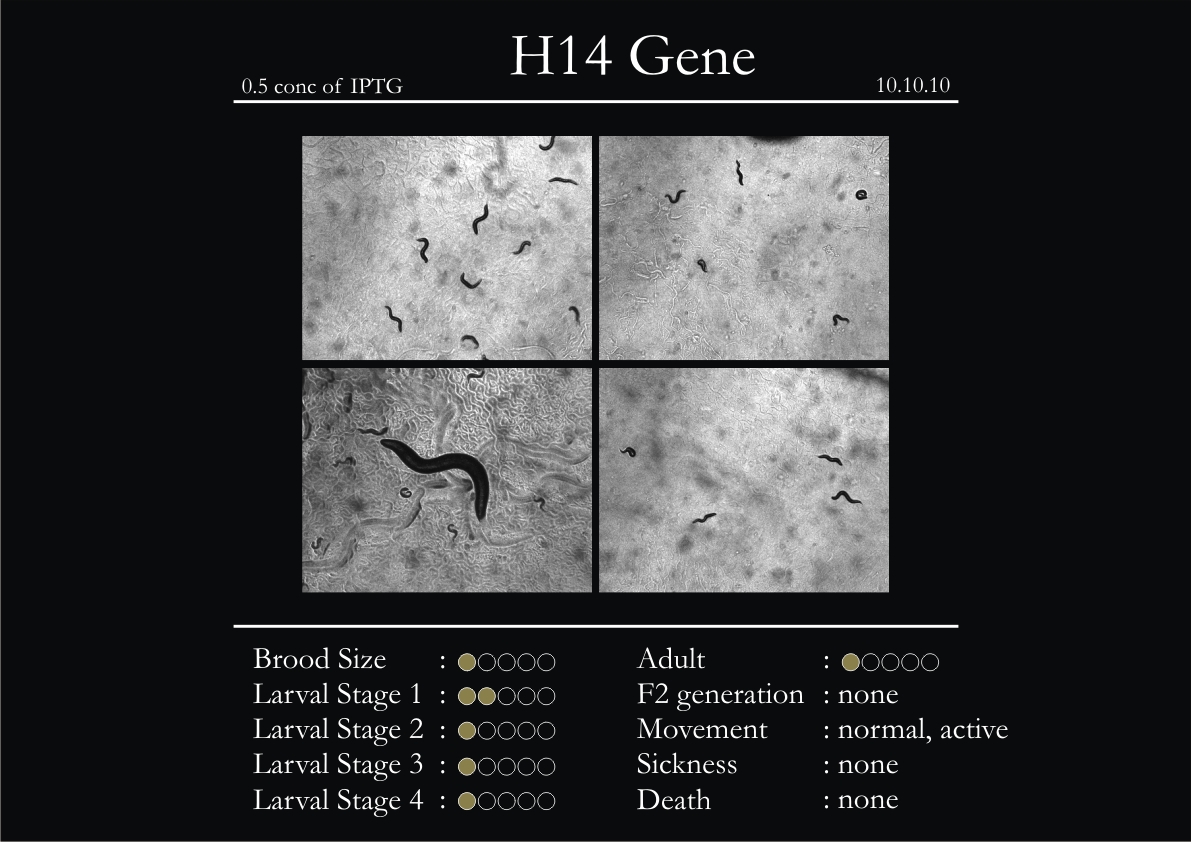
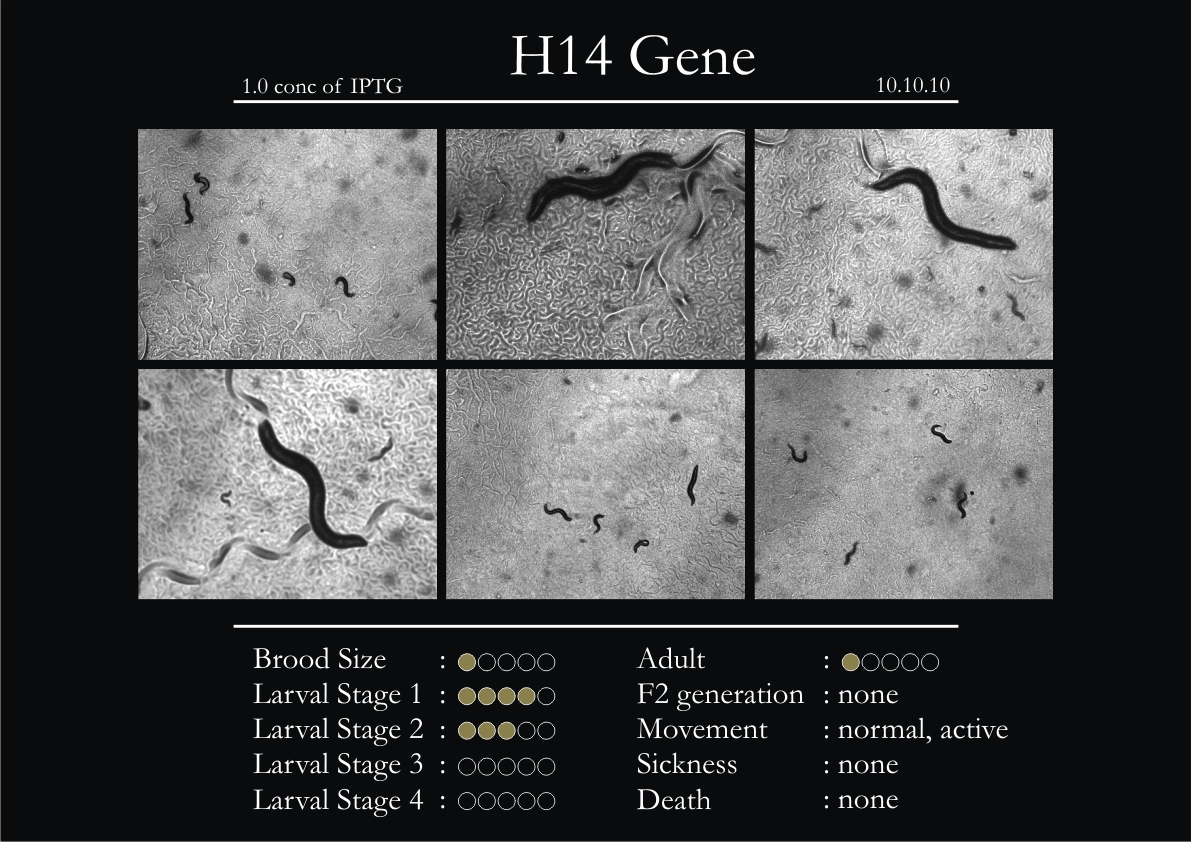
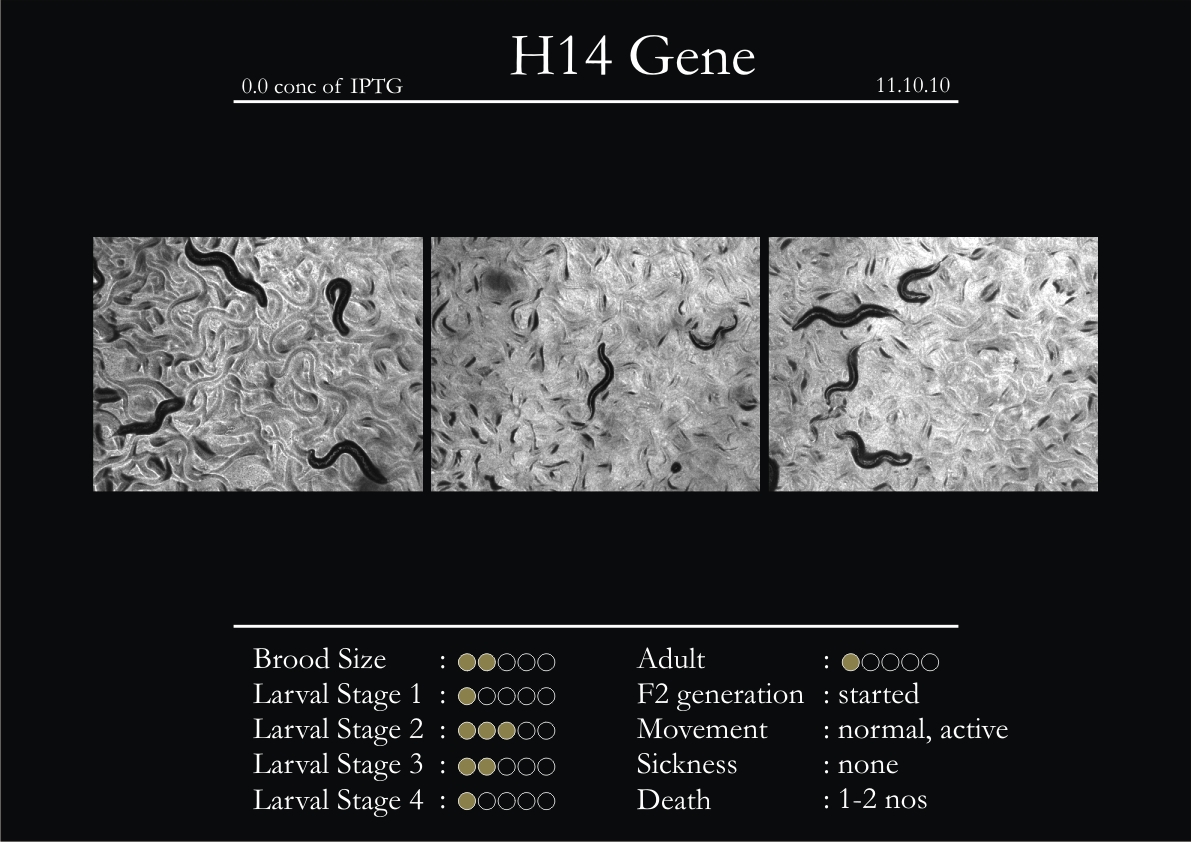
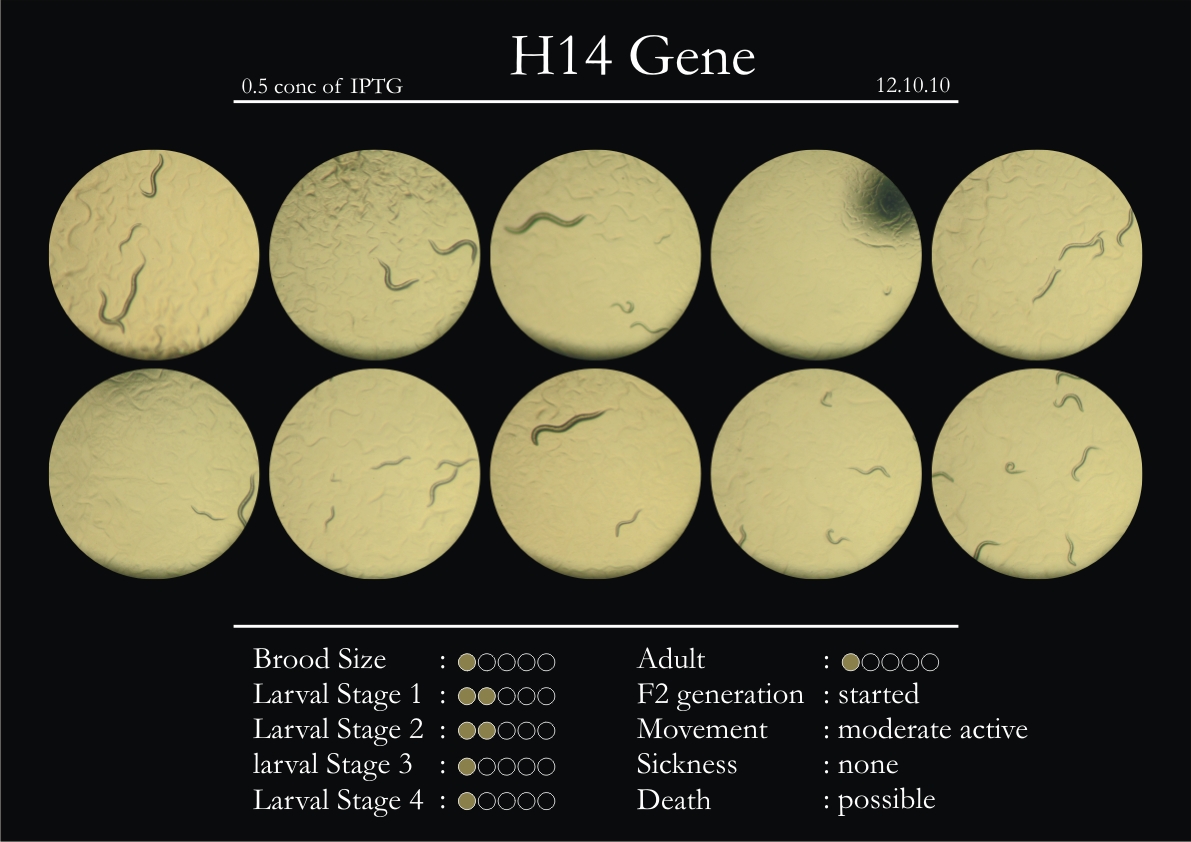
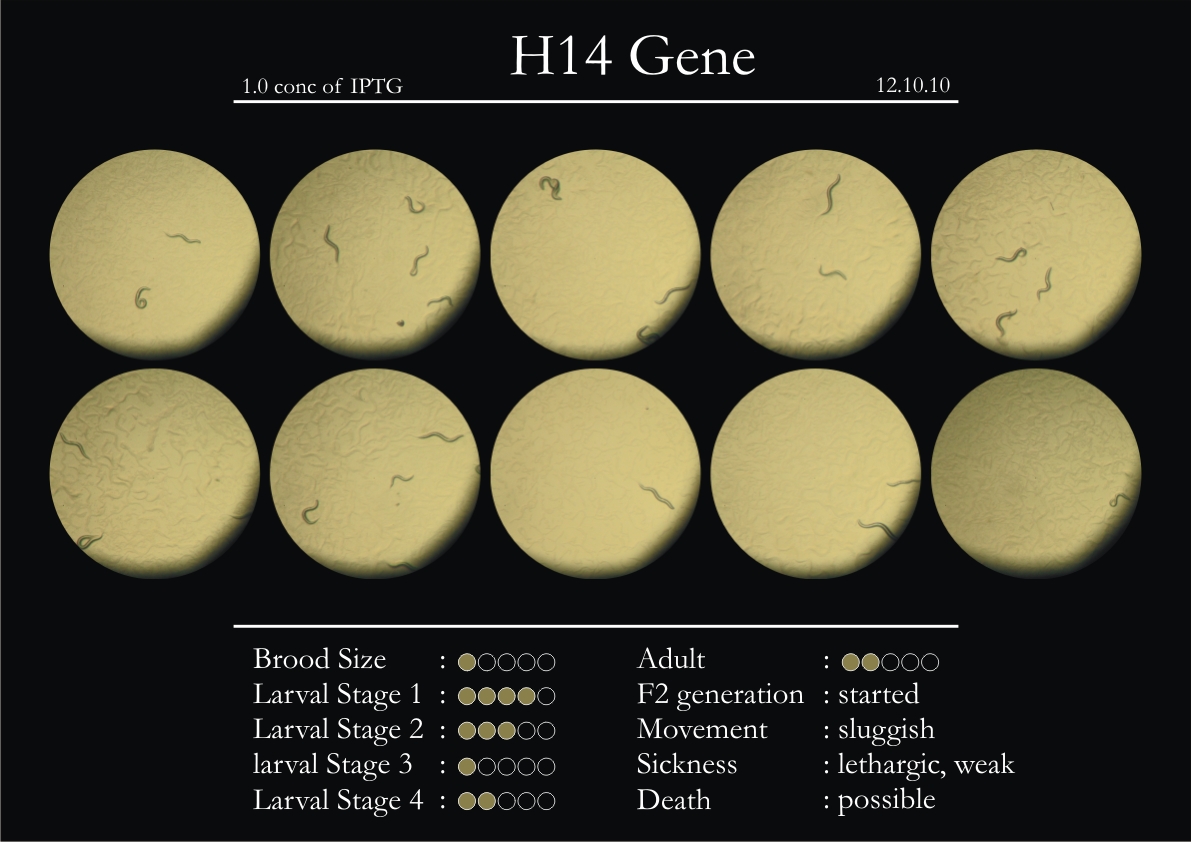
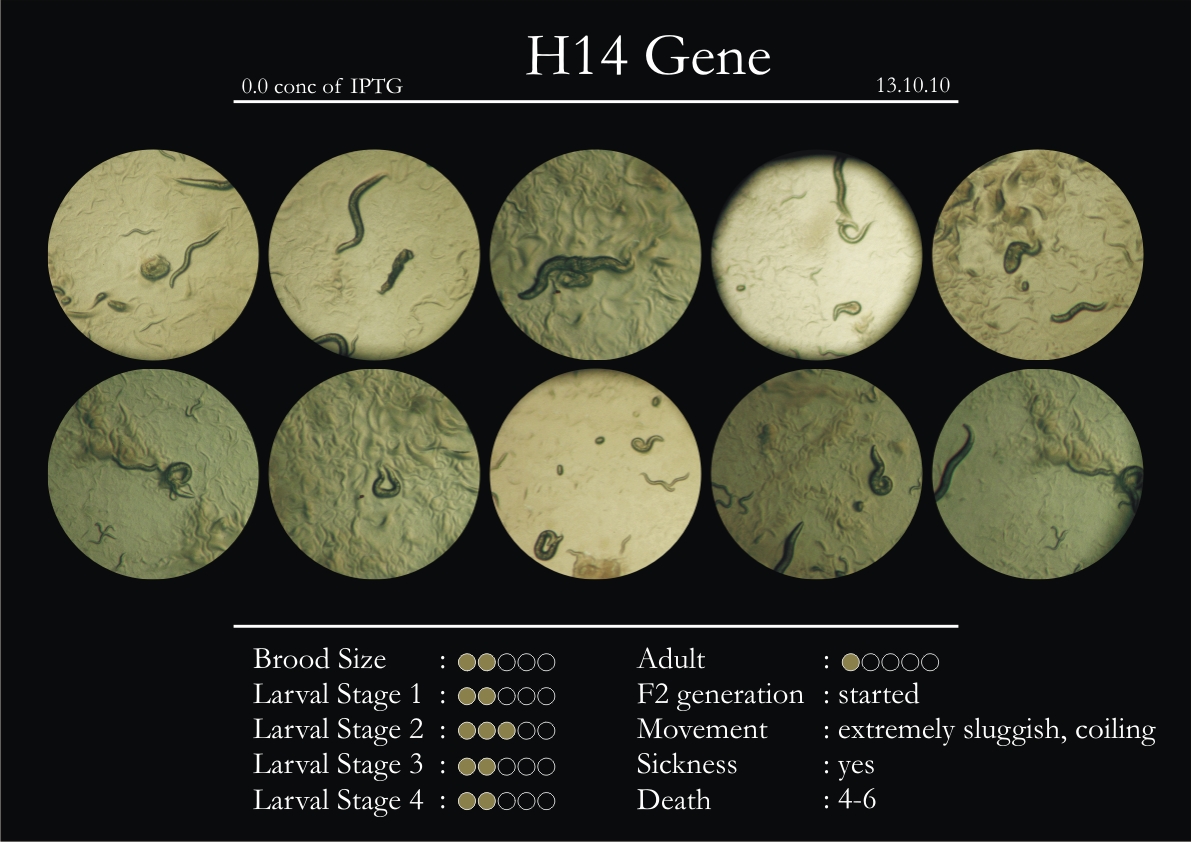
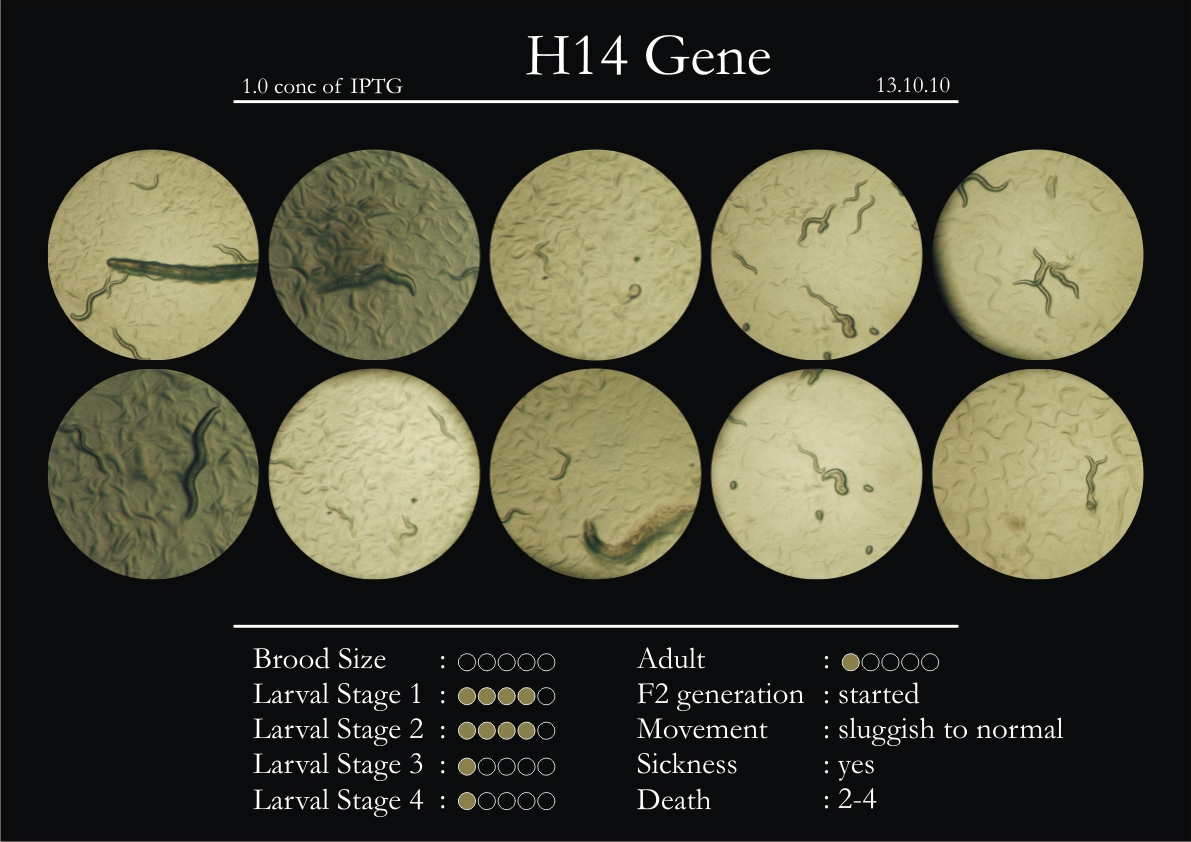
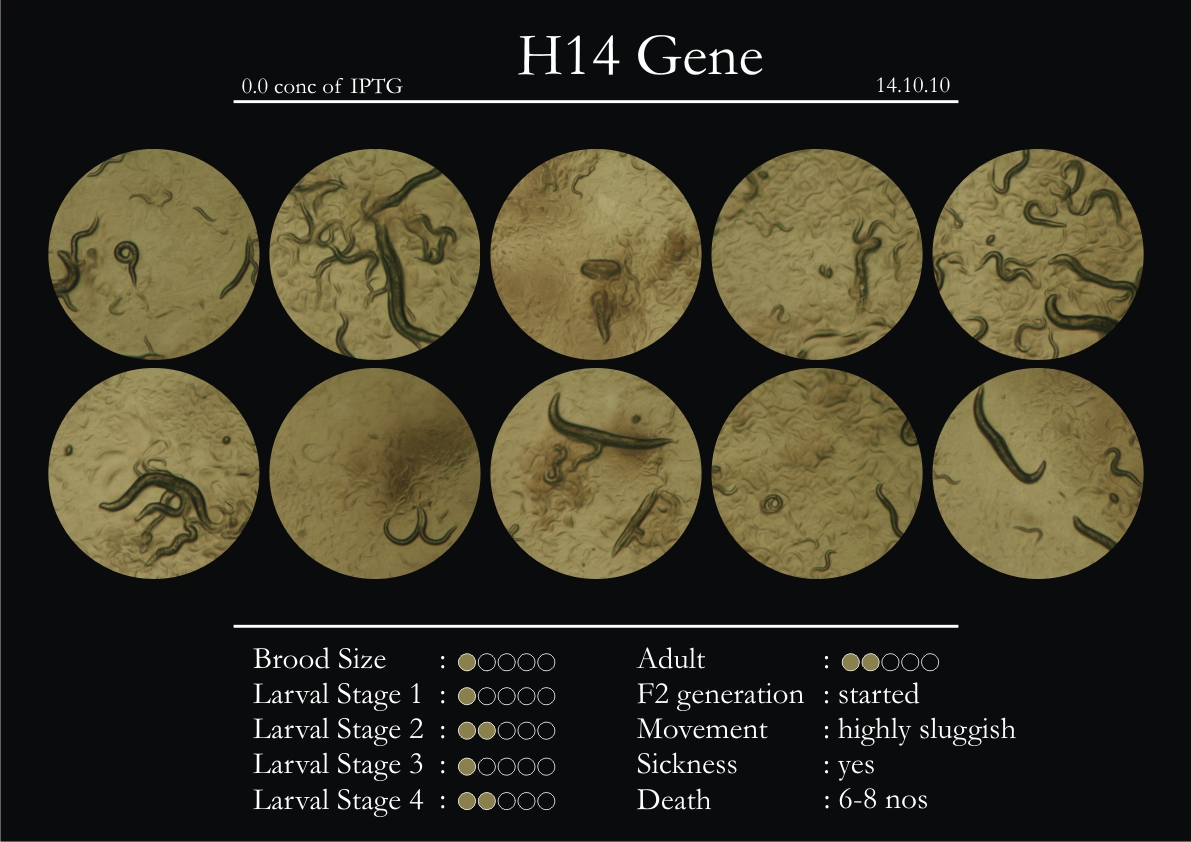
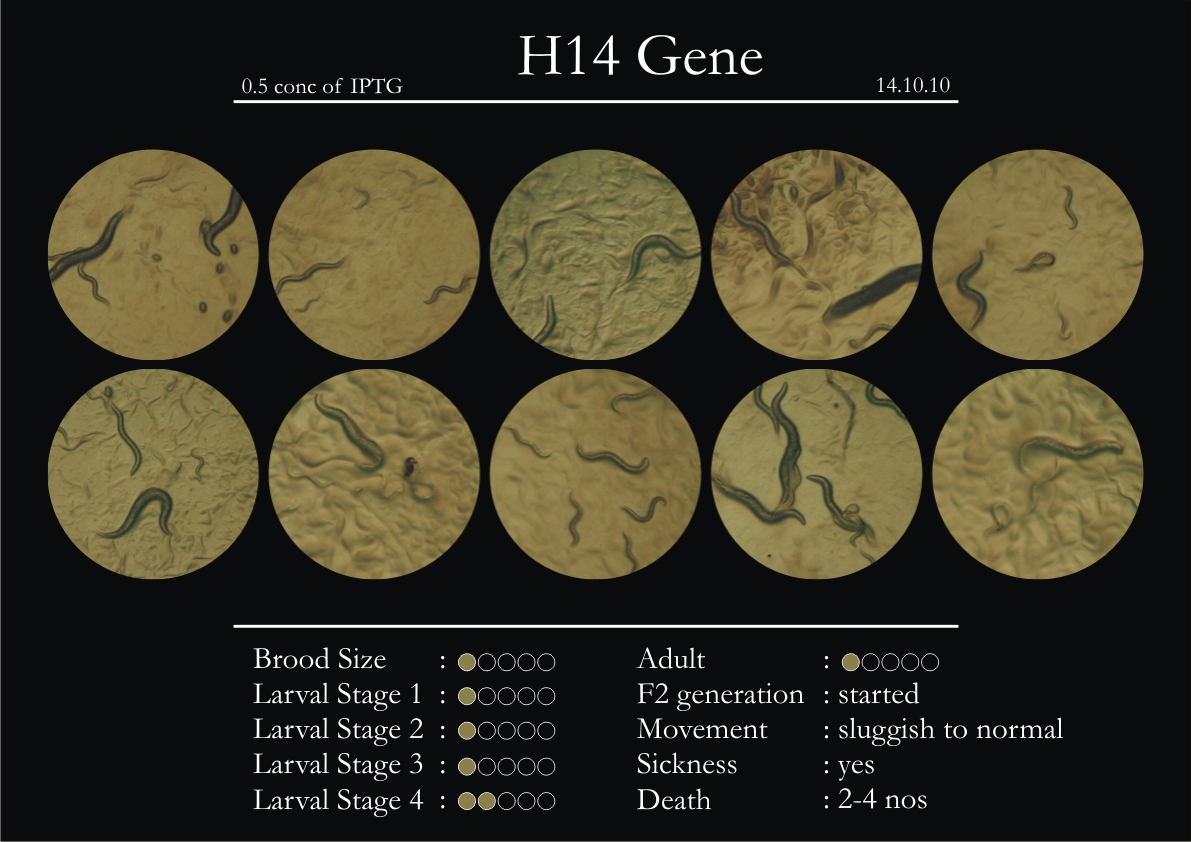
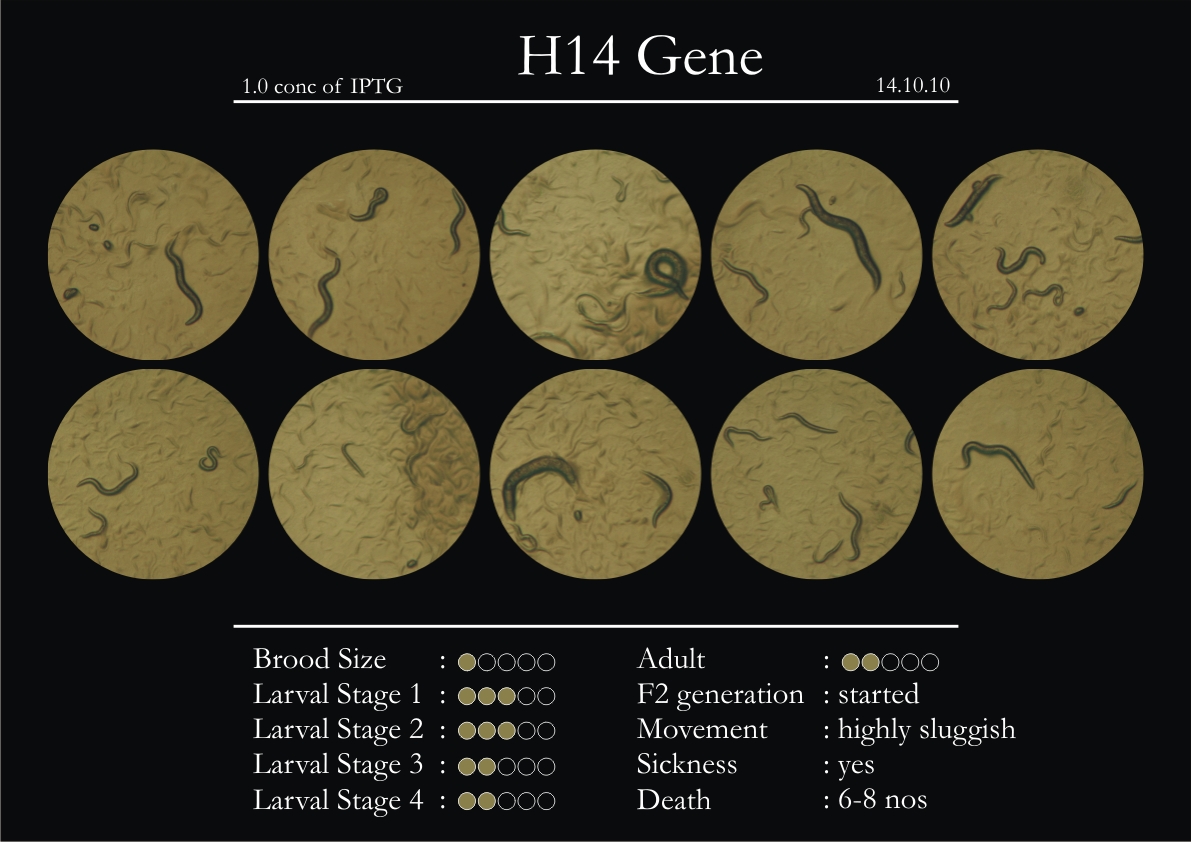
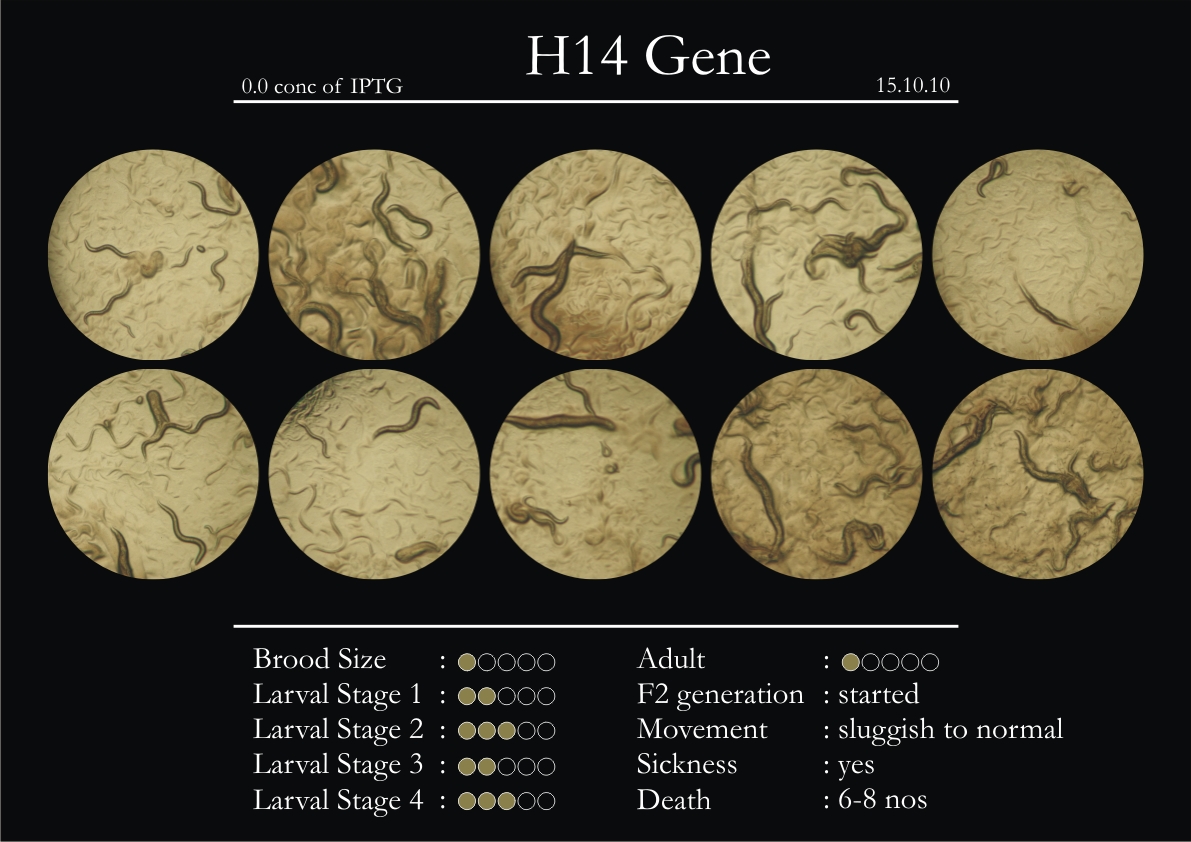
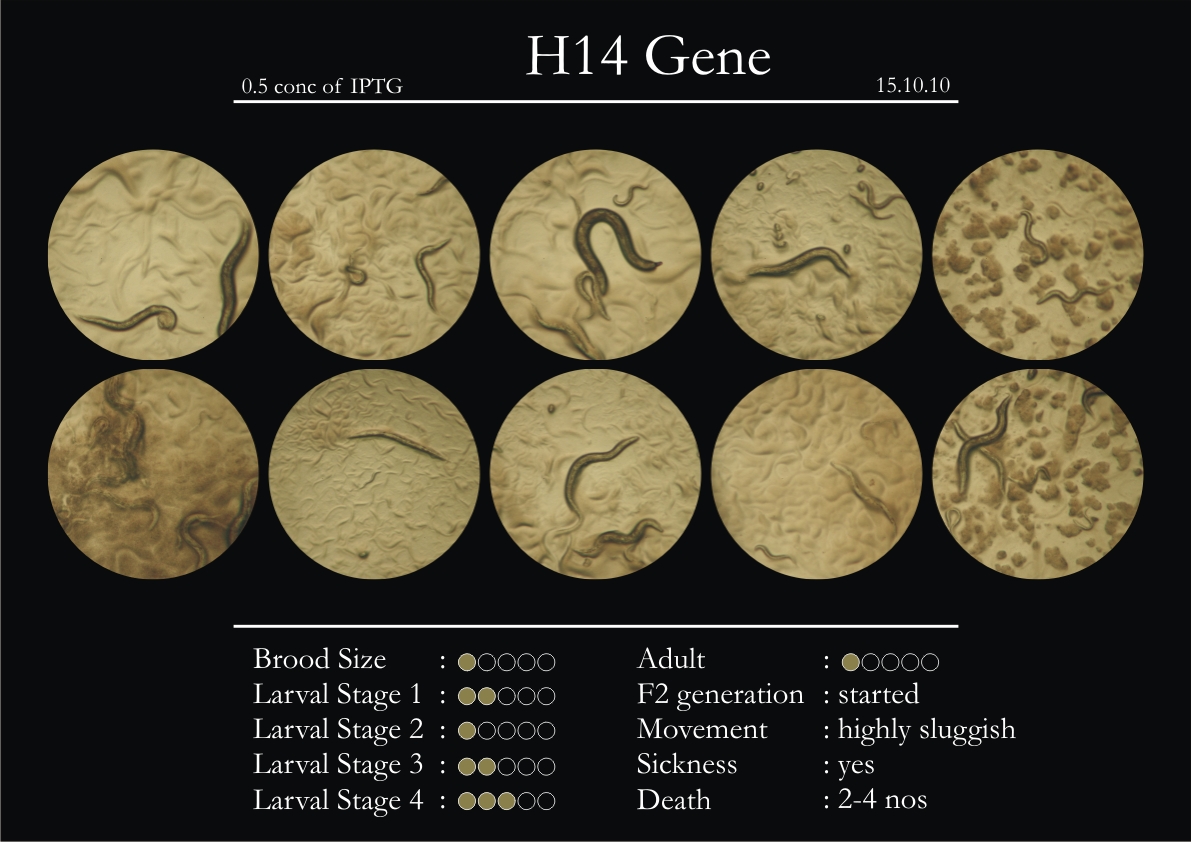
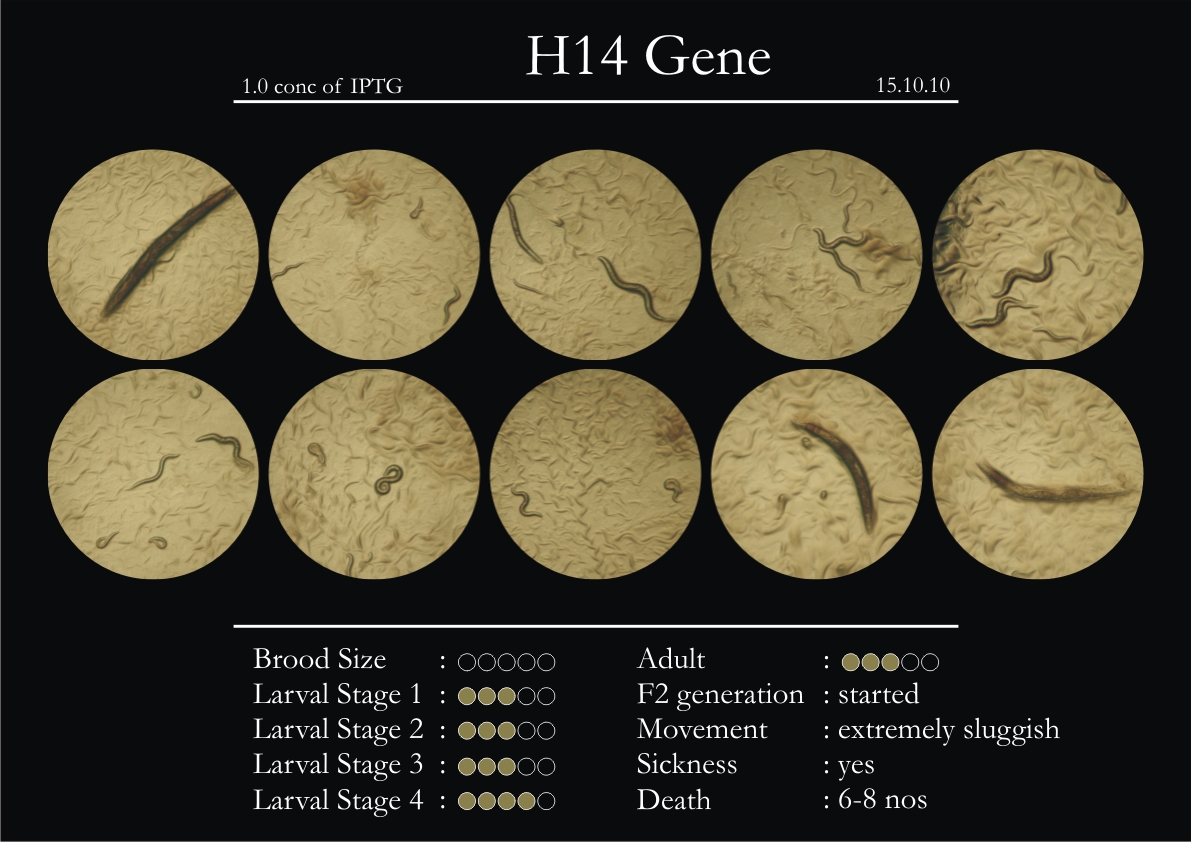
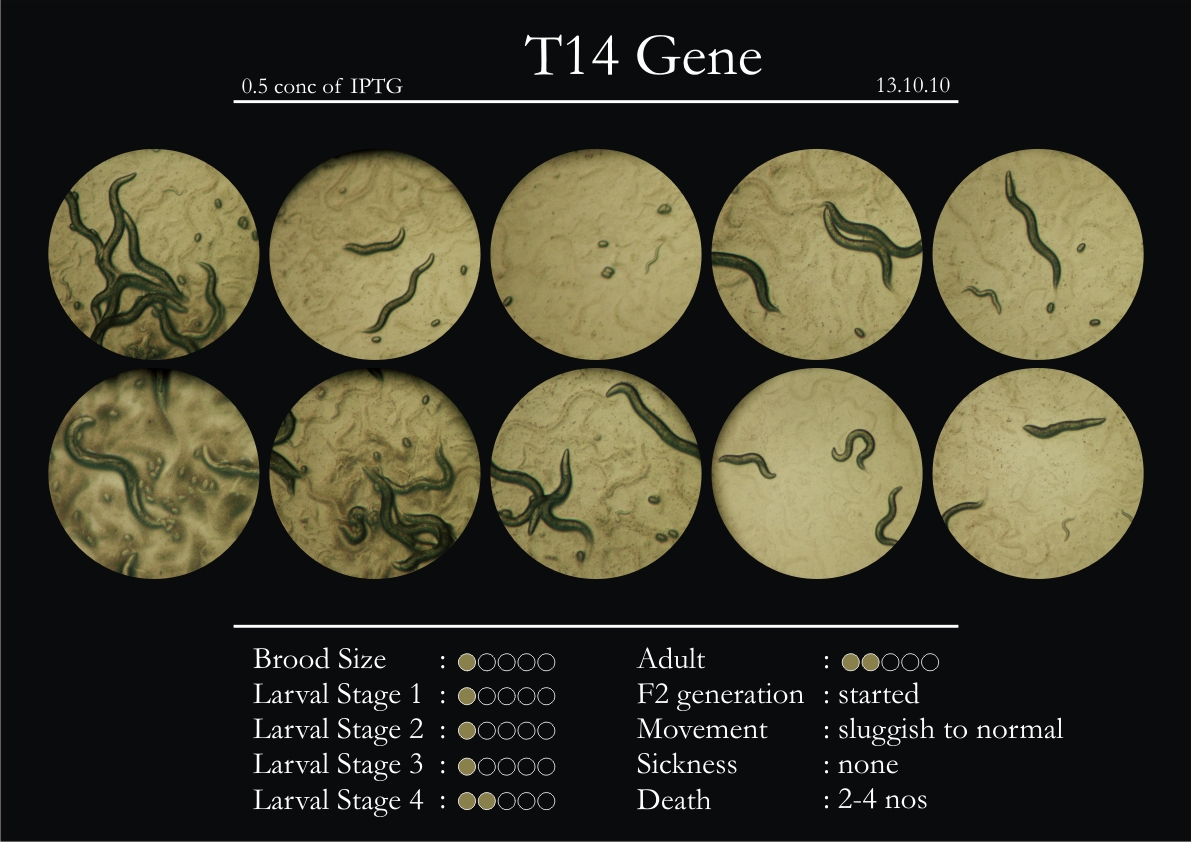
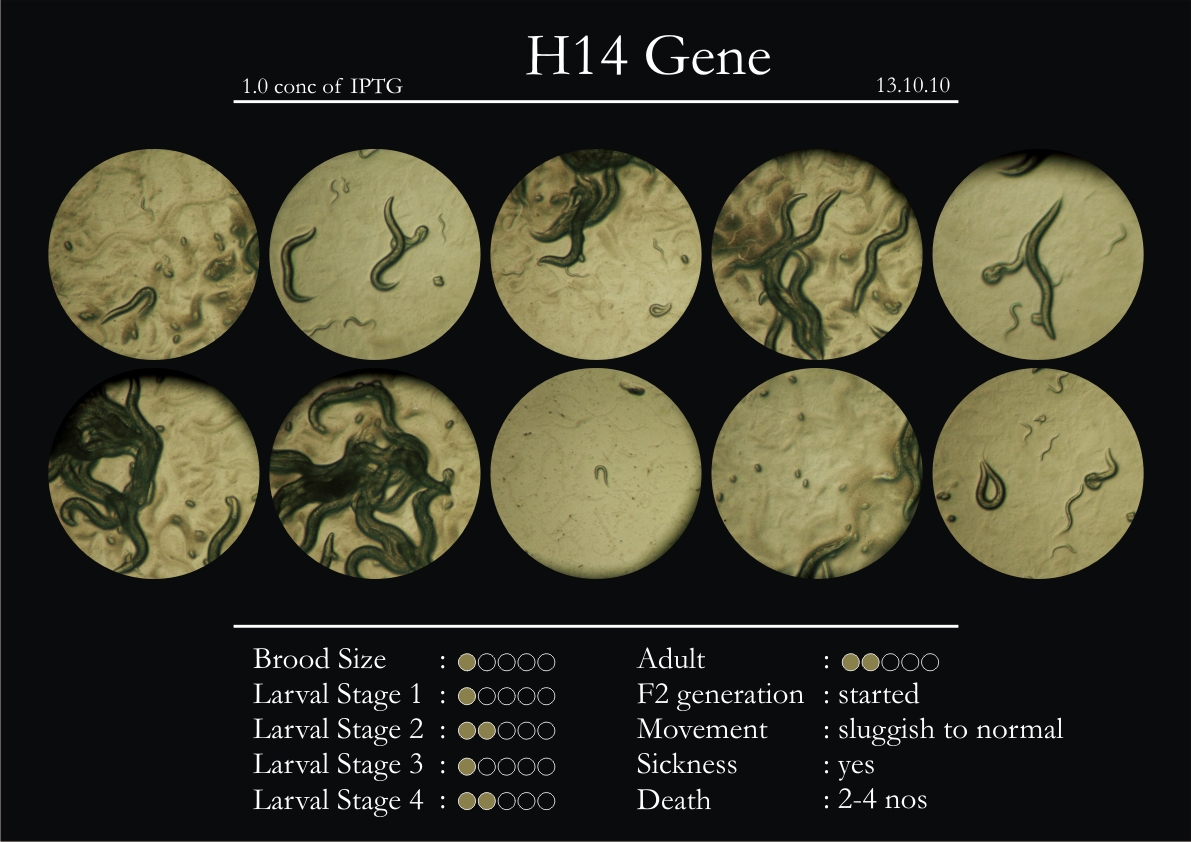
H14N18.1 Gene
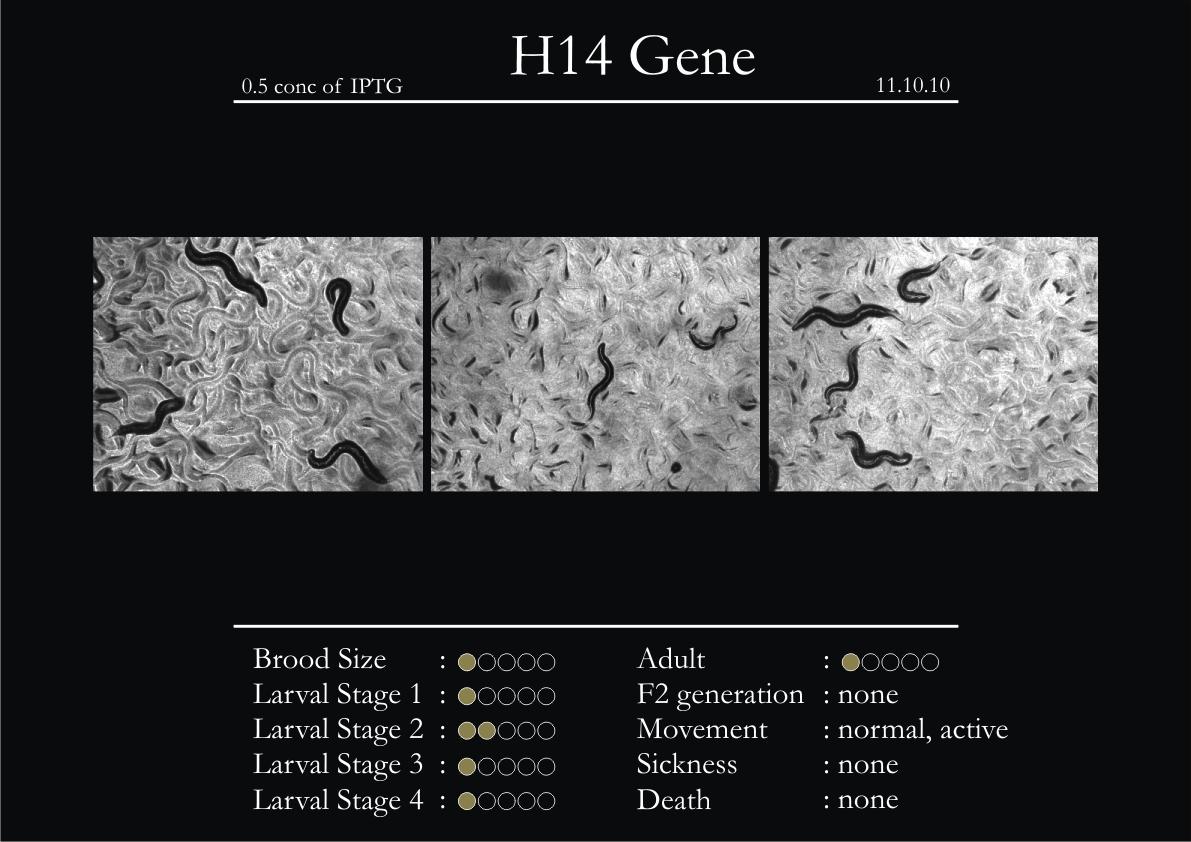
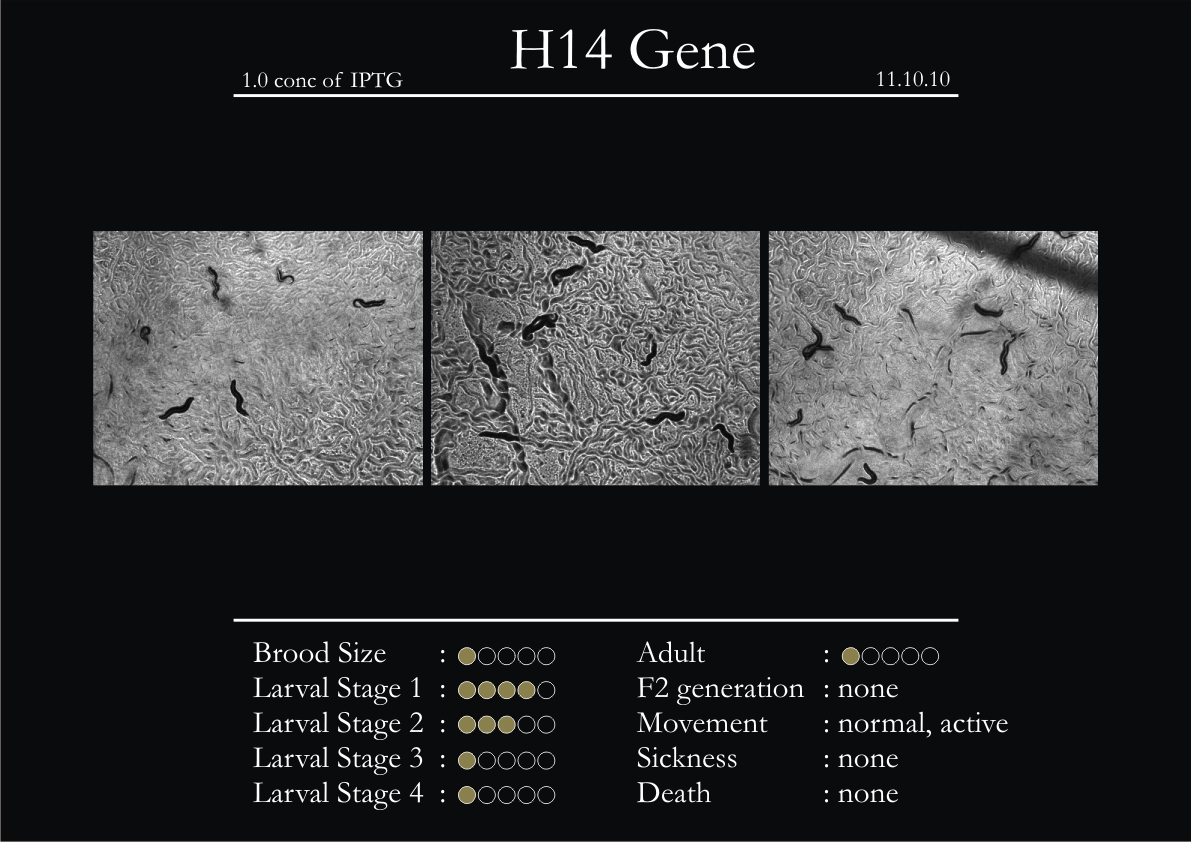
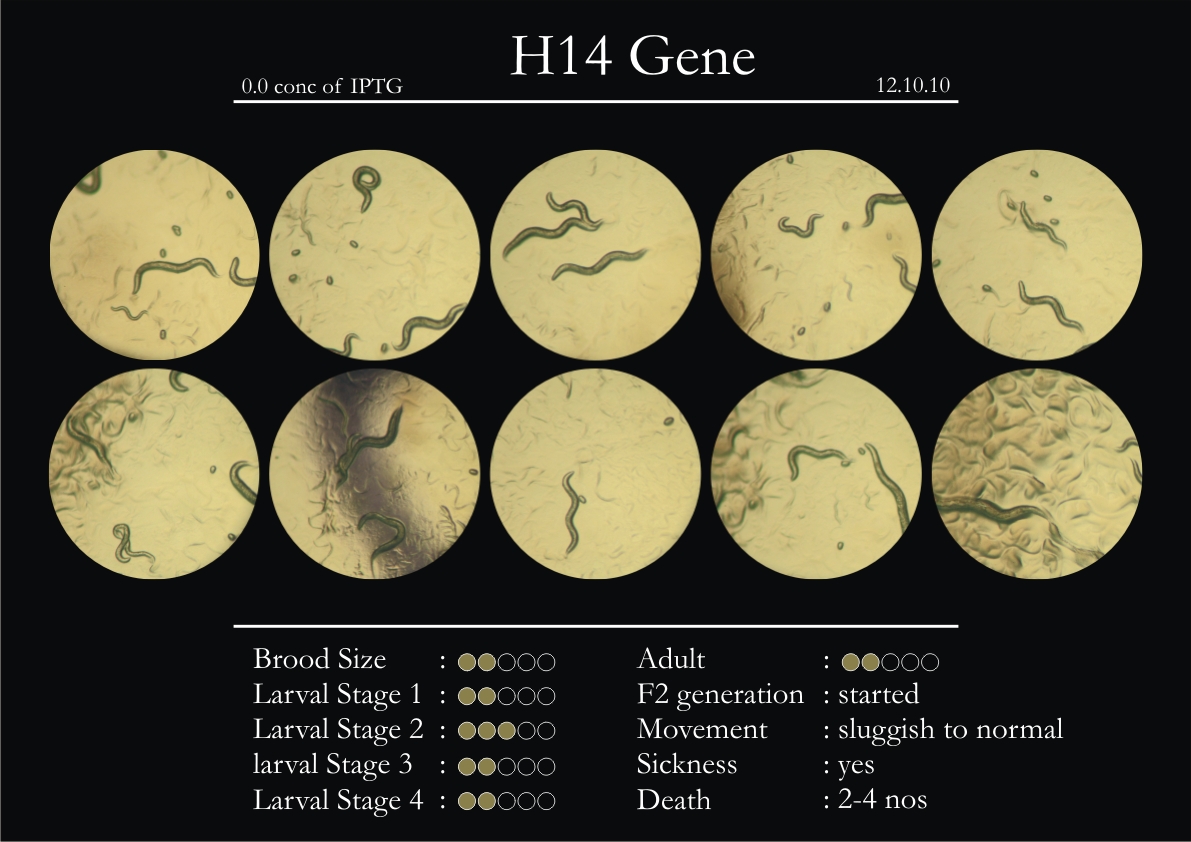
1. During the observation period, the vigorous movement became extremely sluggish and slow.
2. From the fourth day, slow, sluggish and uncertain movement became apparent.
3. Larval stages 1 and 2 expressed quick growth.
4. The introduced adults started to age by the third day and died by the fourth or fifth day.
5. Larval stages 3 & 4 were relatively slower than 1 & 2, with respect to movement and growth.
6. F2 generation (second generation) started by the third or fourth day.
7. Once the worms reached adulthood, the F2 generation started emerging immediately.
8. Worms started to die by the fifth day, due to sickness.
Phenotype Expression
1. There was normal movement until third day, followed by mixed results:
a. Reduction in speed of movement
b. Confusion in path: The worms started to show confused motion, with respect to direction; in the interim they usually stayed around the same place and did not move around the plate.
c. Uncertain movement: The worms showed a distinctive pattern of movement whereby it first used its head to dodge around looking for a path before it made a move.
d. External stimulation: Only Larval stages 1 & 2 responded by increasing their speed of movement; larval stages 3 & 4 remained sluggish and did not move around.
2. Coiling: phenotype of coiling was expressed only in short-lived trace amounts.
3. F2 Generation (second generation) started between the third and fourth day.
4. Larval stages 1 & 2 belonging to the F2 generation showed normal motion.
5. Larval stage 3, 4 and adults expressed the above mentioned phenotypes.
Daily Observations
9th October 2010
10th October 2010
11th October 2010
12th October 2010
13th October 2010
14th October 2010
15th October 2010
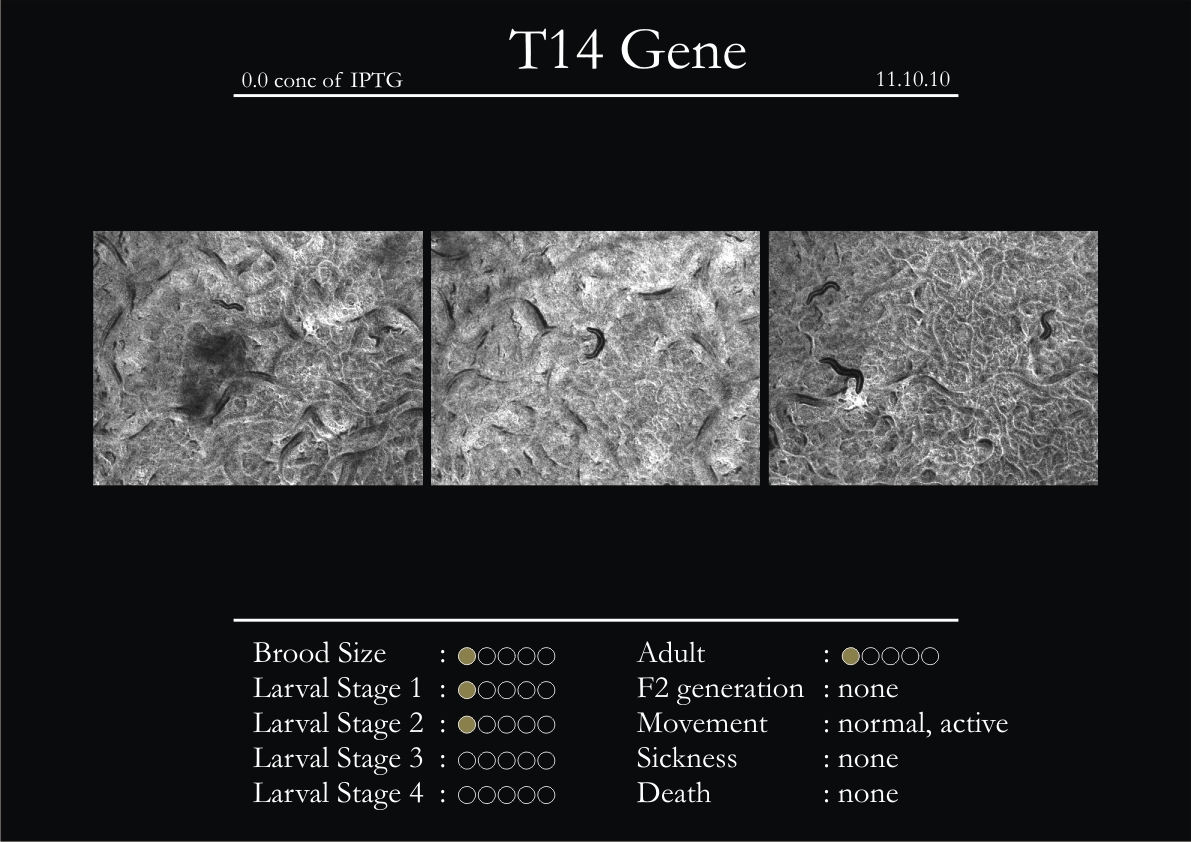
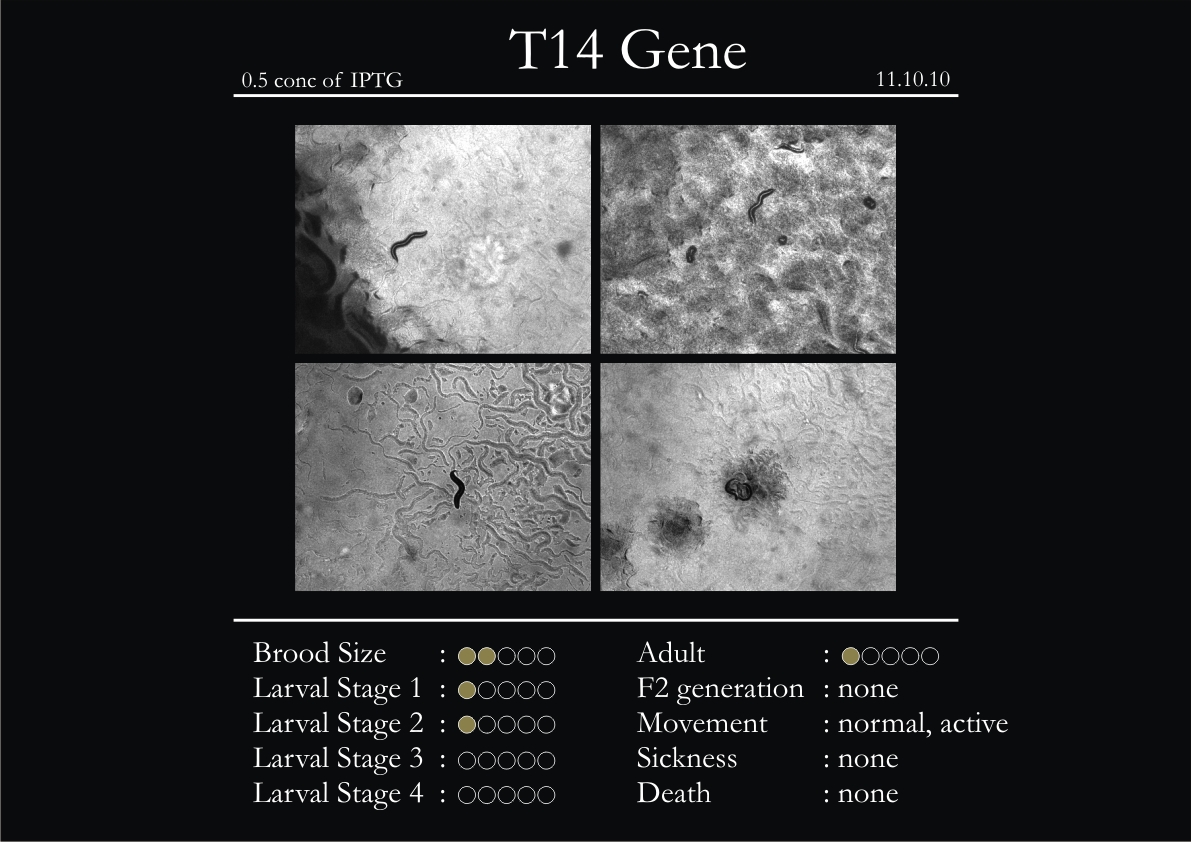
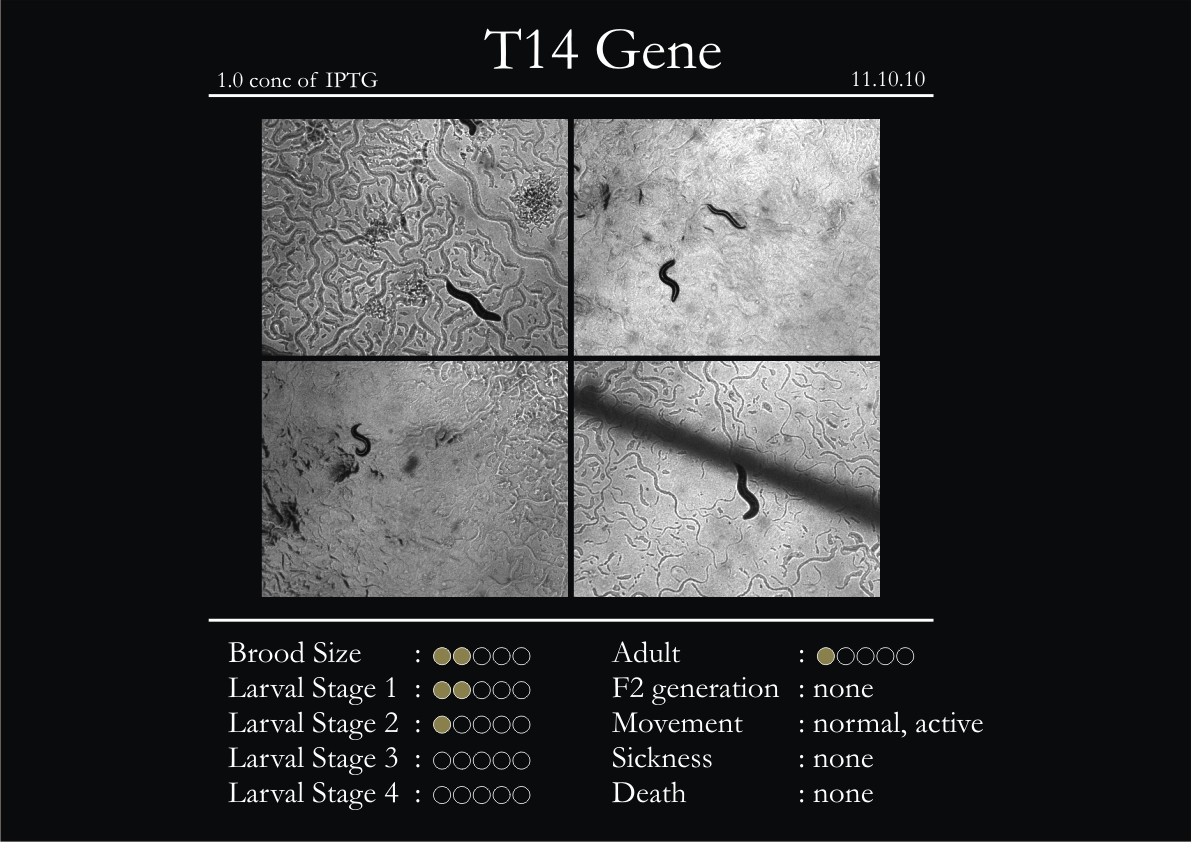
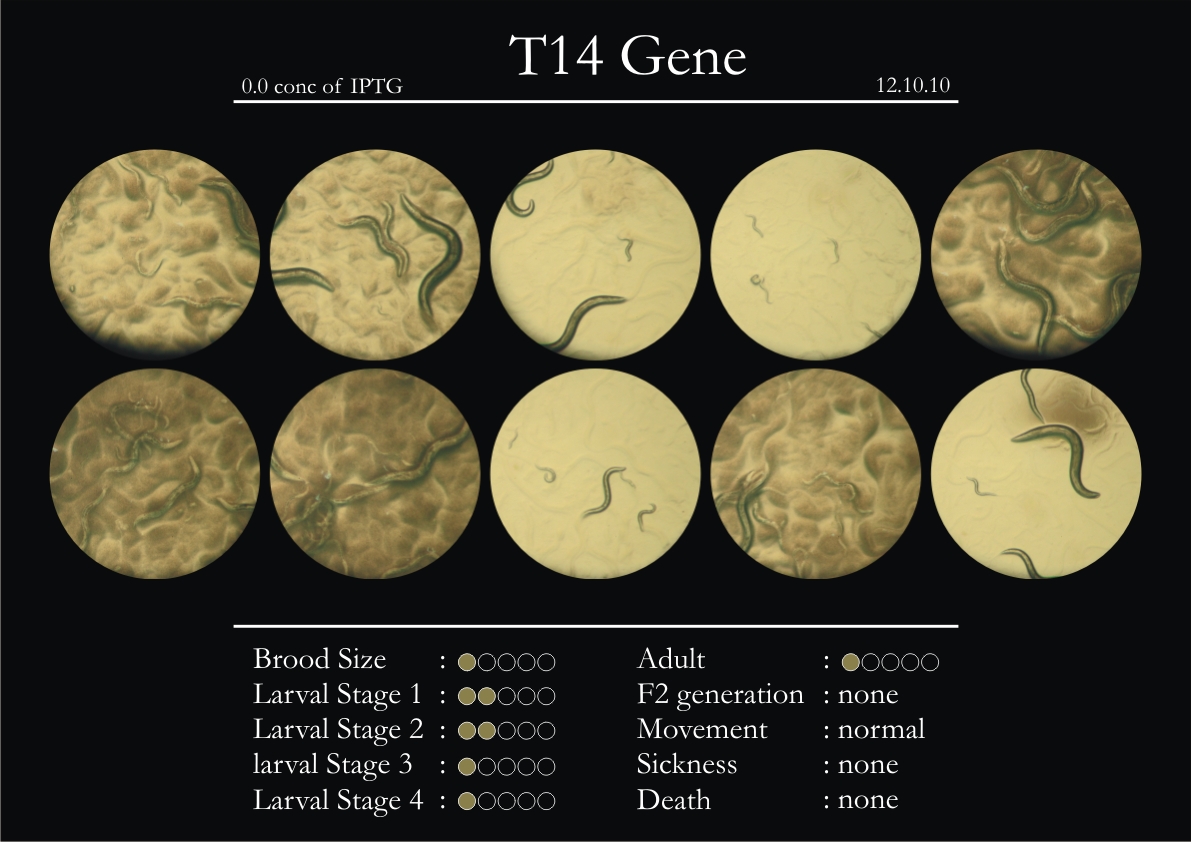
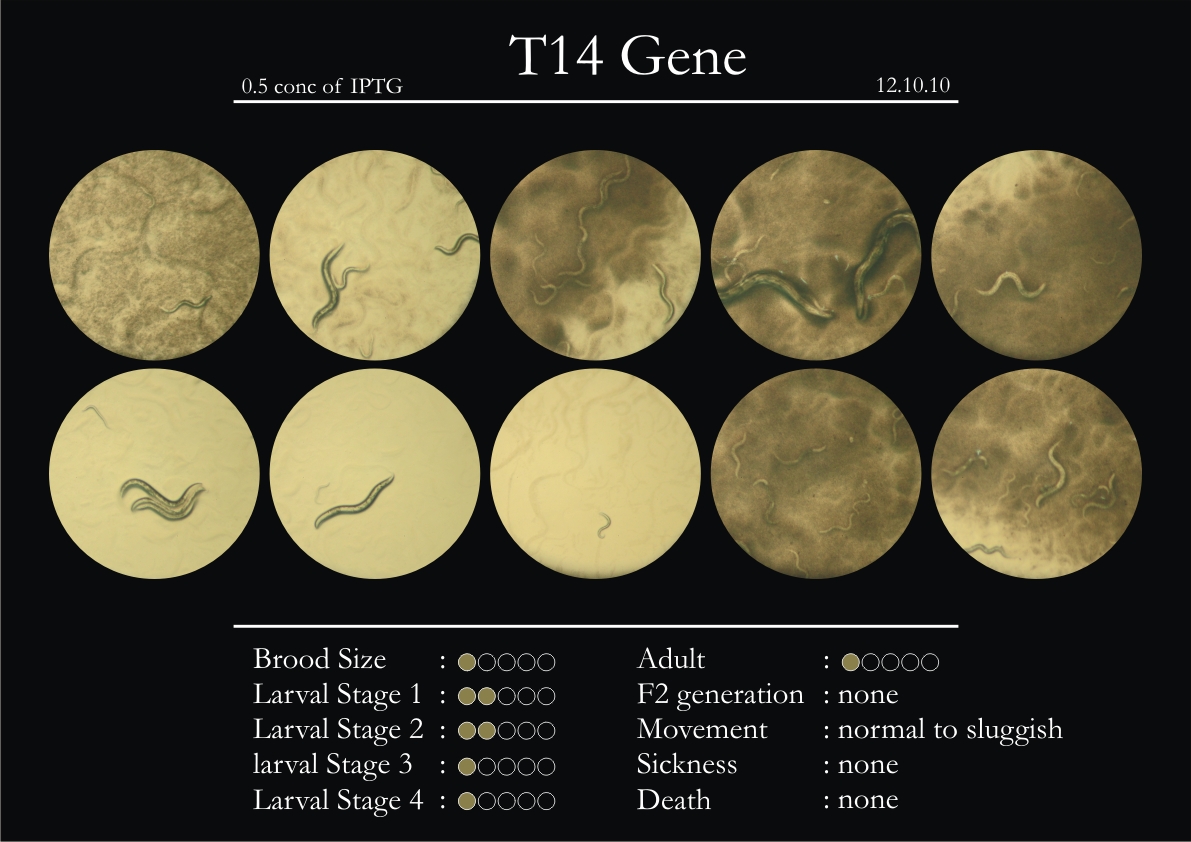
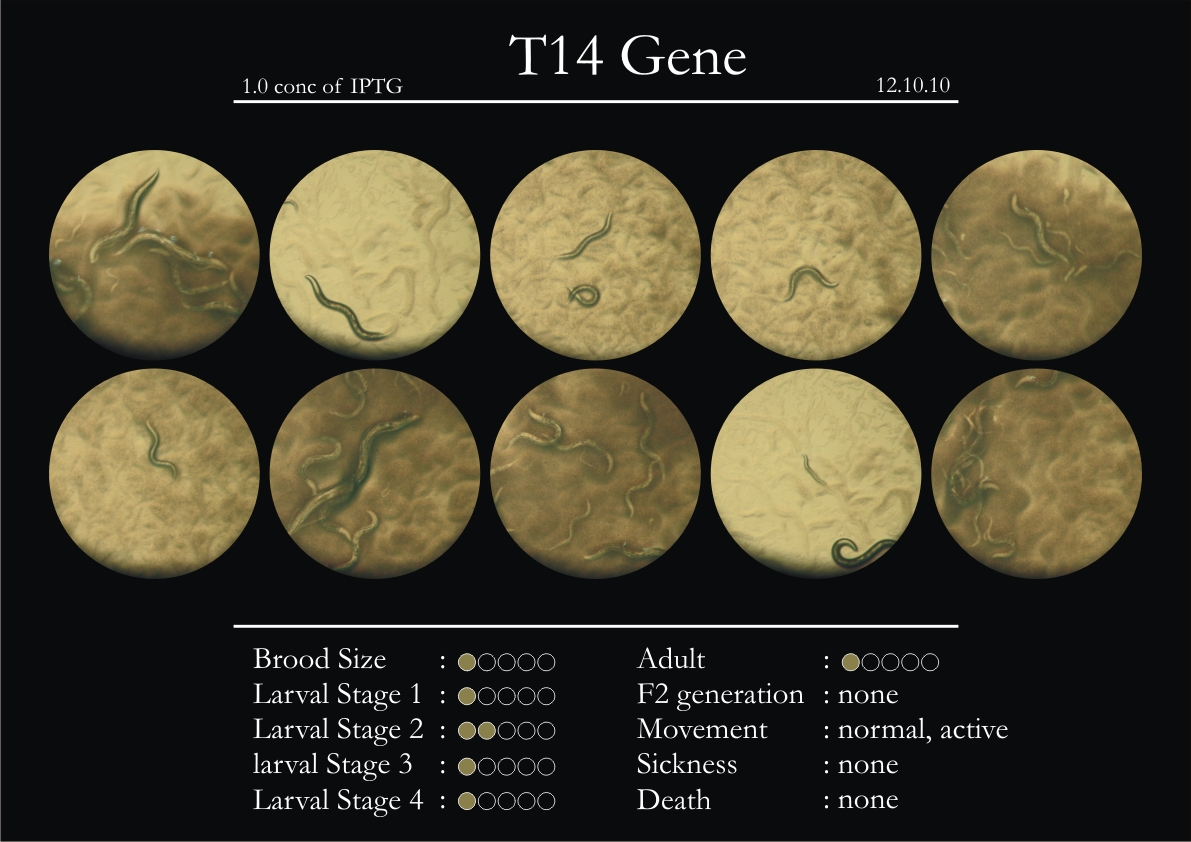
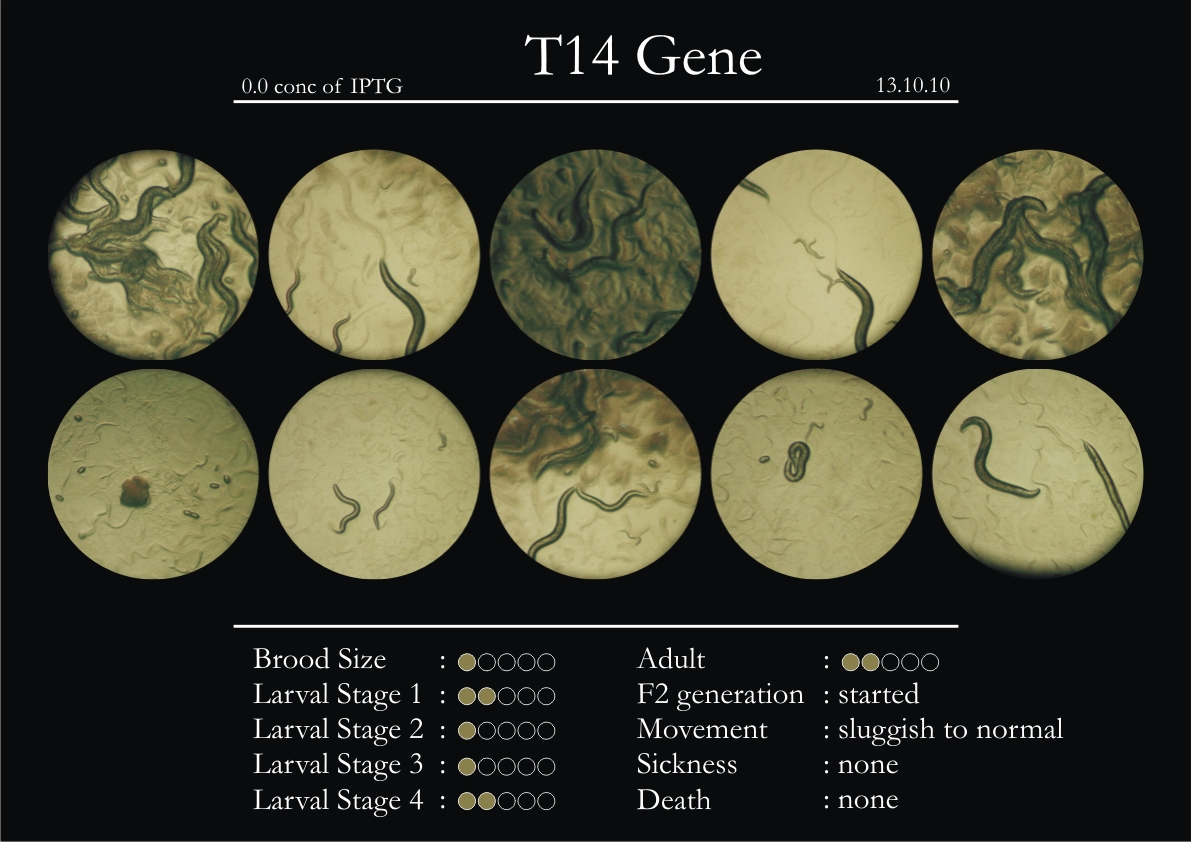
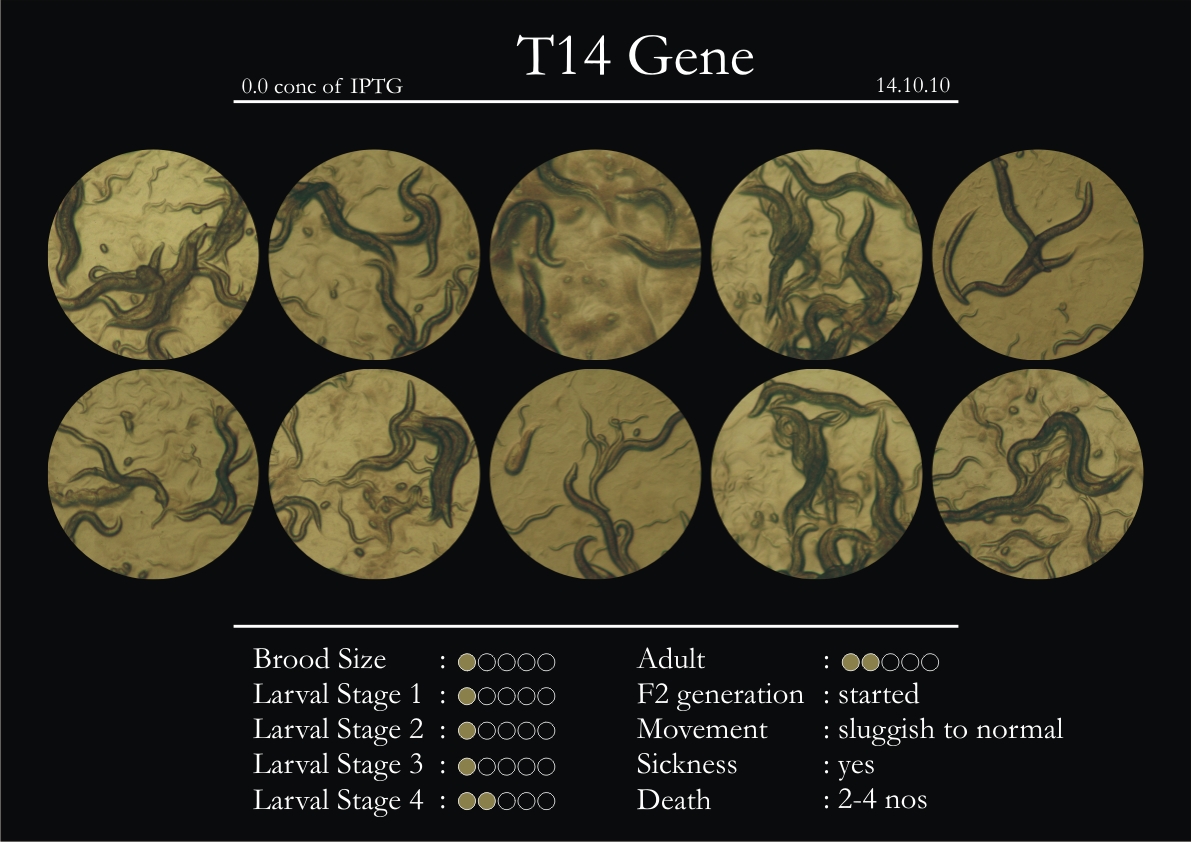
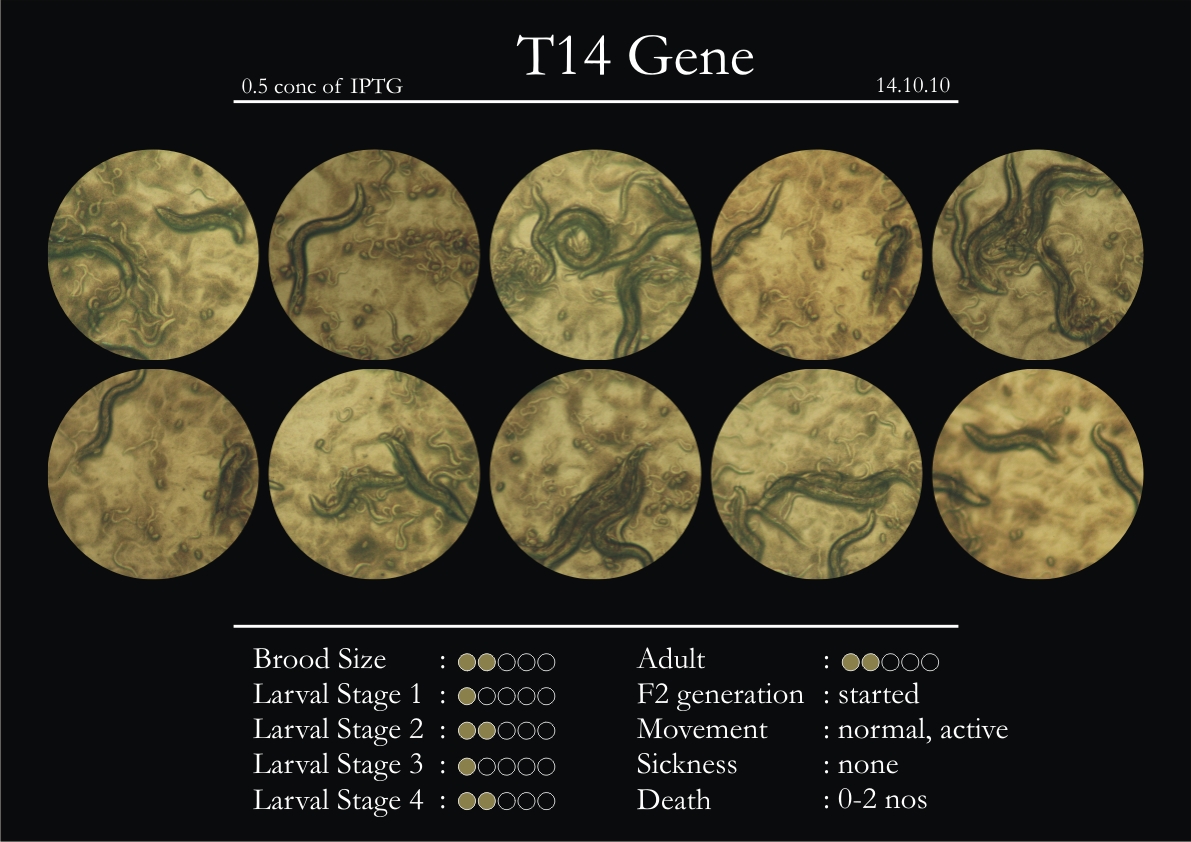
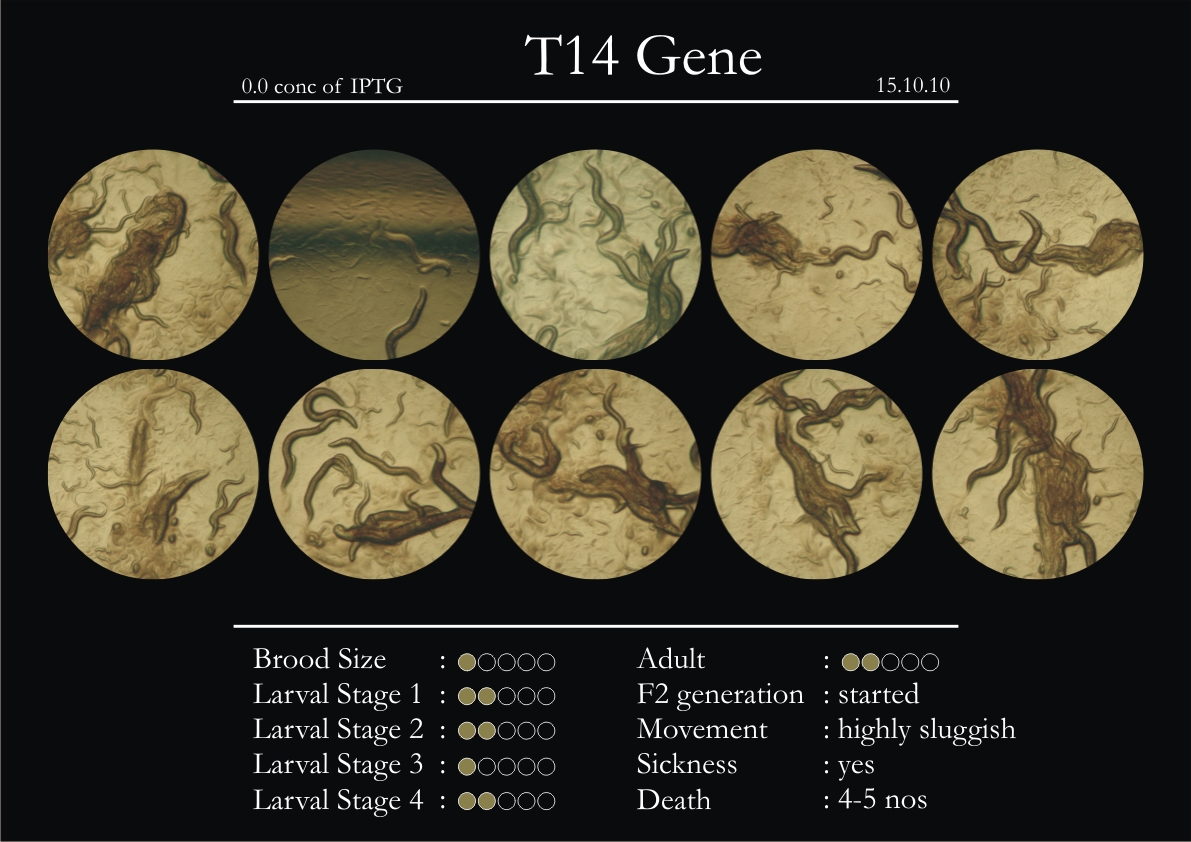
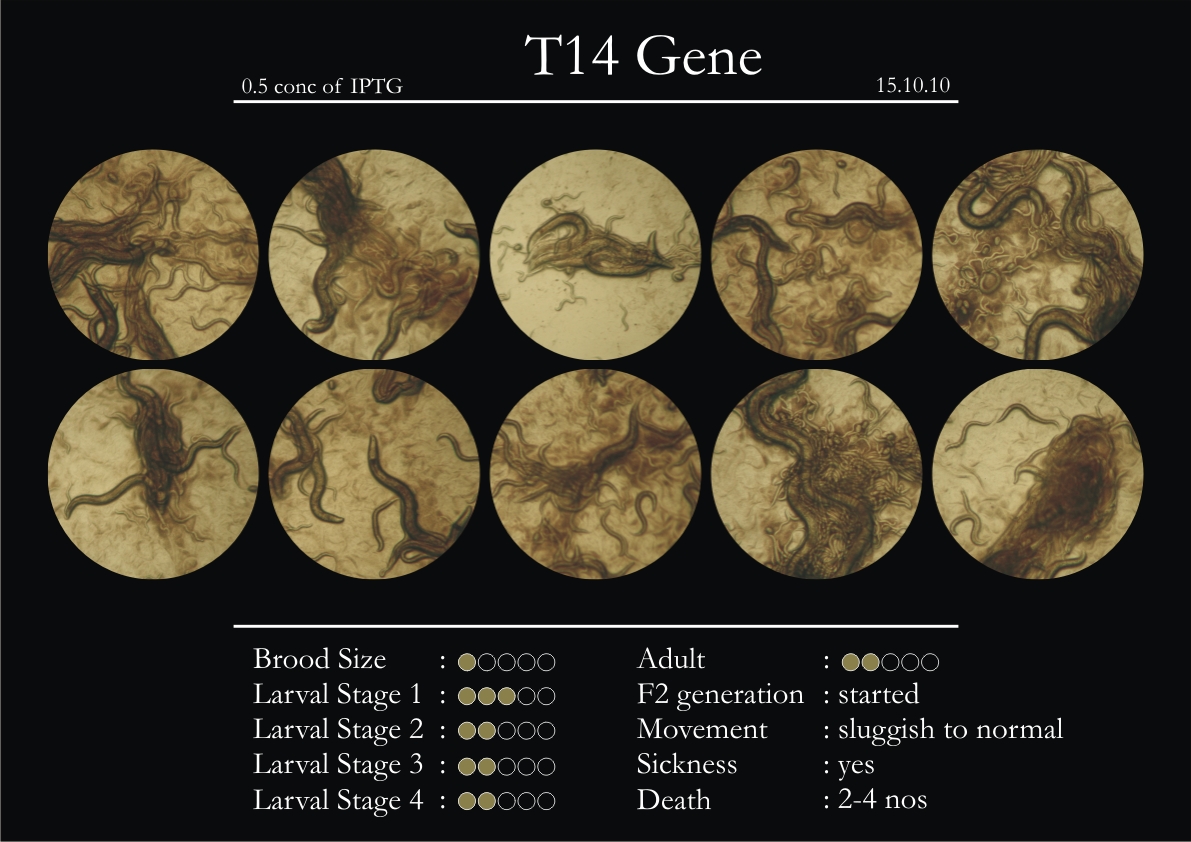
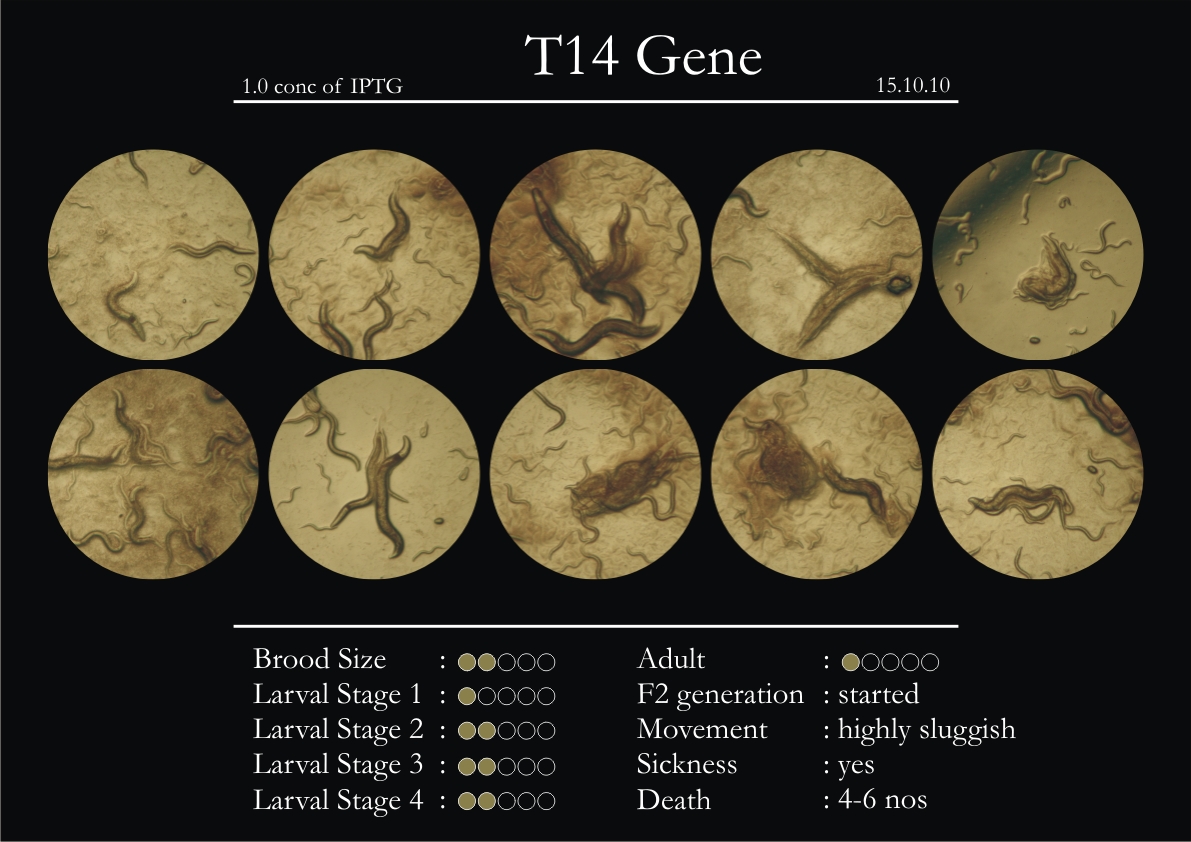
T14F9.1 Gene
1. During the observation period, normal movement became slow and sluggish.
2. Overall growth at all larval stages was steady.
3. The worms experienced quick growth and active movement.
4. The introduced adults started to die on the second day.
5. Number of deaths started increasing from the third day.
6. Once the worms reached adulthood, the F2 generation started emerging immediately.
7. The worms began to die by the fourth day, due to sickness.
8. RNAi started to take effect by the fourth day in the 2nd, 3rd & 4th larval stages.
Phenotype Expression
1. Relative movement slowed down from the third day.
2. Dark patterns started to appear on the body of the worm.
3. Large number of deaths was observed in L3’s and L4’s.
4. There were distinct changes (increase) in the overall mass of the animal.
5. The worms experienced severe inflammation of intestinal or middle sections of the body.
6. Distinct types of adults called ‘Dumpies’ showed phenotypes of short stubby inflamed, physical retardation. These were extremely sluggish and very sick.
7. Blisters were observed on the last day only in the 4th larval stage and adults. The blisters were very few in number (up to 2 per worm).
8. On external stimulation response was not prominent.
9. F2 generation (second generation) started on the third day. Phenotype expression was prominent, starting from larval stages 2 & 3.
Daily Observations
11th October 2010
12th October 2010
13th October 2010
14th October 2010
15th October 2010
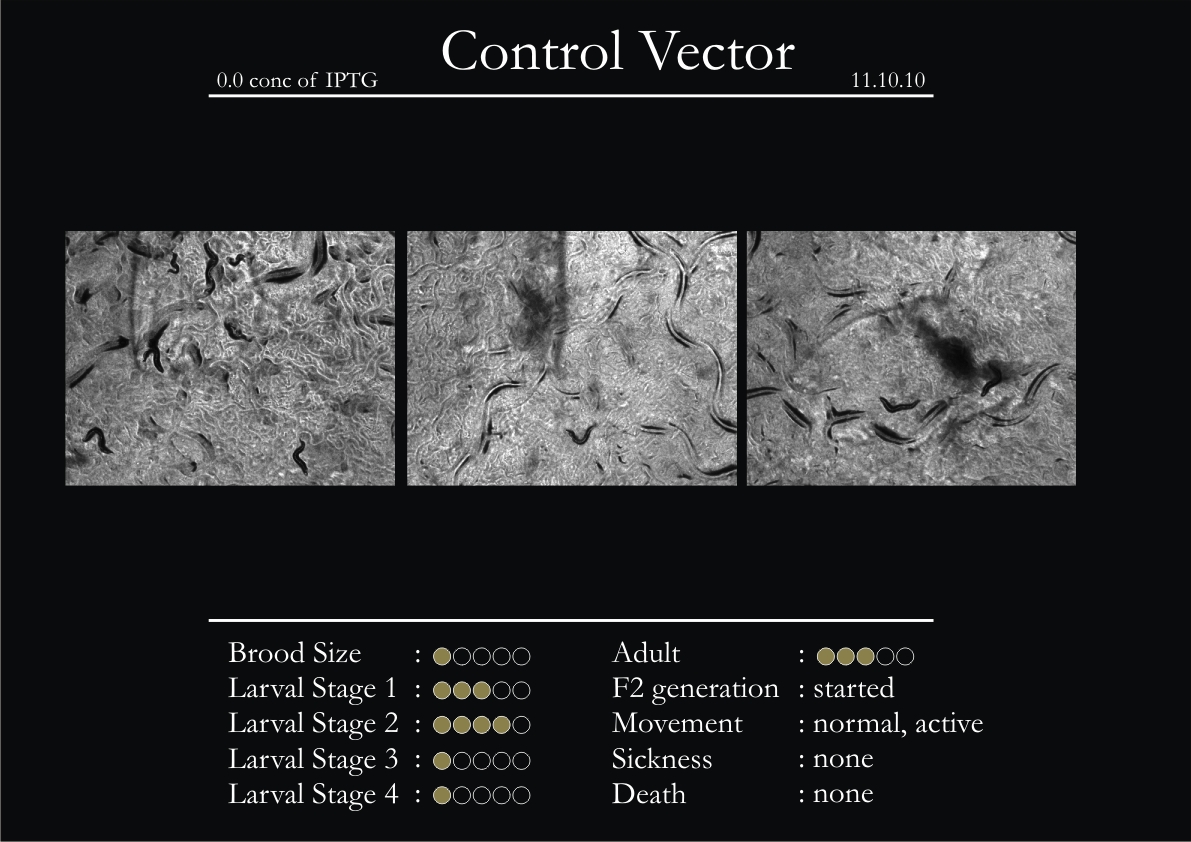
Control Vector
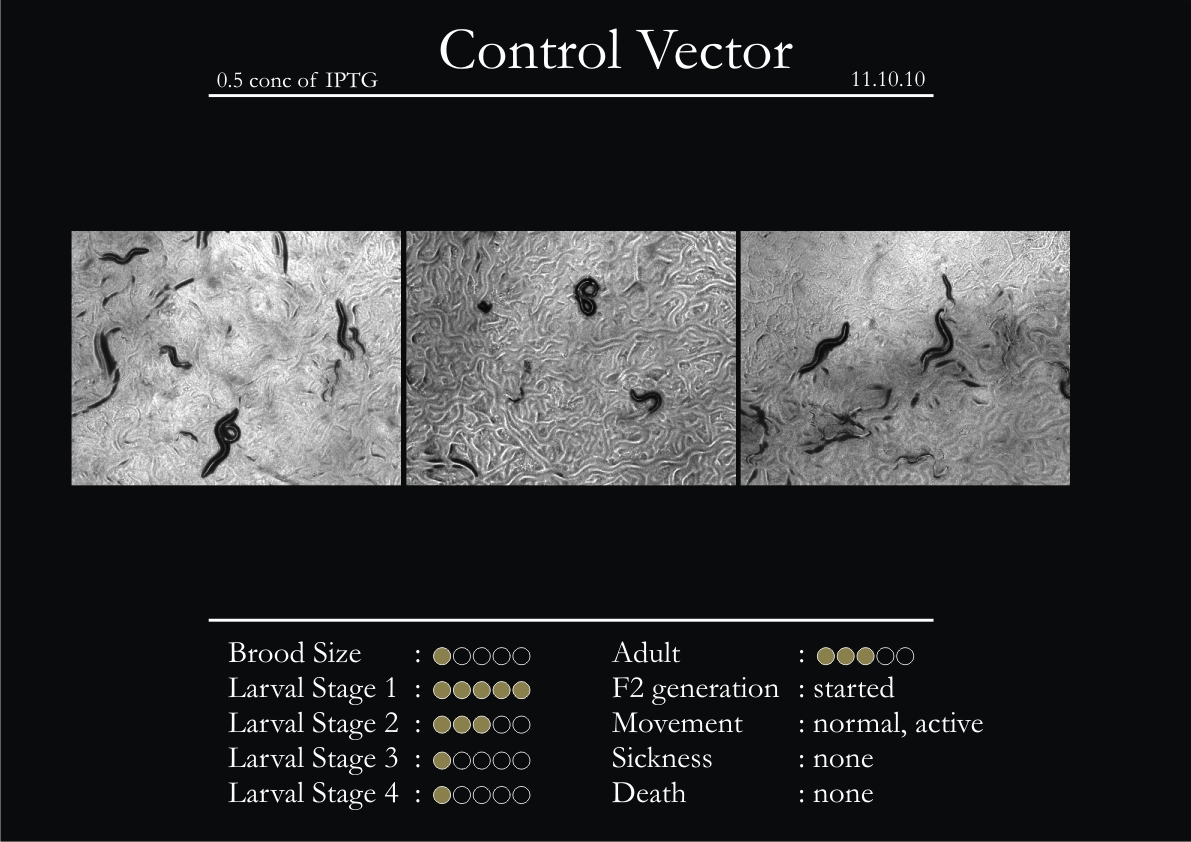
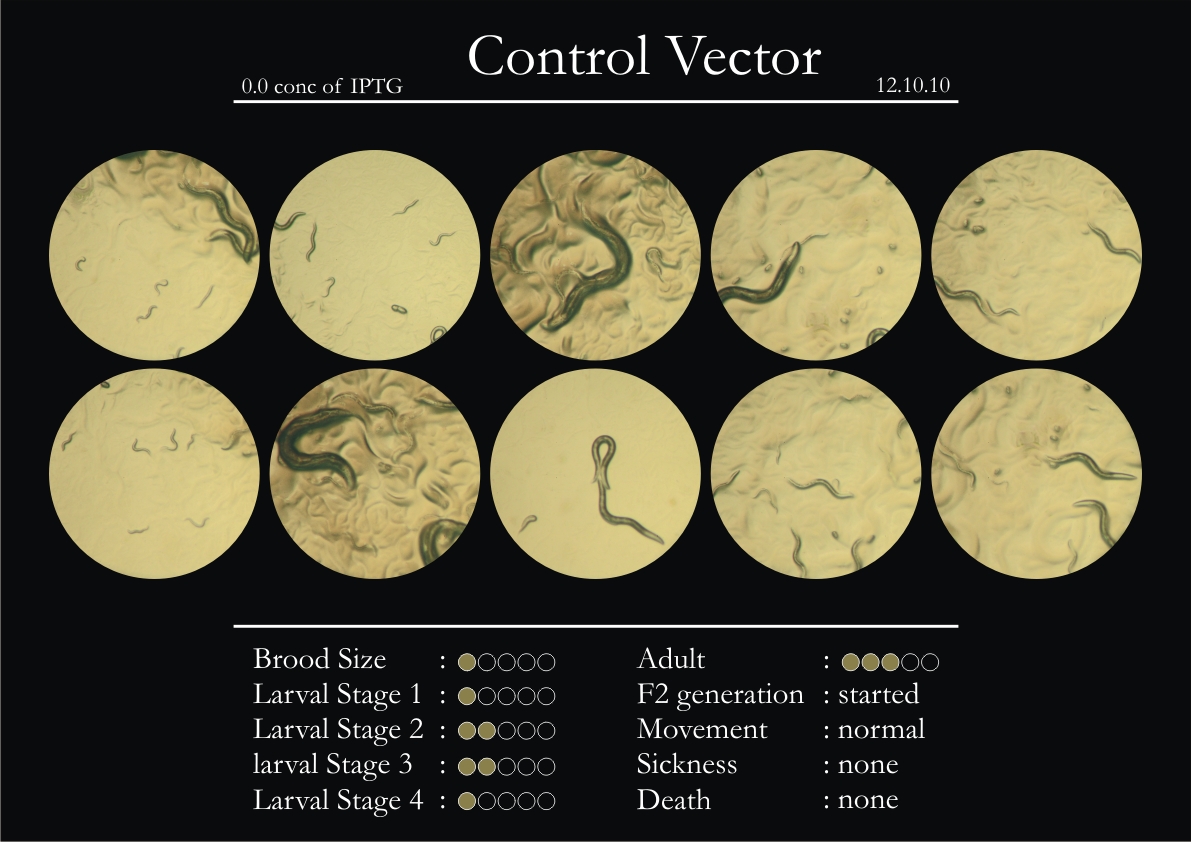
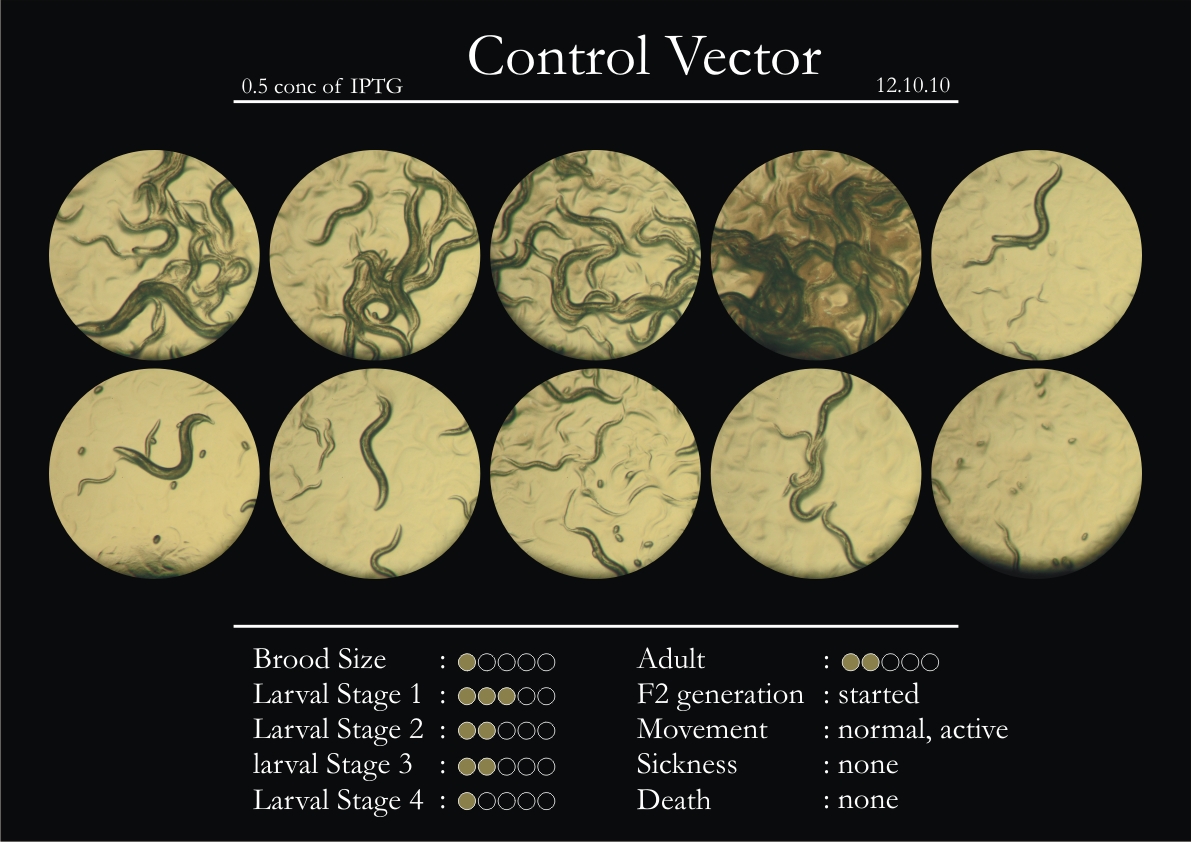
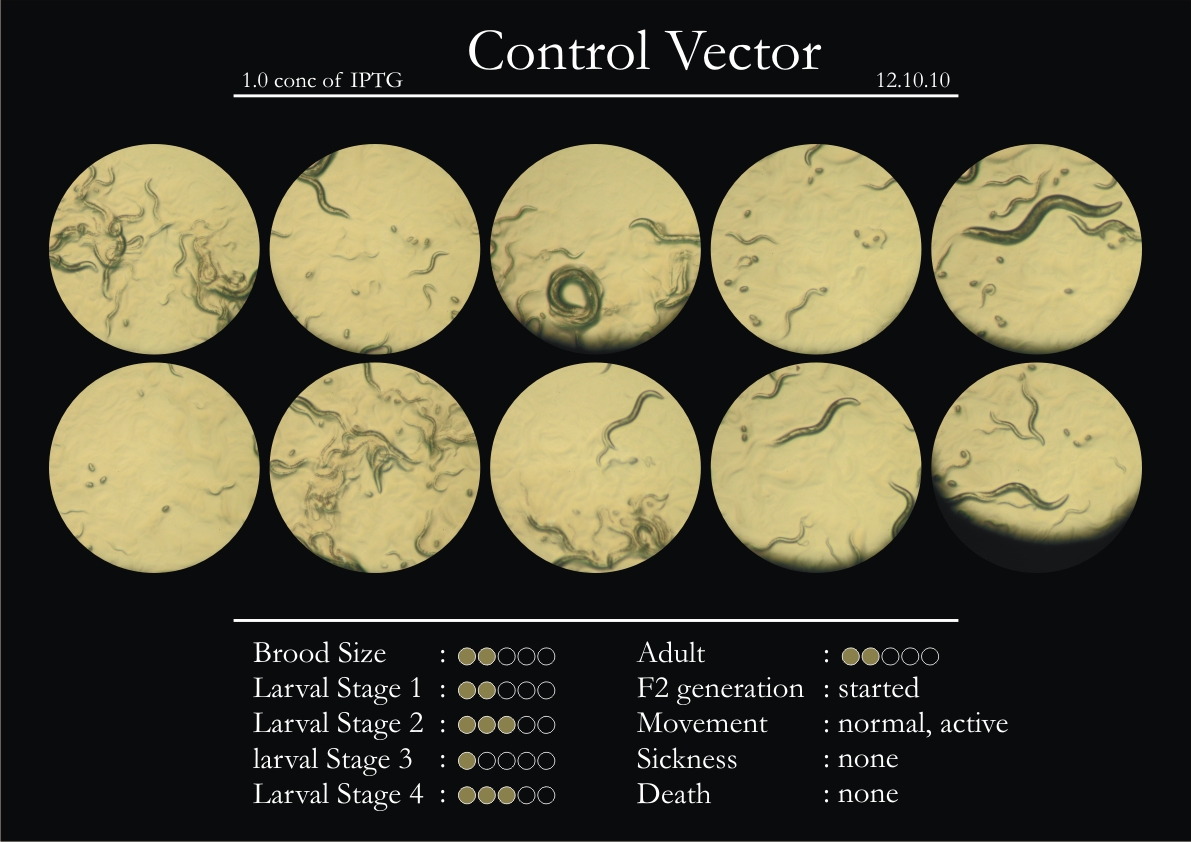
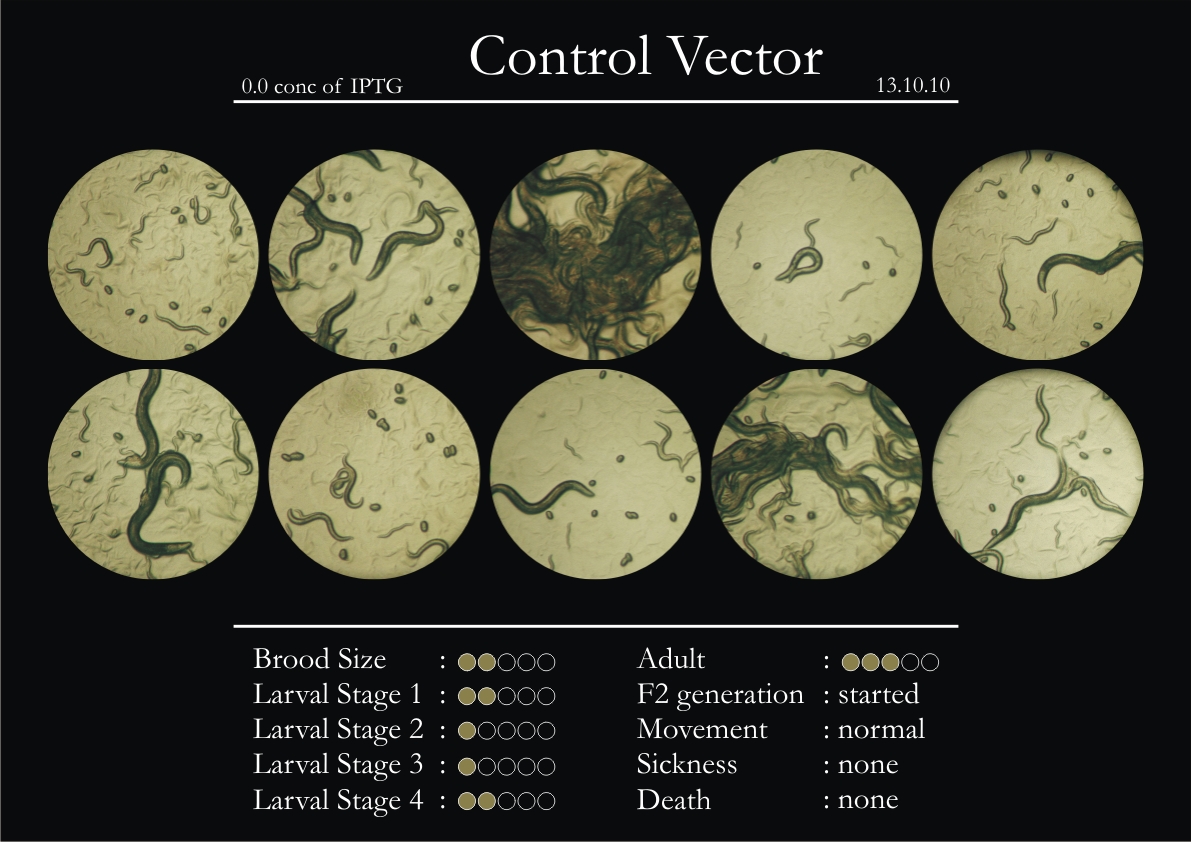
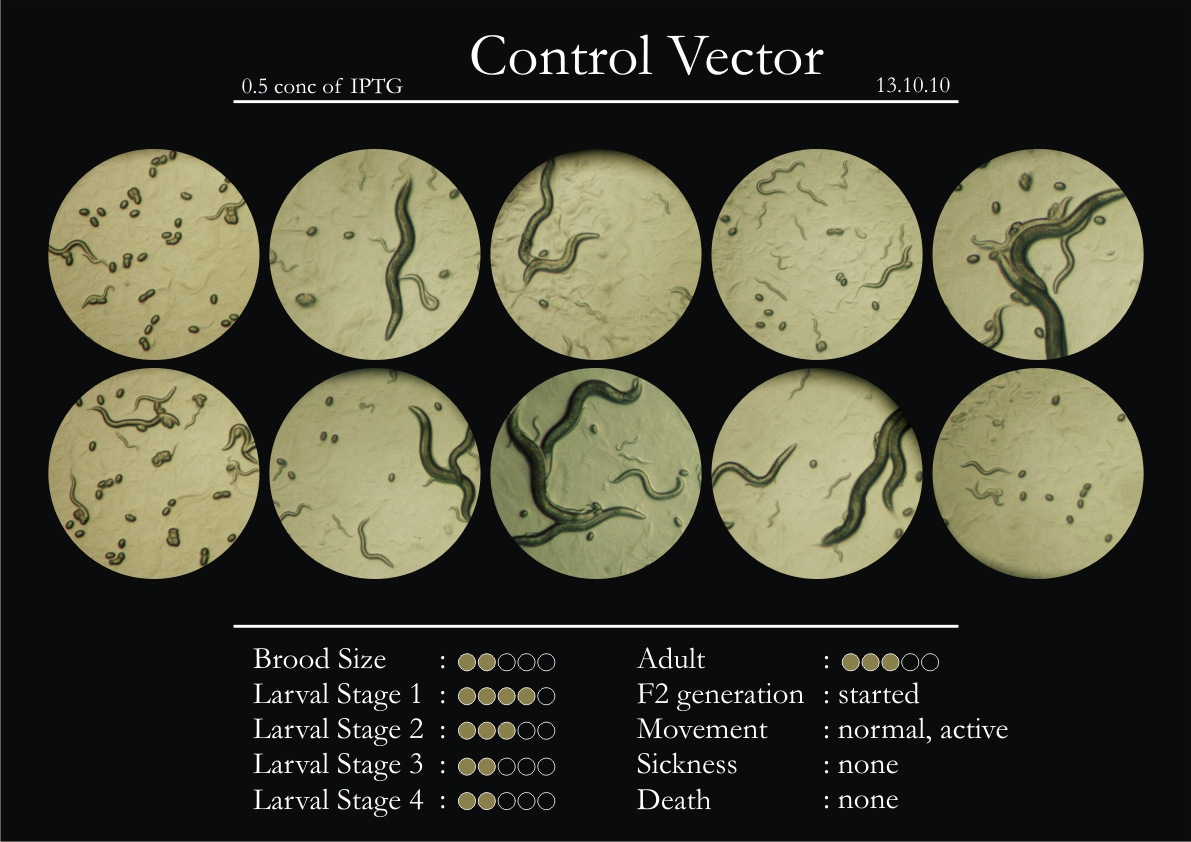
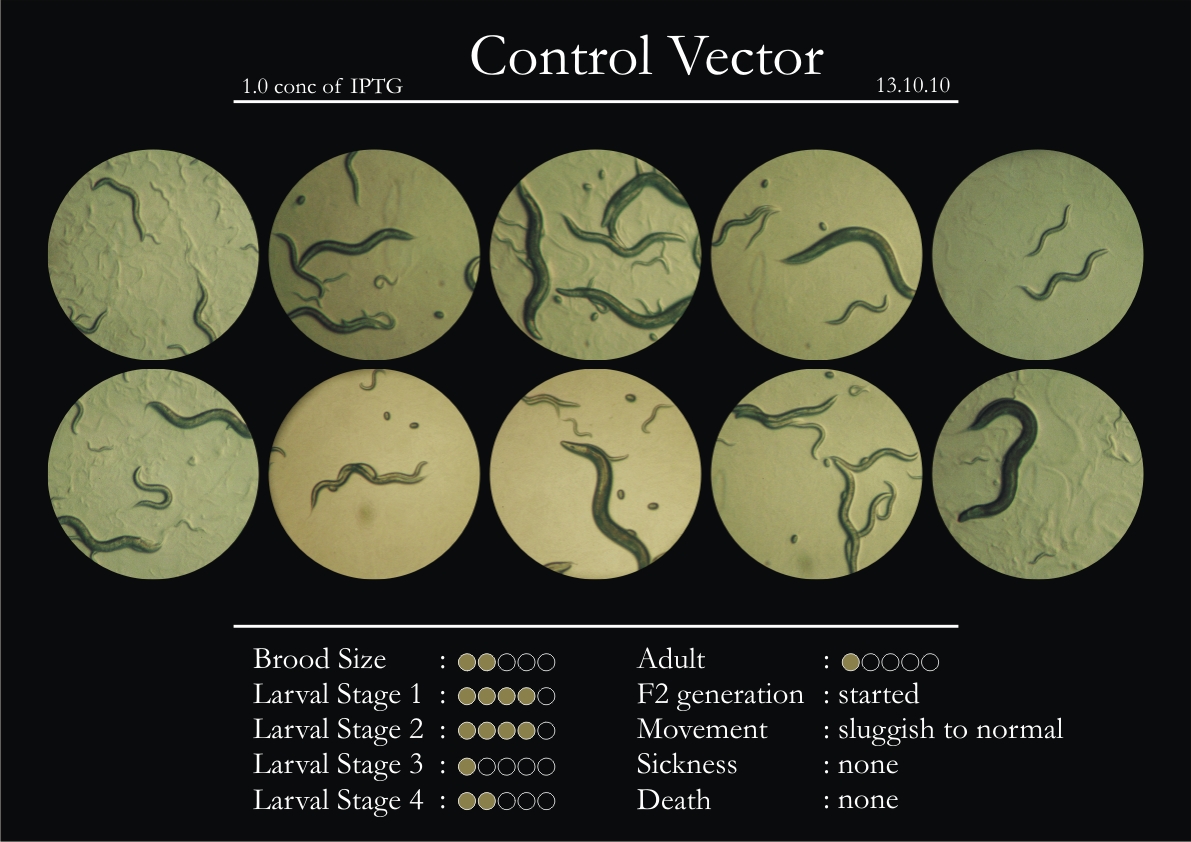
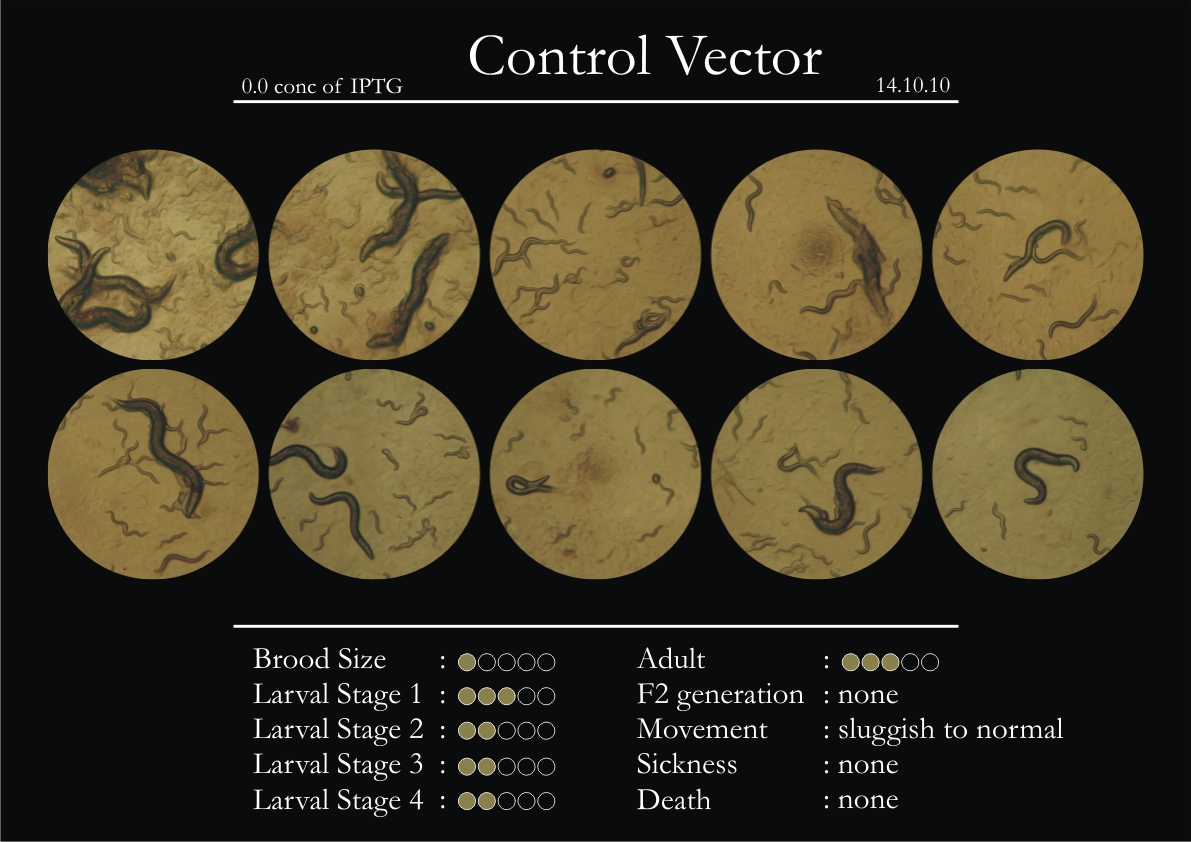
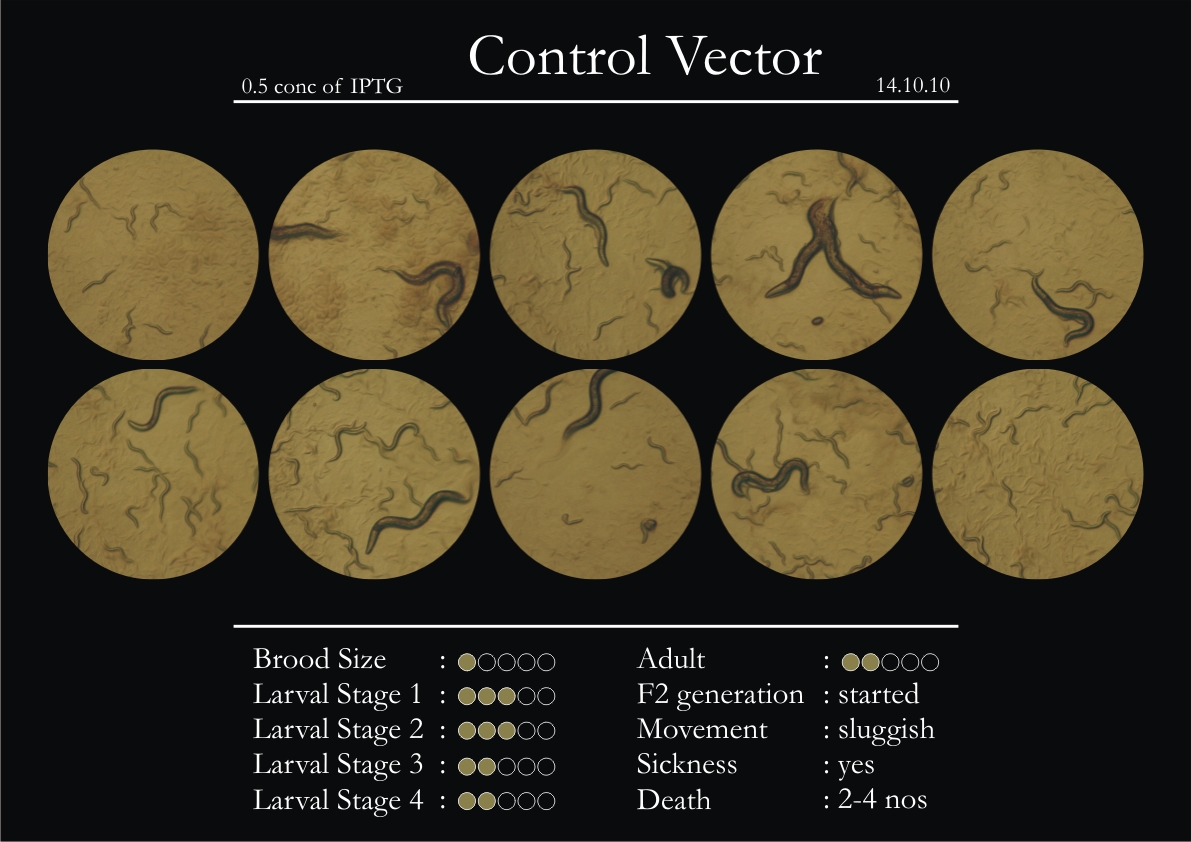
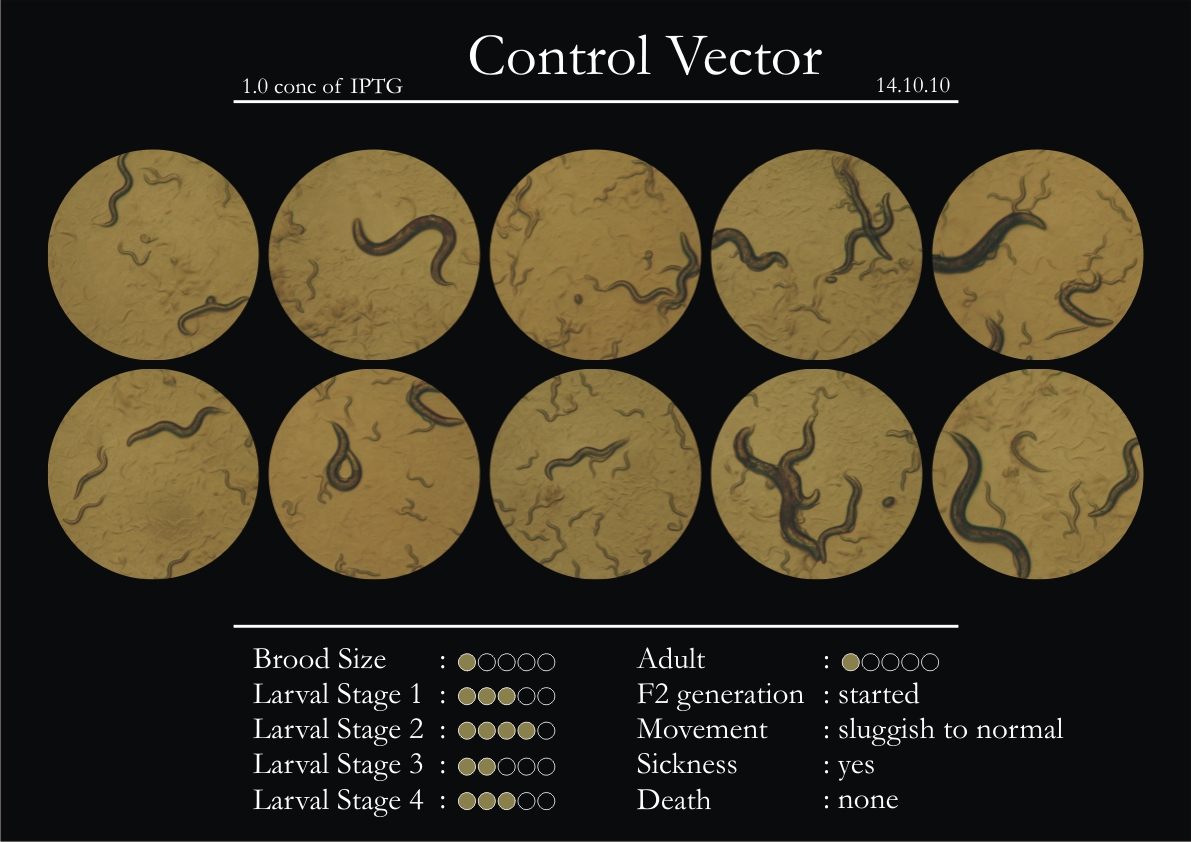
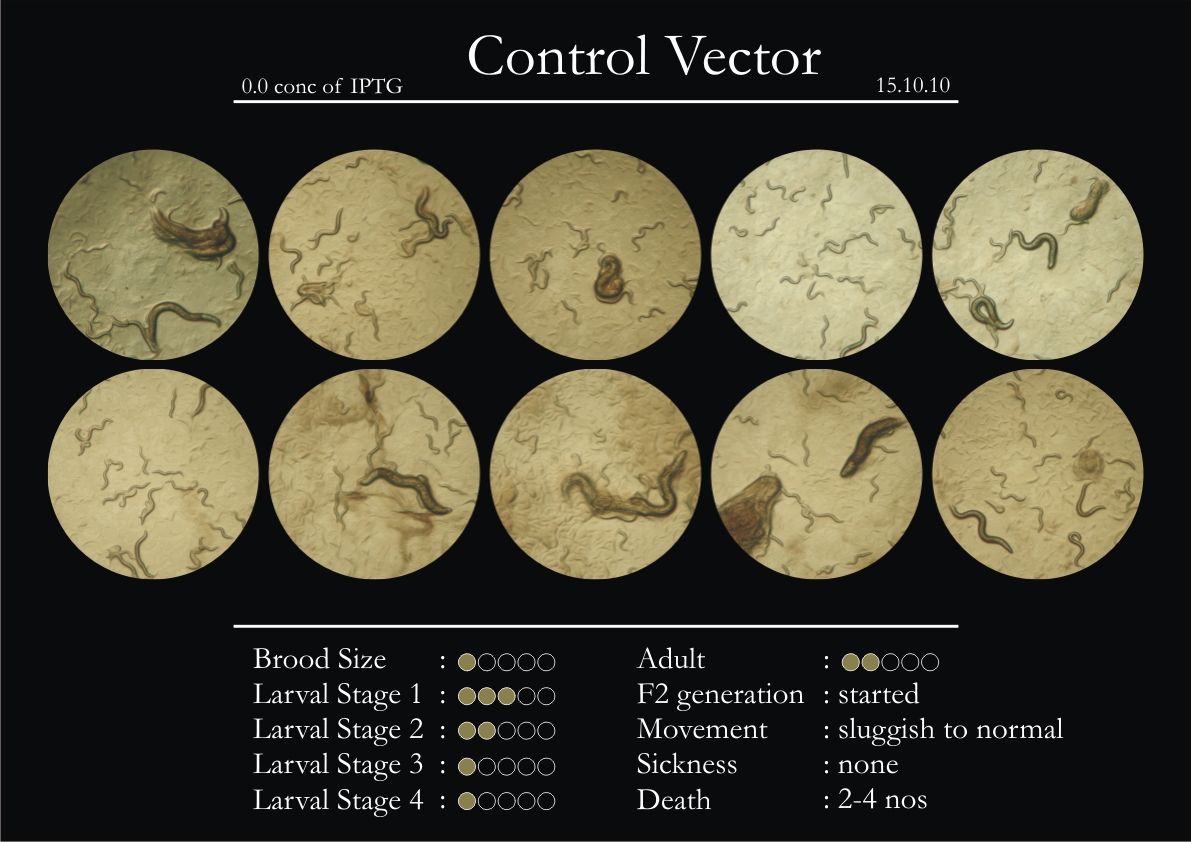
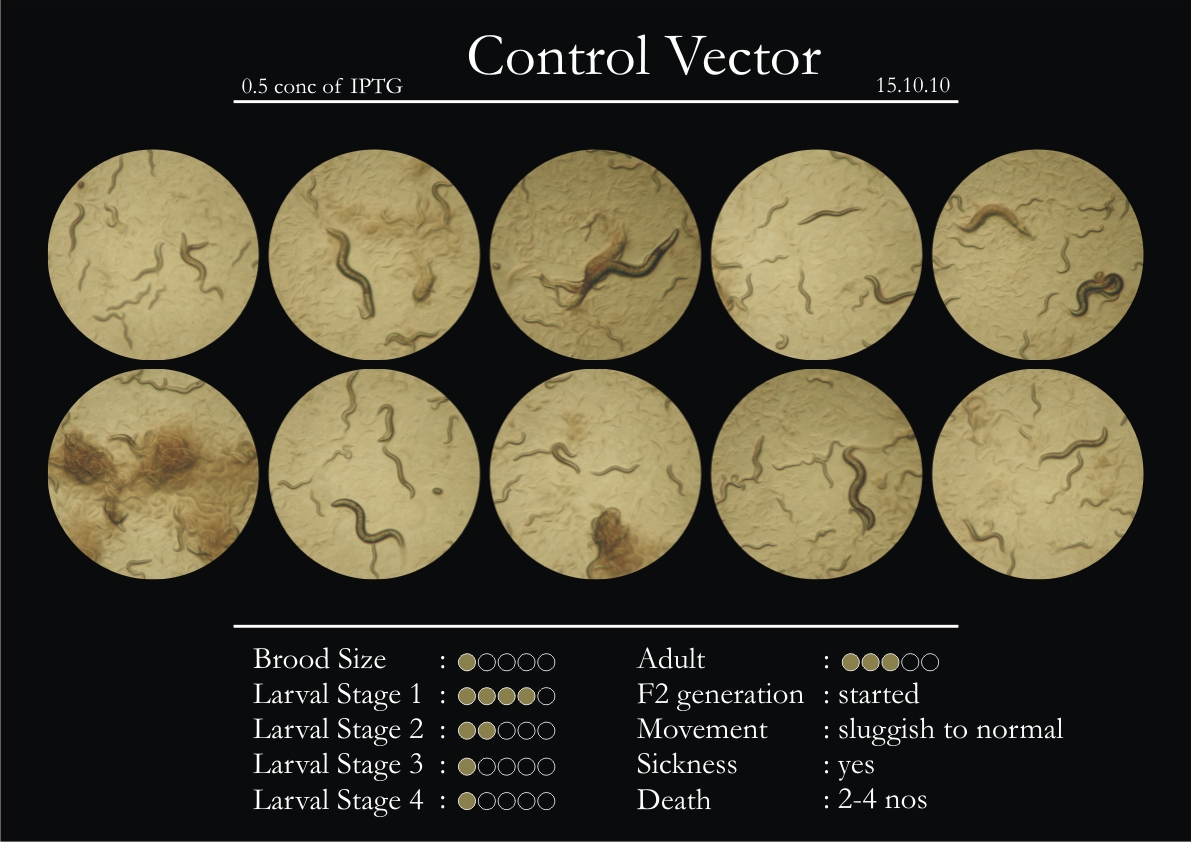
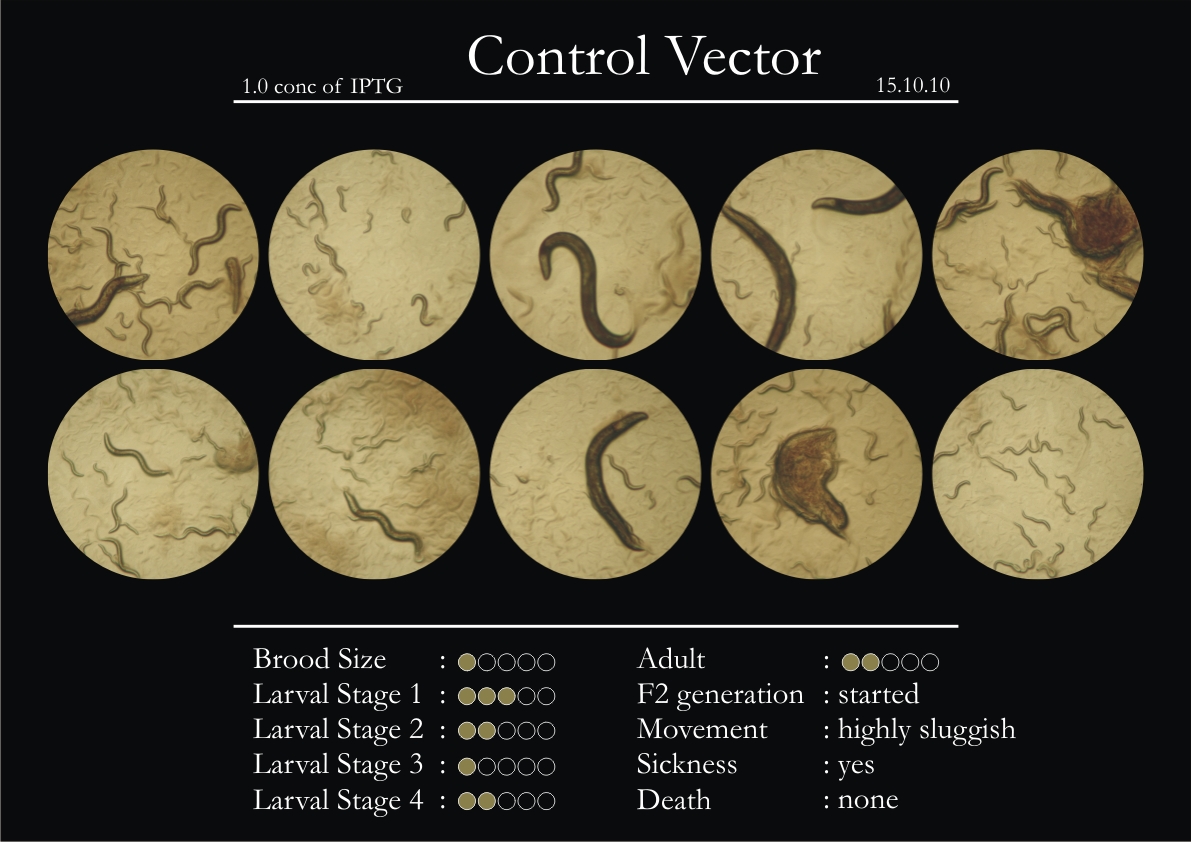
There were 5 control animals introduced into the plates on 11th. These contained plates with bacteria which had no vector in them. However, the plates did contain different concentrations of IPTG. Following were the results on observation of the control animals:
1. Growth was steady and quick.
2. Sluggish movement in adults was due to old age.
3. F2 generation started around the third or fourth day.
4. Death (not caused due to sickness) appeared later.
5. Brood size was normal.
6. General population started to reduce due to deficiency of food.
Daily Observations
11th October 2010
12th October 2010
13th October 2010
14th October 2010
15th October 2010
Calculation of movement
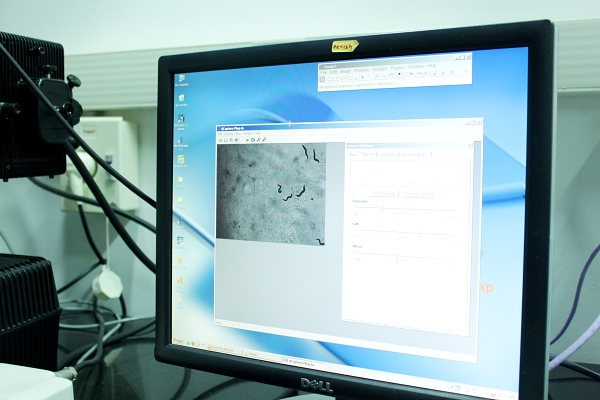
The following calculations were made from the videos captured by using a standard scale
1) CV 0.0 = 8cm in 5sec……. 8/5cm in 1 sec………..1.6cm\sec = 75.851px\sec
= 108.467micrometer\sec
2) CV 0.5 = 6.7………1.34cm/sec…………63.5253px/sec…………90.84118 μm\SEC
3) CV 1.0 = 3…….….0.6 cm/sec…………28.4442 px/sec………40.67521 μm\SEC
4) H14 0.0 = 1.3….…1.26 cm/sec………59.7328 px/sec………85.4179 μm\SEC
5) H14 0.5 = 3……………0.6 cm/sec…………28.4442 px/sec………40.67521 μm\SEC
6) H14 1.0 = 0.6.….0.12 cm/sec………5.6888 px/sec…………8.134984 μm\SEC
7) T14 0.0 = 7.3………1.46 cm/sec………69.2142 px/sec………98.97631 μm\SEC
8) T14 0.5 = 1.5…….0.3 cm/sec…………14.2221 px/sec………20.3376 μm\SEC
9) T14 1.0 = 3.6………0.72 cm/sec………34.1330 px/sec………48.81019 μm\SEC
10) WILDTYPE = 6.2………1.24 cm/sec………58.7846 px/sec………84.06198 μm\SEC
CV 0.0 = 108.467 μm\ sec
CV 0.5 = 90.84118 μm\ sec
CV 1.0 = 40.67521 μm\ sec
H14 0.0 = 85.4179 μm\ sec
H14 0.5 = 40.67521 μm\ sec
H14 1.0 = 8.13498 μm\ sec
T14 0.0 = 98.97631 μm\ sec
T14 0.5 = 20.3376 μm\ sec
T14 1.0 = 48.81019 μm\sec
Wild type = 84.06198 μm\sec
Video graphic Observation on 16.10.10 for Wildtype, H14N18.1, T14F9.1 and Control Vector
Conclusion
There were some phenotypes of the H14N18.1 gene (roller gene) that were expressed. It is to be noted that phenotypes were expressed more explicitly in larval stages 3 and 4 than stages 1 and 2. Phenotypes related primarily to locomotion and confused coiling movement. Their motion appeared to be slow and sluggish, which is a typical phenotype of the H14 gene in the C.elegans. Additionally, they did not respond to external stimuli once past the 2nd larval stage. Larval stages 1 and 2 showed quicker growth than 3 and 4, which might denote that RNAi took effect sometime during stages 2 and 3. We observed no phenotypes corresponding to the collagen and cuticle- based cuticle development in the H14. In the T14F9.1 gene, we observed phenotypes relating to cuticle development, growth and motion. While motion slowed down and eventually almost ceased, dark patterns started to form on the body of the worm. Blisters on the body were apparent, but very few in number. Death was prominent among larval stages 3 and 4, which might again indicate that RNAi took effect during and between stages 2 and 3. When L4 worms reached adulthood, F2 generation started almost immediately. On observation, it was recorded that the F2 generation started to express the phenotype in stages 2 and 3, as opposed to F1 generation which expressed results during stages 3 and 4. Since F2 larvae expressed stronger phenotypes in less time, it might indicate that RNAi took effect sooner in the F2 larvae. However, we did observe that lower levels of IPTG did not result in weaker phenotypes. Plates containing 0.0 concentration of IPTG showed similar results as those containing 0.5 concentration and 1.0 concentration. Control animals did not express any phenotypes despite presence of different IPTG concentrations.
Reference Photos
 "
"

