 "
"
Team:Valencia/WB
From 2010.igem.org
Time goes by...
(El tiempo pasa...)
Follow us:

Our main sponsors:

Our institutions:

Visitor location:
» Home » The Project » Creating Technologies
Microbial Albedo Recorder
Introduction
In order to study the capability of the cultures to absorb energy coming from sunlight depending on their coloring, we are going to measure the temperature that the cultures reach compared with others control know-color cultures. These temperatures are measured by a system of thermocouples.

For this objective, it has been designed a dish in which our E. Coli and yeast cultures are studied. There are as well two reference cultures: one entirely black and another totally white. The cultures are exposed to radiation coming from sunlight. All cultures are previously kept in constant and known temperature.
In order to make sure that the temperature differences among the cultures are due only to albedo effect, two strategies have been designed.
- Several light sensors have been laid out symmetrically. The signal received by these sensors is transmitted to an electronic circuit which produces an electric response that finally ends up in the datalogger
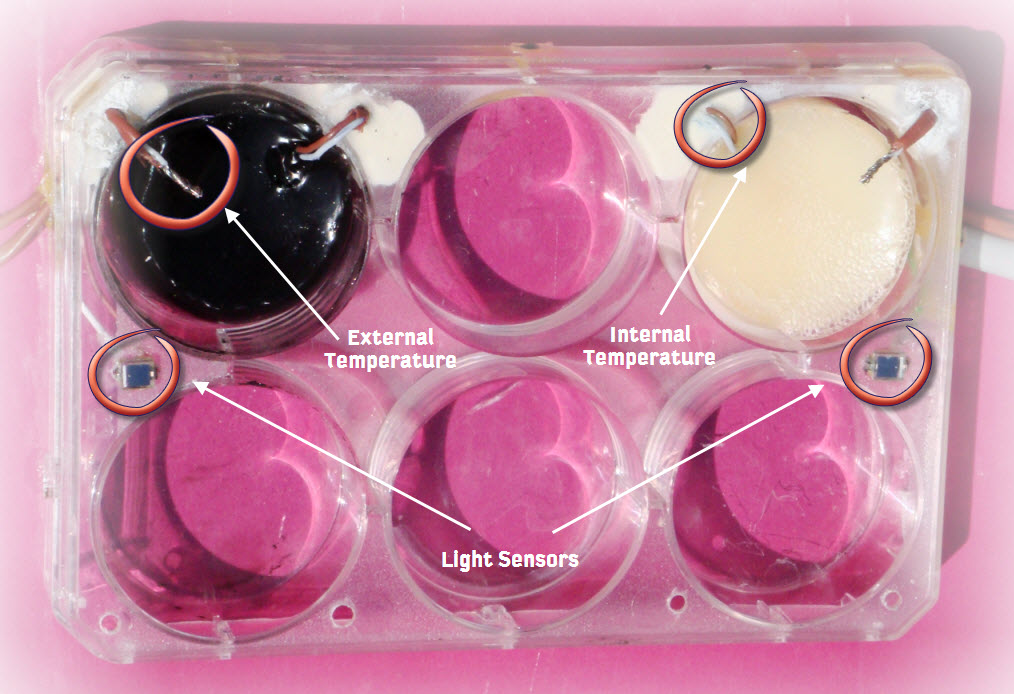 Layout of the thermocuples and light sensors.
- Several thermocouples are arranged surrounding the cultures to make sure that the external temperatures are equal for all of them. We used our temperature mesurement system in order to accomplish this task.

Therefore, any temperature difference between the cultures has to be produced by the capability of absorbing light. This temperature is then measured by another thermocouple inserted into the culture. Furthermore, all this data is recorded and shown in real time through a computer screen.
Mesurement System
The aim of this part of the project is to quantify the difference of albedo depending on the color of several cultures of microorganisms.
In order do this, we need to measure two types of magnitudes: the amount of solar radiation that reaches the cultures (illuminance) and internal and surrounding temperatures of the cultures. This is because we propose that if the surrounding temperature of the cultures and the incident solar radiation are the same for all the cultures, then our Microbial Albedo Recorder system can estimate the albedo difference between those cultures, because the difference in the internal temperatures will be due only to the albedo effect.
The measurement system has three main parts:
- The test boards,
- the datalogger and
- the computer.
The test board and sensors
The test board is formed by eight temperature sensors and 2 light sensors. All of them placed in a symmetric way surrounding the small culture dishes, in order to cancel possible location bias errors, as is posible to see in the next figure.

This board does not perform any signal conditioning, it only serves as frame to mount all the sensors and the cultures.
In the case of the light sensors, their output signal is conditioned in an electronic interface, to see in more detail the light sensor go to Light Sensors.
In the other hand, the temperature sensors are thermocouples, with their proper compensation.
The signals coming from the sensors were digitally acquired using a datalogger, explained in the next section.
Datalogger
The electronic acquisition system that we use is the Datalogger 34970A (Agilent). This equipment requiters a setup for each one of the sensors, like the following:

The computer
The computer is used to control que acquisition unit (datalogger) and to receive the income flow of data from the sensors, allowing us to represent the data in real time. An Interface in LawView was design to handle all the configuration and the data involver in the experiments.

In this screen we se the panel of the LabView software and in the bottom, there are some graphs showing the carried out experimenter. Once the assay is done, is possible to save all the data of the experiment.
About the low level programming was made using subVI's and ad-hod programmed subroutines from LabView.

The program is divided into sequential streams that run with no parallelism between them.

The first of these sequences is to select the communication protocol, in order to be able to connect with the 34970A datalogger. Either through serial communication (RS232) or via GPIB port.
In the following three sequences the configuration of the types of measures and adquisition type is done.

The following sequence is the central structure of the program, this will give orders to the datalogger for data acquisition, the type of orders vary according to how it has been decided to conduct the test (continuous or discrete). This sequence is repeated indefinitely if continuous mode is selected, while on the other hand, if discrete mode is selected only if the user running the signal. In either case this sequence, and therefore the data acquisition ends when the user presses the stop button from the STOP button on the virtual instrument front panel.

From here it would close the communication with the device, so that any program can use. Then data is stored in an external file format compatible with spreadsheet.

Experiments
Once we developed the MAR system, we used the system to measure and probe the albedo difference, which were produced among the cultures with different colors.

Four samples were selected, two external controls: one totally black culture (maximum absortion) and other white (minimum absortion). So, the last two samples were the ones we had to find out which one had higher absotion from sunlight.

We conducted the assay in the roof. At the beggining, we covered the system to avoid the sunlight, how we can see in grafic 1 and 2. These graphics show the increased of temperatures when we unrecovered the system. Furthermore, the temperature difference between the dark cultures and light ones was hardly 2ºC at the end.
