Team:Sheffield/Graphical User Interface
From 2010.igem.org

Overview | Chimeric protein system | Cholera protein system
Graphical User Interface
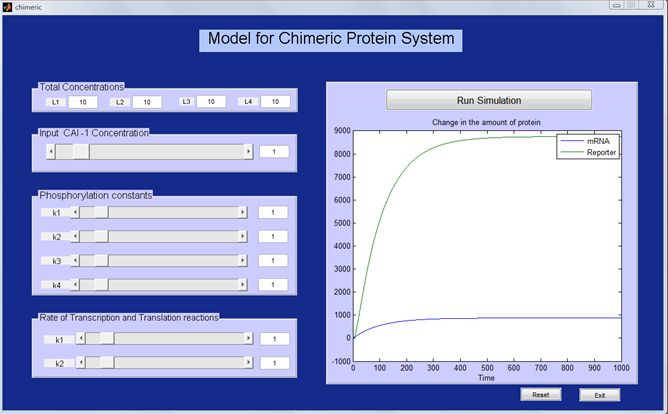
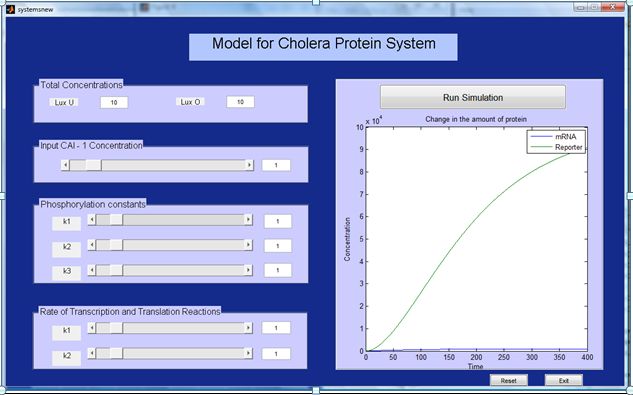
Graphical user interface (GUI) provides a user friendly interface for the end-user to manipulate data in Matlab. It could be programmed in such a way that it allows the user to enter the parameters in the program code via the GUI without altering the main program code and to see how the output of their programme is affected. With this reason, we decided to construct a GUI for our two models to help the user notice how the output of our project model could be affected when certain prime parameters are changed. Some of the parameters in the system will be in our control (such as the total amount of protein) whereas the others will not be (such as the rate constants). They can be determined through experiments and GUI can be used to vary the these parameters to reflect the experimental results. As our approach to modelling both systems was to divide each system into two processes; thus phosphorylation cascade and gene expression, parameters that therefore could be changed were made in relation to these two processes.
Chimeric
Parameters that could be changed in the phosphorylation process are;
- Concentration of CAI – 1 which is our input signal which triggers the initiation of the phosphorylation cascade.
- L1 which represents the amount of protein that is controlled by the input; thus CAI – 1 which helps initiate autophosphorylation in the system.
- L2 and L3 which represents the amount of protein in each intermediate state of the His – domain and Asp – domain after the phosphorelay rate of reaction from each state.
- L4 which represents the amount of response regulator protein produced after the phosphorelay.
Parameters that could be changed for the gene expression process are;
- K1 represents the rate of reaction at which the response regulator protein is transcribed to mRNA
- D1 represents the amount of degradable mRNAs after the transcription.
- K2 represents the rate of reaction at which the mRNAs are translated to proteins.
- D2 represents the amount of degradable proteins after translation.
Cholera System
Parameters that could be changed in the phosphorylation process are;
- Concentration of CAI - 1 which is our input signal which triggers the initiation of the phosphorylation cascade.
- Lux Up which represents the amount of phosphorylated Lux U protein present when E.coli detects CAI - 1.
- Lux O which represents the amount of dephosphorylated Lux O protein at the end of the phosphorylation cascade.
Parameters that could be changed for the gene expression process are;
- K1 represents the rate of reaction at which the response regulator protein is transcribed to mRNA
- D1 represents the amount of degradable mRNAs after the transcription.
- K2 represents the rate of reaction at which the mRNAs are translated to proteins.
- D2 represents the amount of degradable proteins after translation.
The zip file “GUI” uploaded below gives the Matlab files for running the graphical user interfaces. This can be downloaded and run in a computer that has Matlab installed.
Instructions for running : -
1. Download the folder and unzip the files.
2. Open Matlab and change the directory to the folder where the files are saved.
3. To run the GUI for Chimeric system type “chimeric” in the command window.
4. To run the GUI for Chimeric system type “cholera” in the command window.
Overview | Chimeric protein system | Cholera protein system
 "
"


