Team:Sheffield/cholera protein system
From 2010.igem.org

Overview | Chimeric protein system | Graphical User Interface
Model of the cholera protein system
Explanation of the system
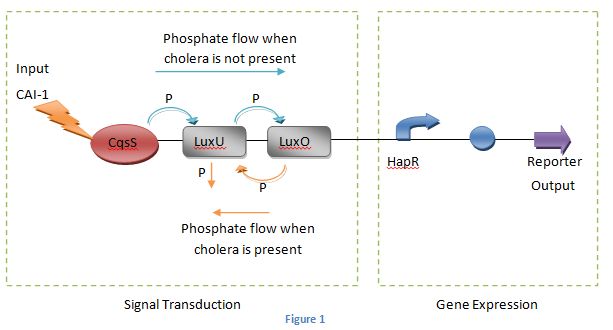
The diagram below explains the process of our cholera detection biosensor with the cholera protein system.
Figure 1
Research into literature[1,2] has shown that the receptor CqsS is called a two component protein as it can function in the form of a kinase or phosphatase according to the concentration of CAI-1.
At low concentrations of the signalling molecule the receptor protein functions as a kinase. This is then phosphorylated and will pass the phosphate through the phosphorylation pathway consisting of LuxU and ending in the phosphorylated response regulator LuxO(as shown by the blue arrows in Figure 1). This will activate some sRNAs in the bacterium which in turn will repress the HapR promoter. Therefore no reporter protein will be produced.
When the concentration of CAI – 1 reaches a threshold value the receptor protein starts behaving as a phosphatase. This reverses the flow of phosphates in the phosphorylation pathway and as a result the response regulator LuxO is dephosphorylated(as shown by the orange arrows in Figure 1). This activates the HapR promoter causing the expression of the reporter gene.
The main processes in the system can be divided in to two parts as signal transduction which describes the phosphorylation pathway and gene expression which describes the production of the reporter gene. The model is created in these two steps as given below.
Model for the signal transduction
To create a simplified model of the cholera detection biosensor corresponding to the behaviour of vibrio cholera we define that at the initial state of the system (i.e. no cholera present) the receptor protein CAI-1 to be in kinase mode and the proteins LuxU and LuxO to be phosphorylated. We then define that the when cholera is present CAI -1 would bind to the receptor protein which will cause the receptor to switch to phosphatase mode disregardging the requirement of a threshold value of CAI-1. This would reverse the phosphate flow of the system leading to a dephosphorylated LuxO which acts as the transcription factor for the reporter gene expression.
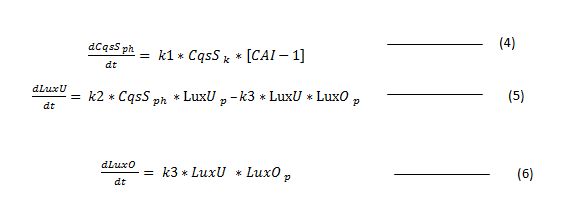
This process can be expressed by the following chemical equations. (the equations were obtained from reference [3] )
where: ki represent rate constant of ith reaction
Equation (1) represents the binding of the CAI -1 to the receptor CqsS turning it into a phosphatase.
Equation (2) represents the dephosphorylation of LuxU by the phosphatase CqsS.
Equation (3) represents the dephosphorylation of LuxO due to phosphate being passed in to unphosphorylated LuxU.
Using these equations we create the following mathematical model for the system with the assumptions:
1. The total concentration of all the proteins will remain constant throughout the signalling process.
2. The reverse reactions occurring in system (if any) are negligible.
Model for the gene expression
Our Vibrio cholera system works on the principle that the unphosphorylated Lux O, a transcription factor that is achieved at the end of the phosphorylation cascade binds to the reporter DNA gene which results in the beginning of the transcription reaction. The unphosphorylated Lux O helps to inhibits the expression of sRNAs which therefore causes the activation of our reporter DNA gene to produce light unobstructed after it has been translated from mRNA. To therefore construct a mathematical model for the transcription reaction for our system, the following assumptions were made:
1. There were no expression of sRNAs in the E. Coli system, however there was an abundance of RNA polymerase.
2. That the HapR promoter used for our system was always active and tight; meaning there is high expression of gene. [6]
3. The degradation rate of mRNA was very negligible and therefore most of the mRNAs were translated protein.
With these assumptions we create following differential equation for the transcription.
where:
t1 = the rate of transcription
d1 = transcription degradation
After the reporter DNA has been transcribed to mRNA, the mRNA was then translated to a protein which is the final procedure for gene expression. This takes place in the presence of tRNAs, and therefore to construct a mathematical model for the translation reaction for our cholera protein system, the following assumptions were made;
1. The reporter DNA gene expression is limited at the beginning of the translation process. [4]
2. Also, tRNAs are abundant in the E. Coli and that there are over – expressing rare tRNAs and so all the mRNAs are translated to proteins. [5]
3. The degradation rate of the protein is very negligible and therefore the protein produced have longer half – life.
With these assumptions we create following differential equation for the translation.
where :
t2 = the rate of translation
d2 = translation degradation
Simulation of the model
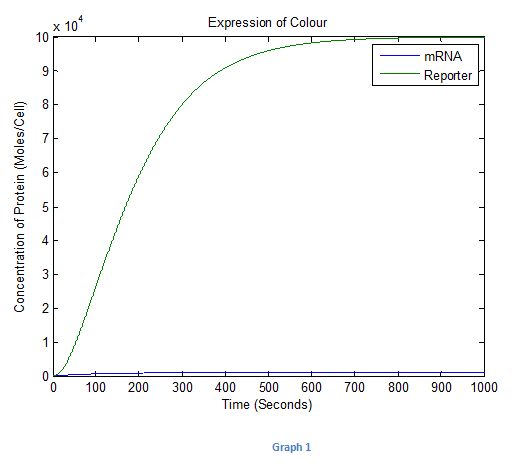
In simulating the mathematical model consisting of the five differential equations (Equations (4) –(8)) into matlab and use an ode solver to solve the equations. (The code can be found in the Appendix) For the simulations we set the total amount of LuxU and LuxO proteins to 10 and all the rate constants to 1 except for transcription/translation degradation which are at 0.01
Graph 1
It can be seen that as in Graph 1 the colour increases and tend to a steady state at around 800 seconds. From this we could estimate that it will take about 15 minutes for the colour to be produced. The input was kept constant at 1 over this period.
The curve shows that the initial rate of translation was low for some time before becoming high as the translation curves were both sigmoidal. From this, it therefore could be concluded that fluorescence light produced from the reporter protein in the system may not be visible to the naked eye initially when the E.coli detects the CAI-1.
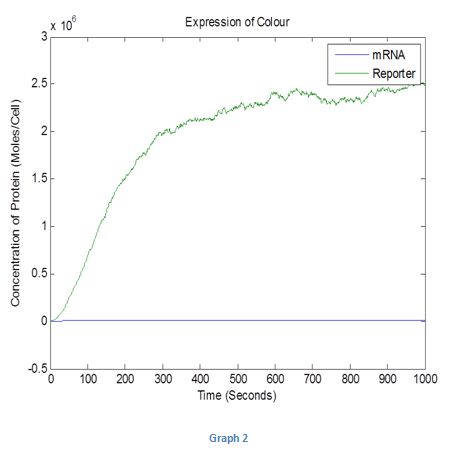
As the real system parameters will not be 1, we also created a stochastic model where the system was simulated with parameters selected at random. The result for this simulation is given in Graph 2 below.
Graph 2
This can be simulated with different parameter and input values using the interface we have created in matlab. More information can be found at Graphical User Interface.
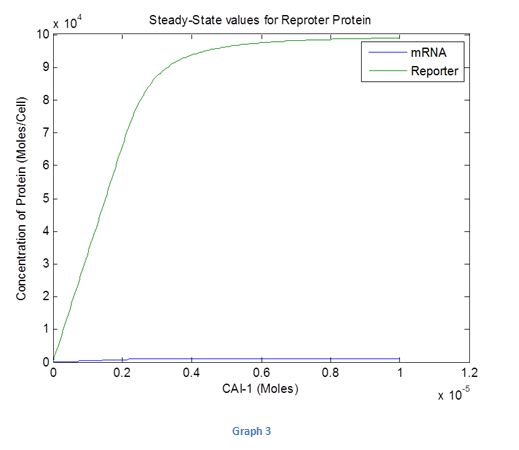
We then tried investigating how the steady state response for the reporter protein would change with different levels of inputs. The results are shown in Graph 3 given below
Graph 3
It can be seen that from 0 to 0.8*10^-5 moles (estimated values with systems parameters set to 1) of CAI-1 the steady state levels increase and at these levels there would be a difference in colour intensity seen. After 0.8*10^-5 moles the concentration of the protein tends to a steady state and any more increase in the input would not change the intensity of the colour. Therefore we can deduce that we can use the biosensor to measure the amount of cholera present only up to a certain level of autoinducer.
References
[1] Hammer BK , Bassler BL; Regulatory small RNAs circumvent the conventional quorum sensing pathway in pandemic Vibrio cholera, [online] Available at:< http://www.pnas.org/content/104/27/11145.long> [Accessed 24 October 2010] [2] Atkinson S.,Williams P.,Quorum sensing and social networking in the microbial world,[online] Available at:< http://rsif.royalsocietypublishing.org/content/6/40/959.full?sid=bac403f8-1af7-44a2-aee8-2e223ea1d926> [Accessed 24 October 2010]pp 963-964
[3] Banik S., Fenley A., Kulkarni R.,A model for signal transduction during quorum sensing in Vibrio harveyi, [online] Available at:< http://iopscience.iop.org/1478-3975/6/4/046008/fulltext> [Accessed 24 October 2010pp]. 2-3
[4]Kudla G, Murray AW, Tollervery D Plotkin JB (2009); Coding sequence determinants of gene expression in Escherichia coli
[5] Kane JF (1995), Effects of rare codon clusters on high - levels expression of the heterologous proteins in Escherichia coli. Curr Opin Biotechnol 6: 494 - 500
[6]Lin, W., Kovacikova, G., and Skorupski, K. (2005),Requirements for Vibrio cholerae HapR binding and transcriptional repression at the hapR promoter are distinct from those at the alphapromoter. J Bacteriol 187: 3013 - 3019
Overview | Chimeric protein system | Graphical User Interface
 "
"


