BBa K338001
From 2010.igem.org
| Line 26: | Line 26: | ||
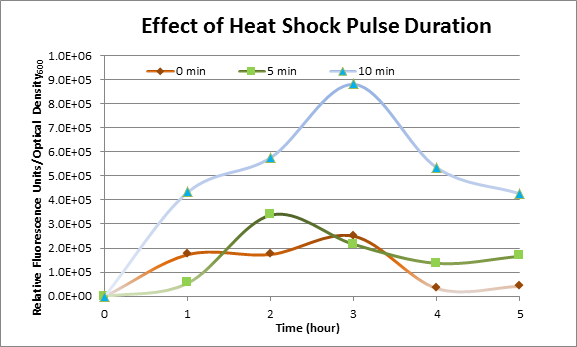
The measurements suggest that a heat shock period of 10 minutes significantly increases the production of GFP, while a heat shock period of 5 minutes leads to a similar GFP production level as the untreated cells. Furthermore, the production of GFP shows a decreasing trend after 3 hours suggesting that the heat shock promoter was only activated for a certain time period. | The measurements suggest that a heat shock period of 10 minutes significantly increases the production of GFP, while a heat shock period of 5 minutes leads to a similar GFP production level as the untreated cells. Furthermore, the production of GFP shows a decreasing trend after 3 hours suggesting that the heat shock promoter was only activated for a certain time period. | ||
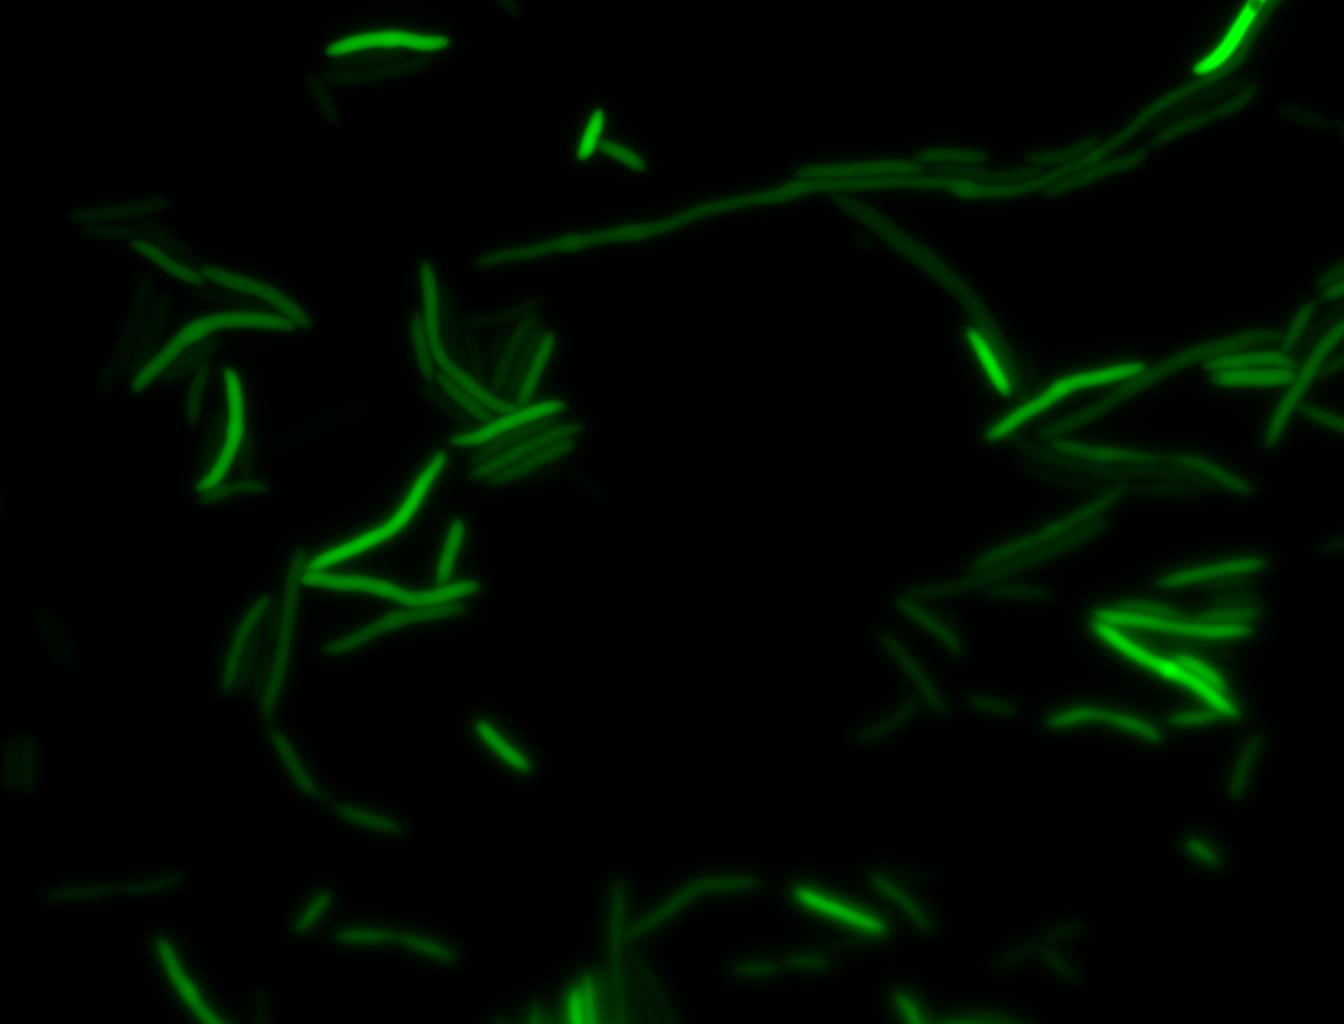
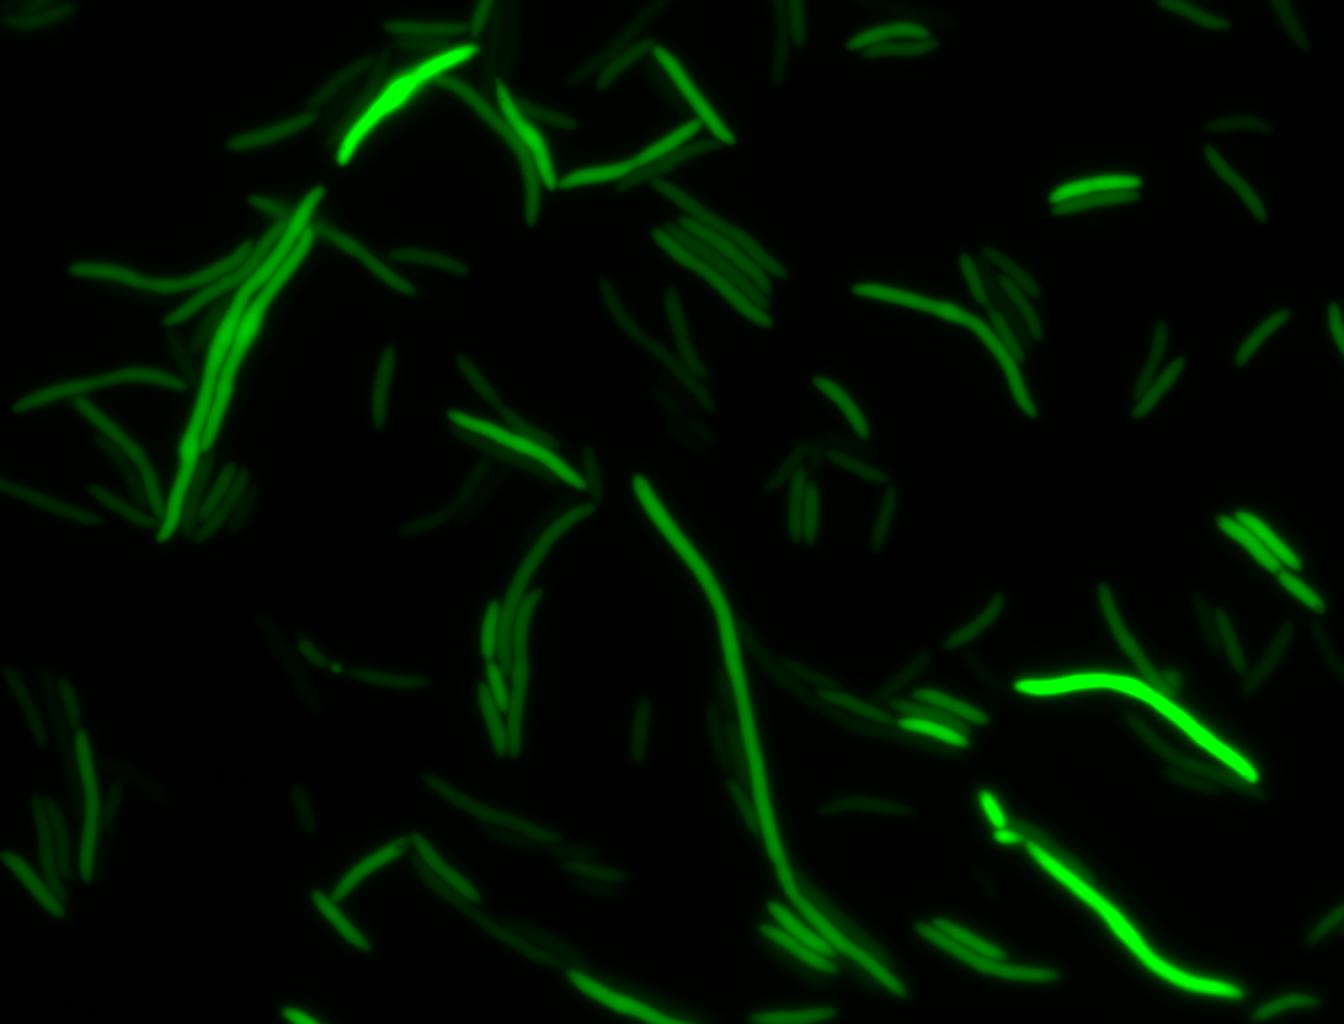
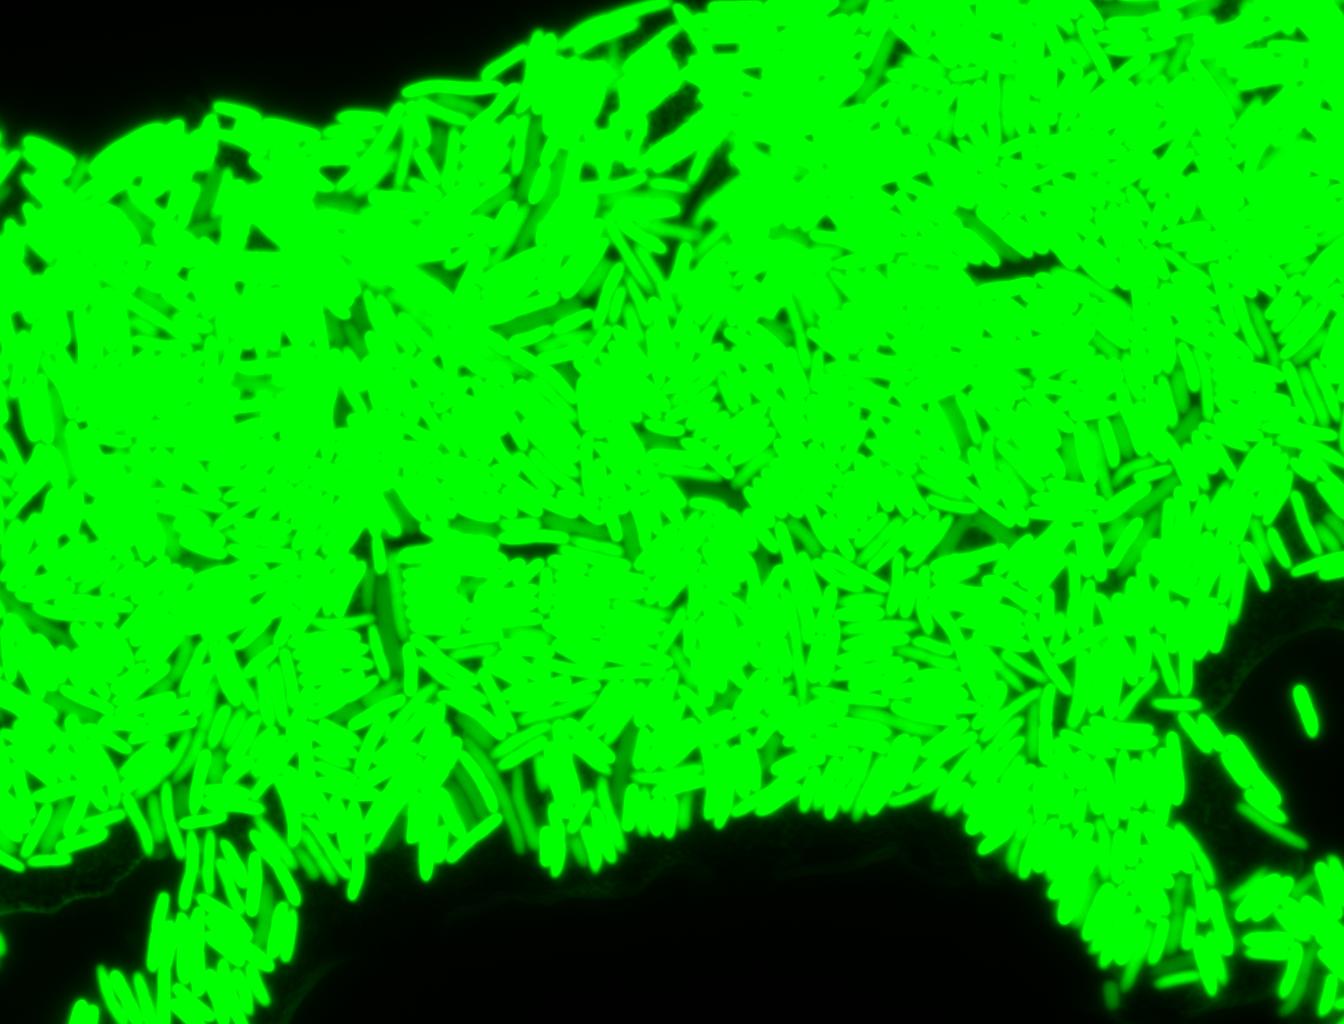
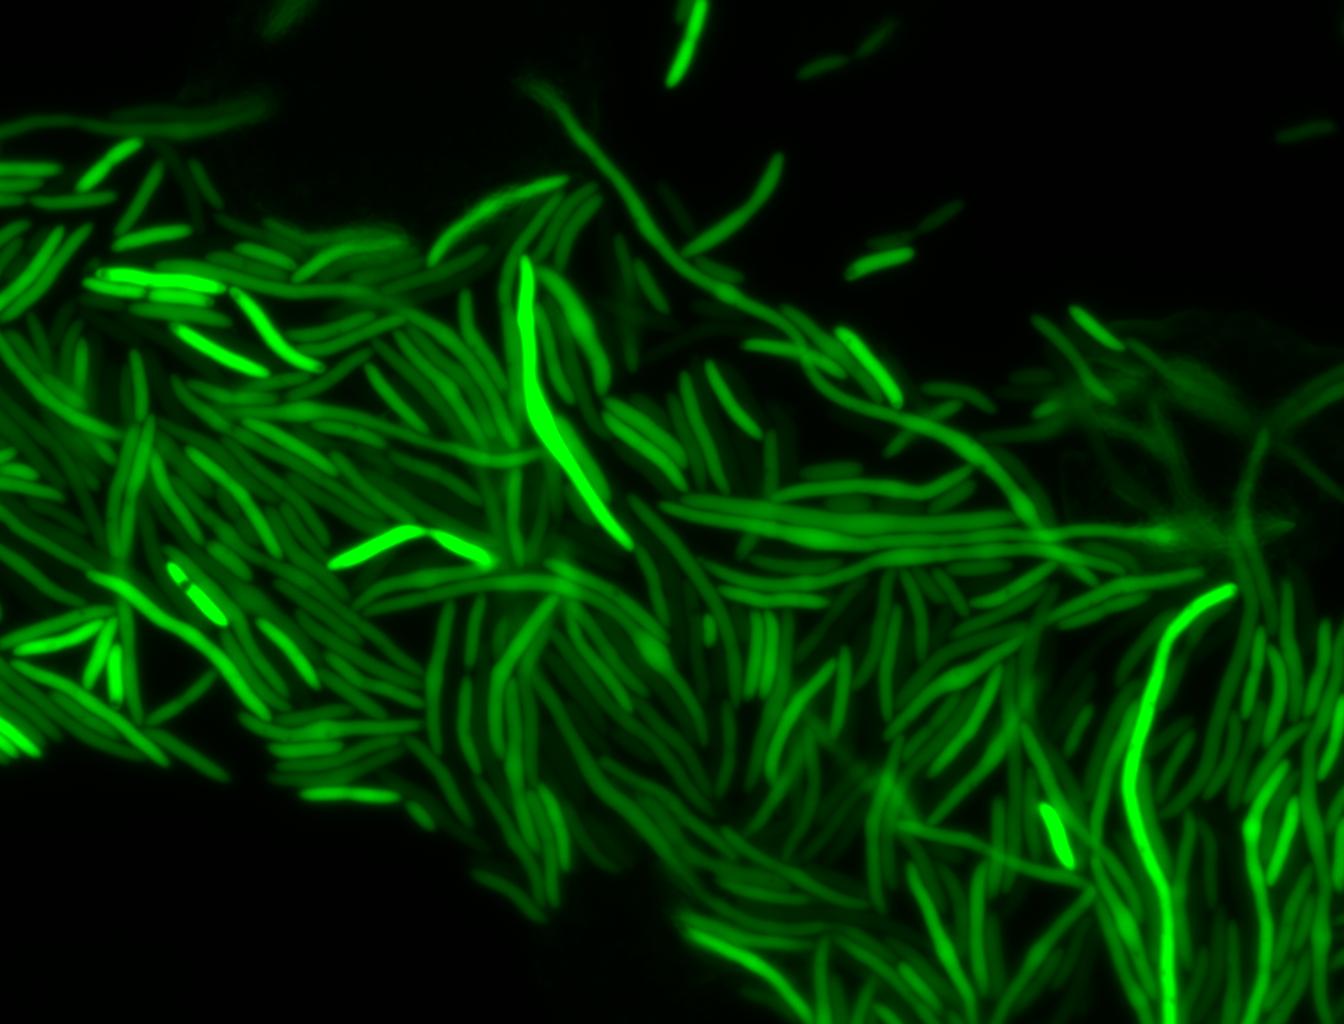
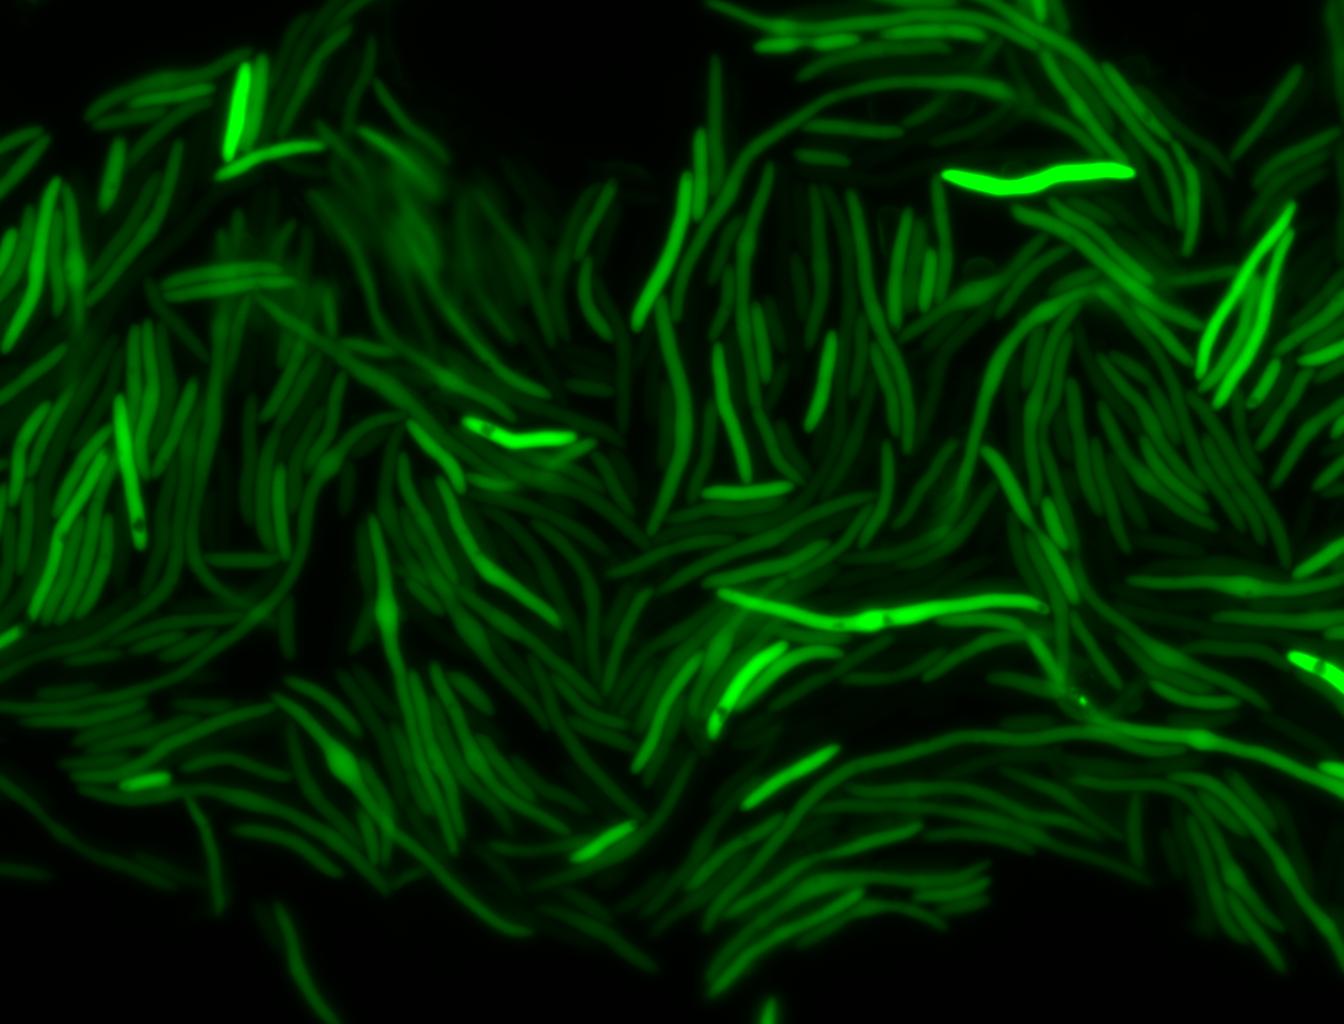
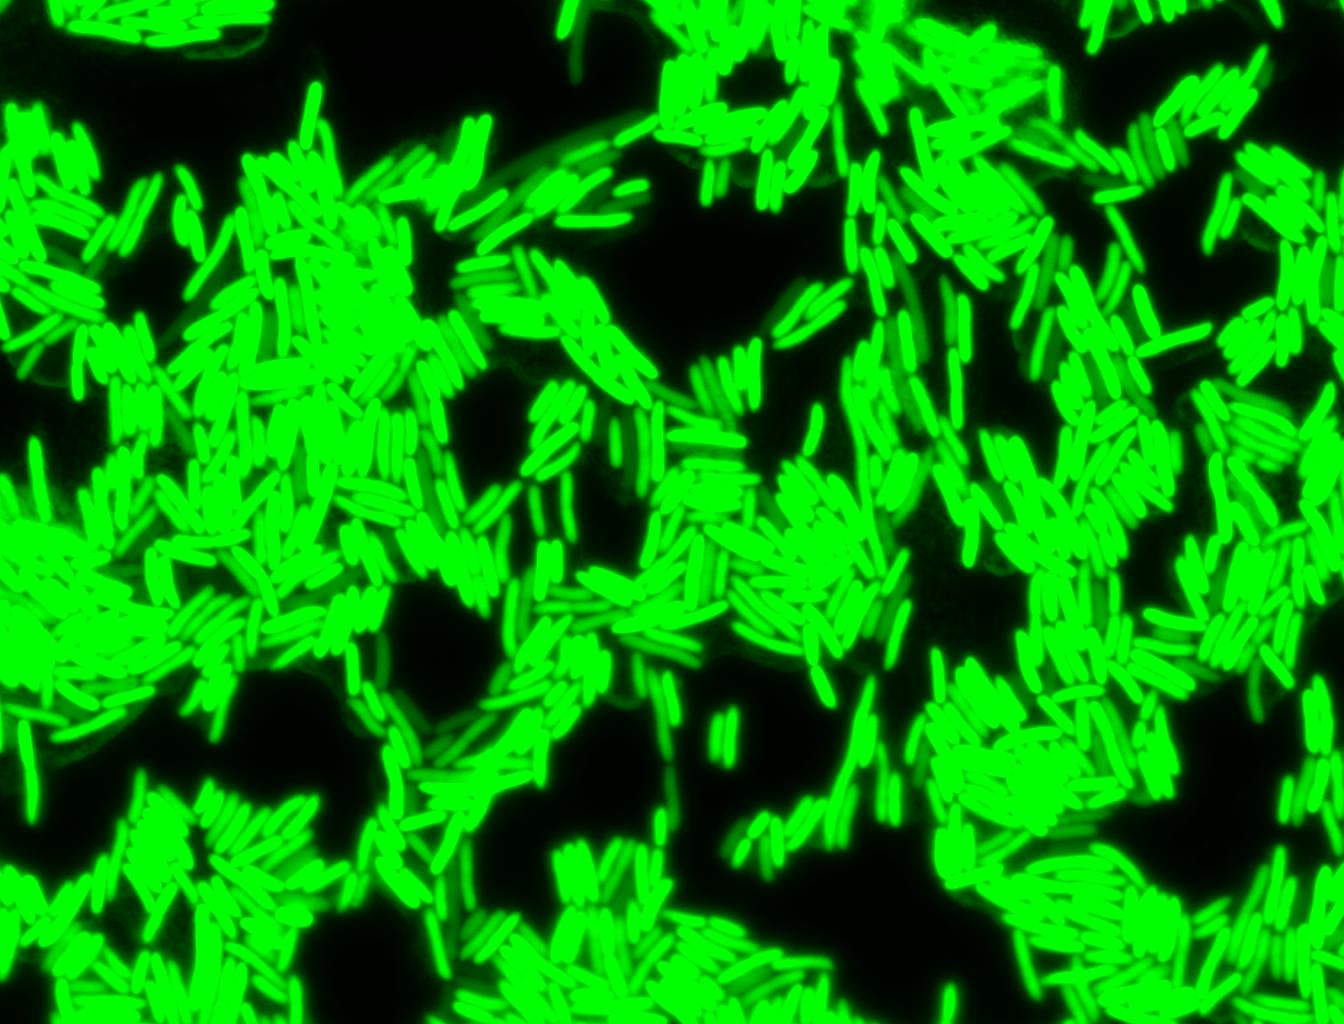
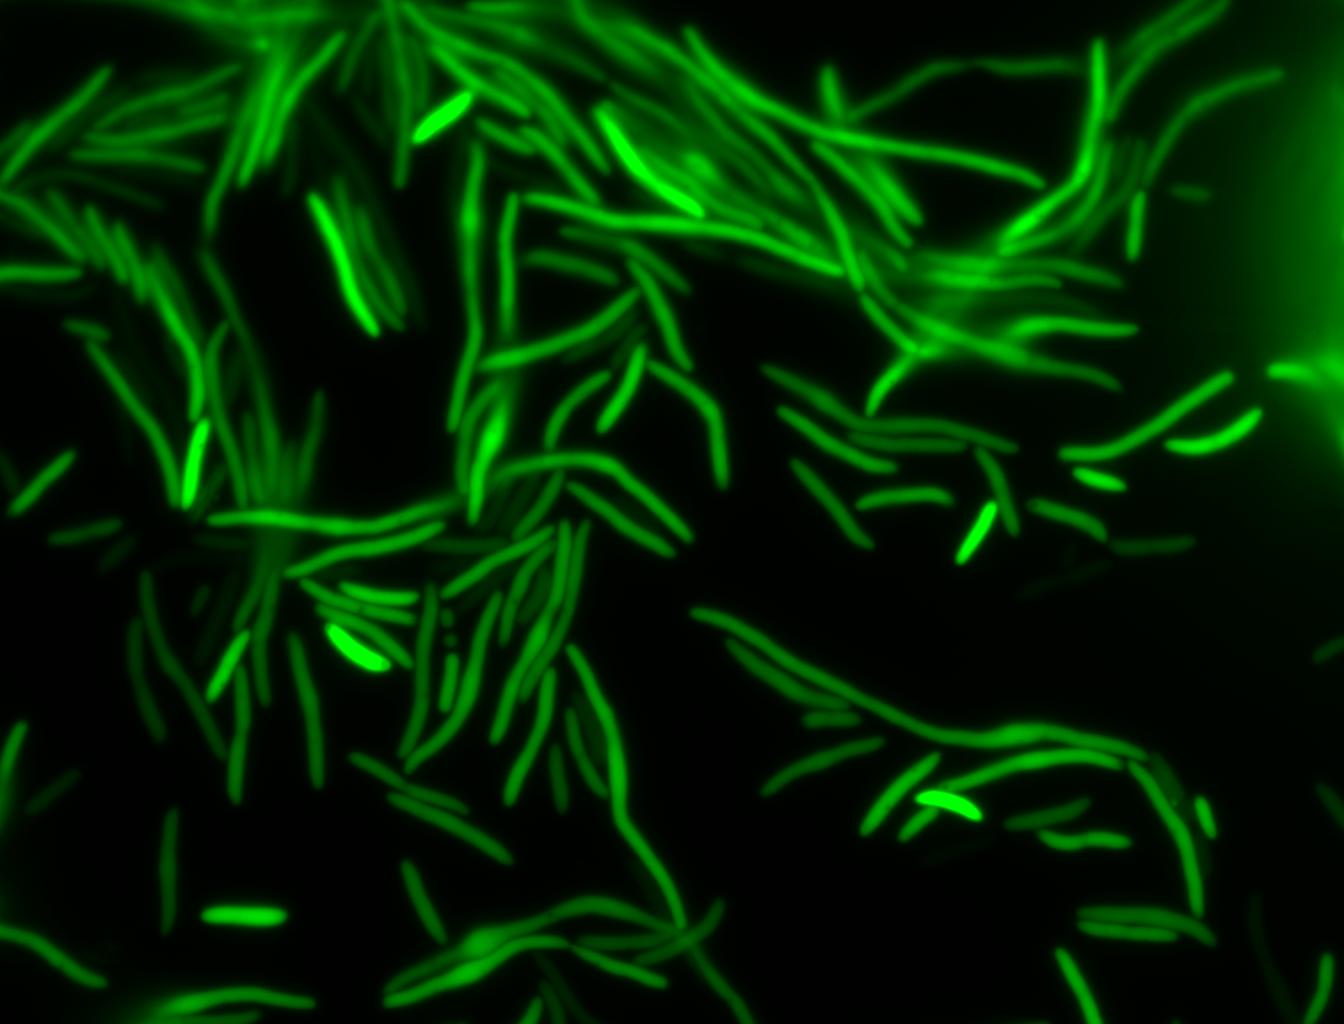
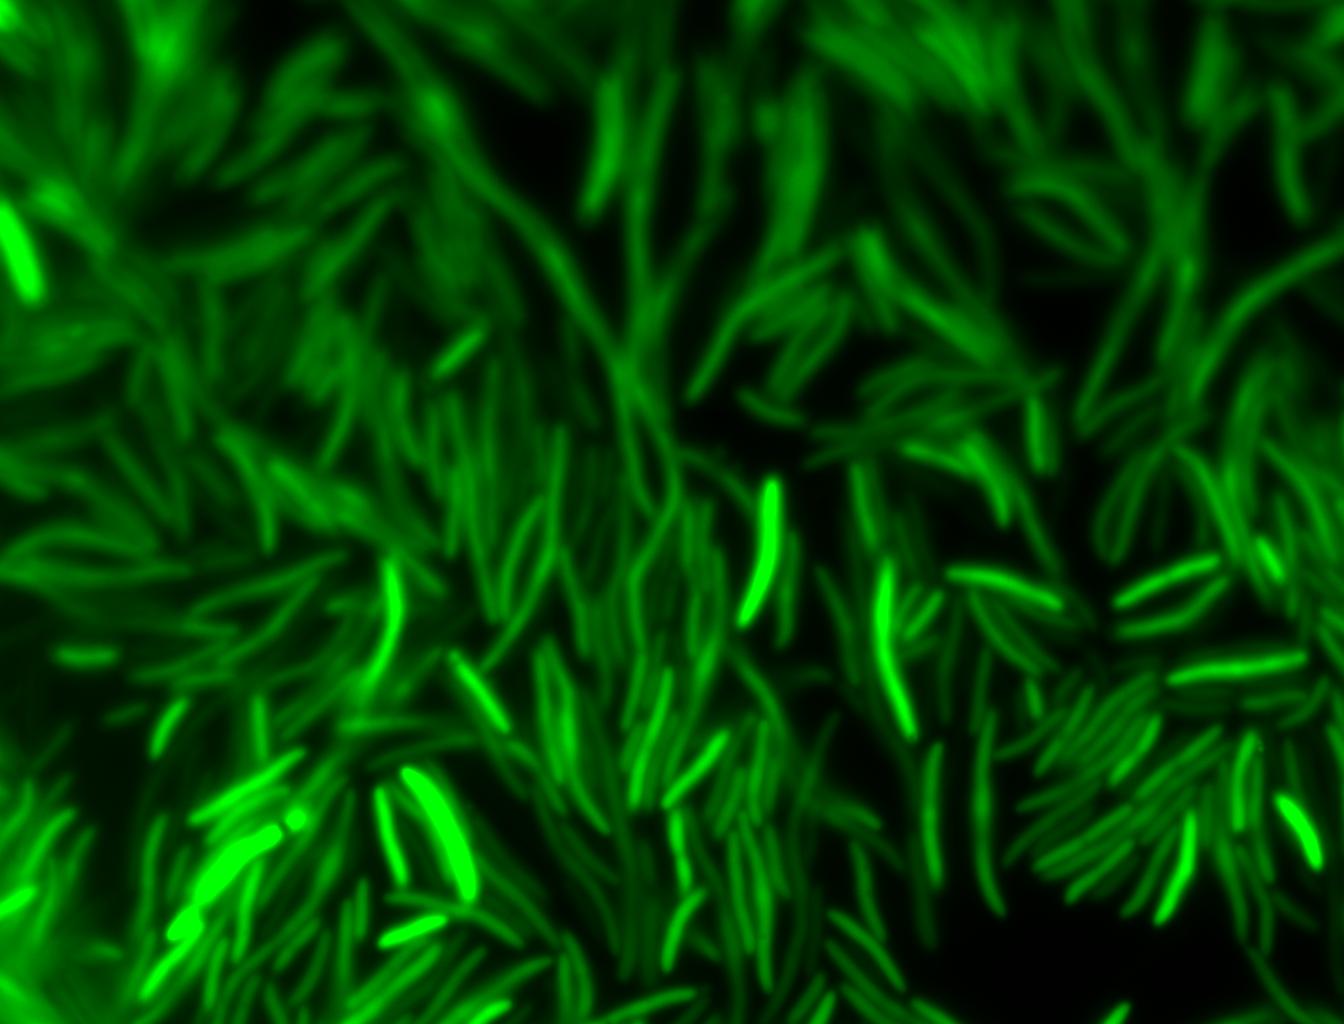
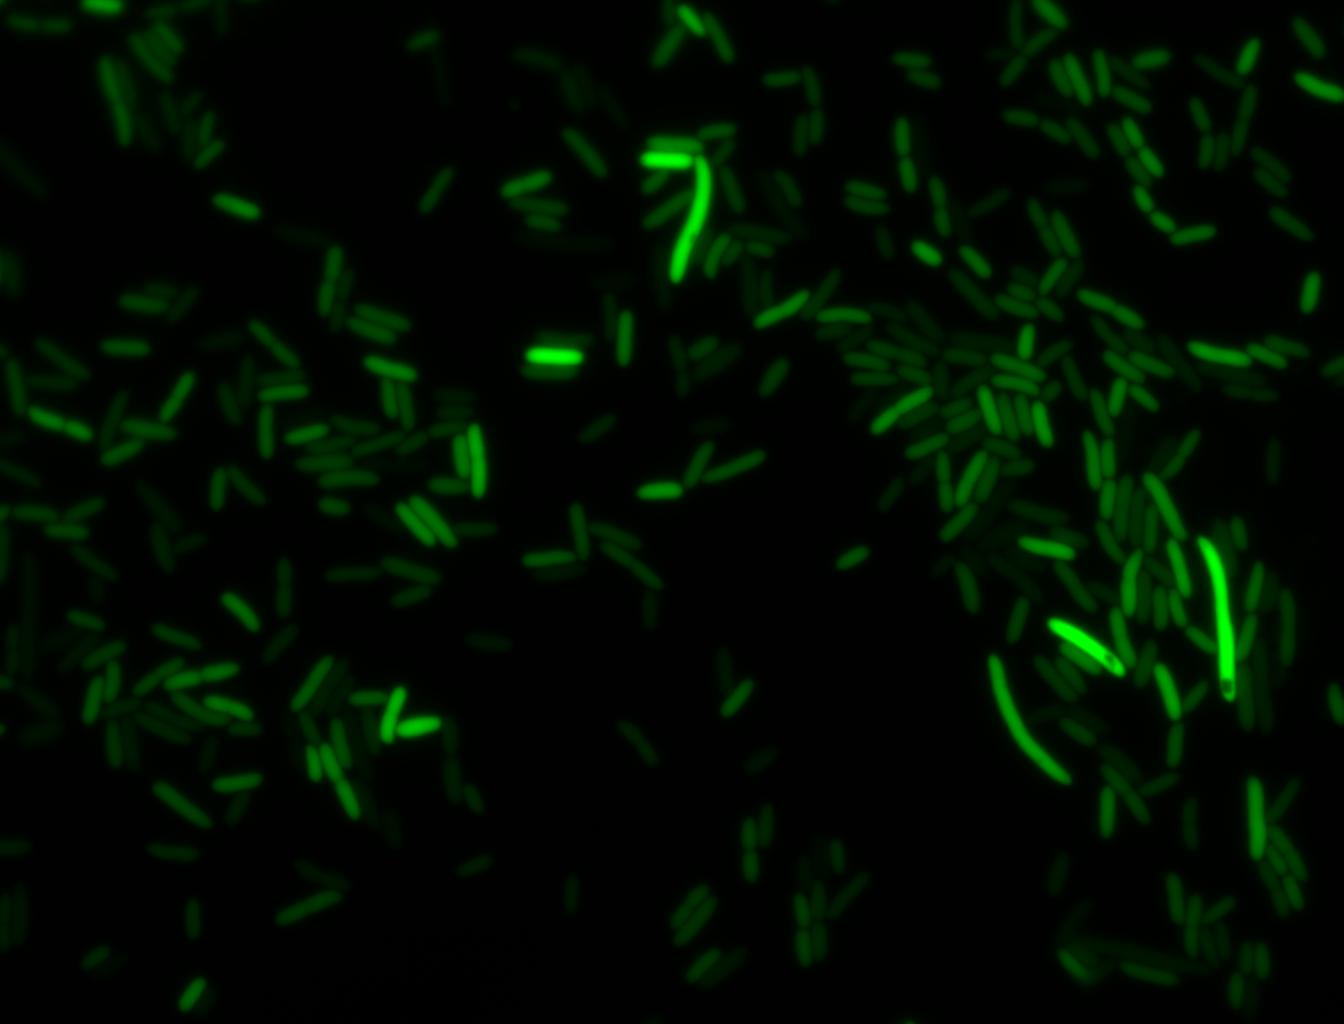
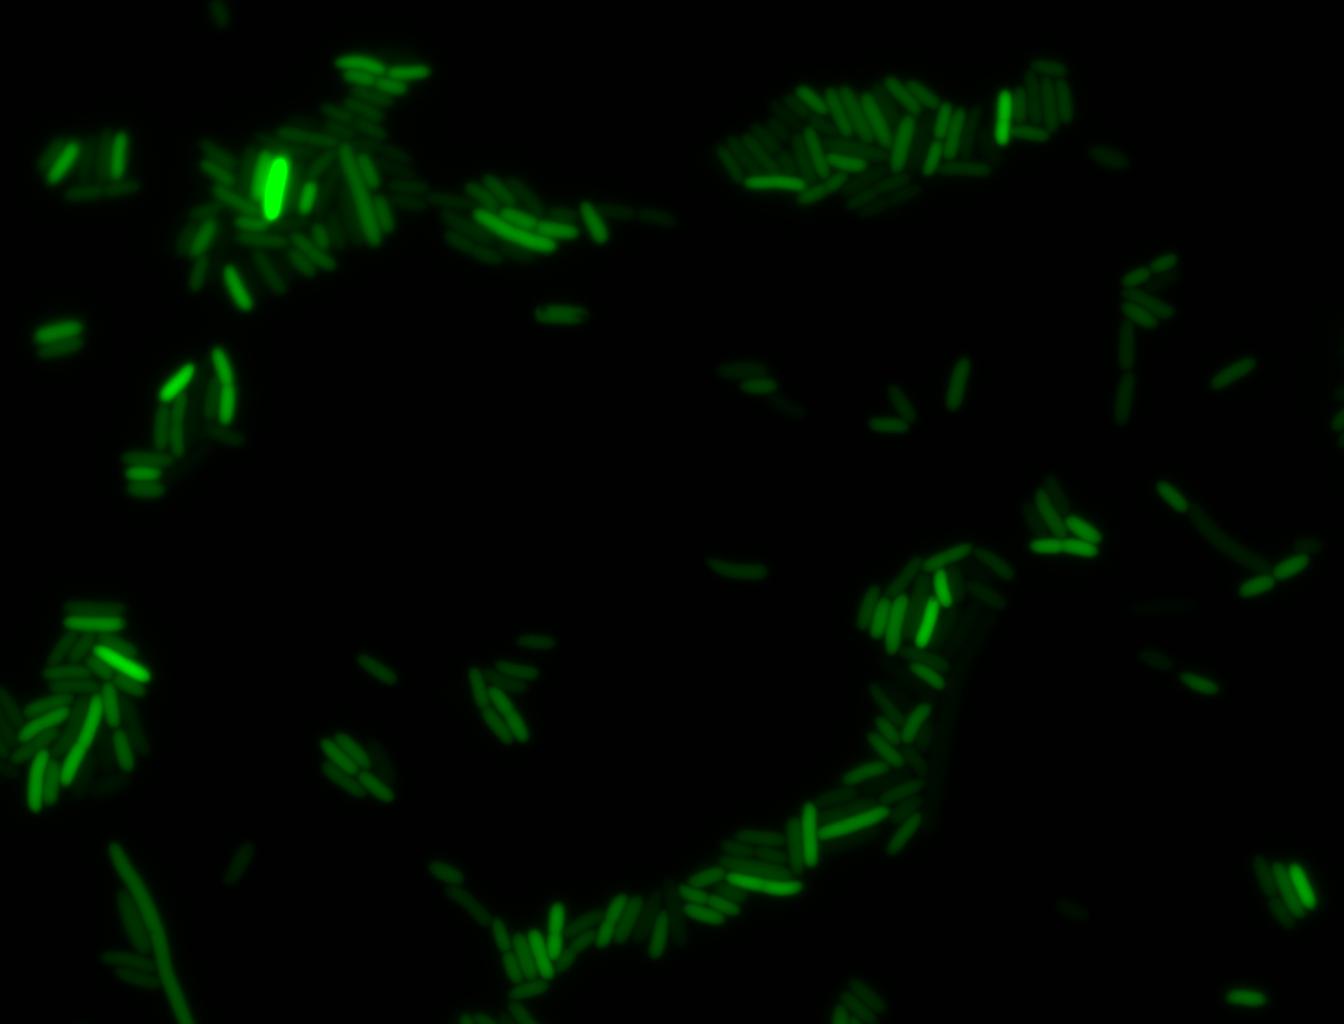
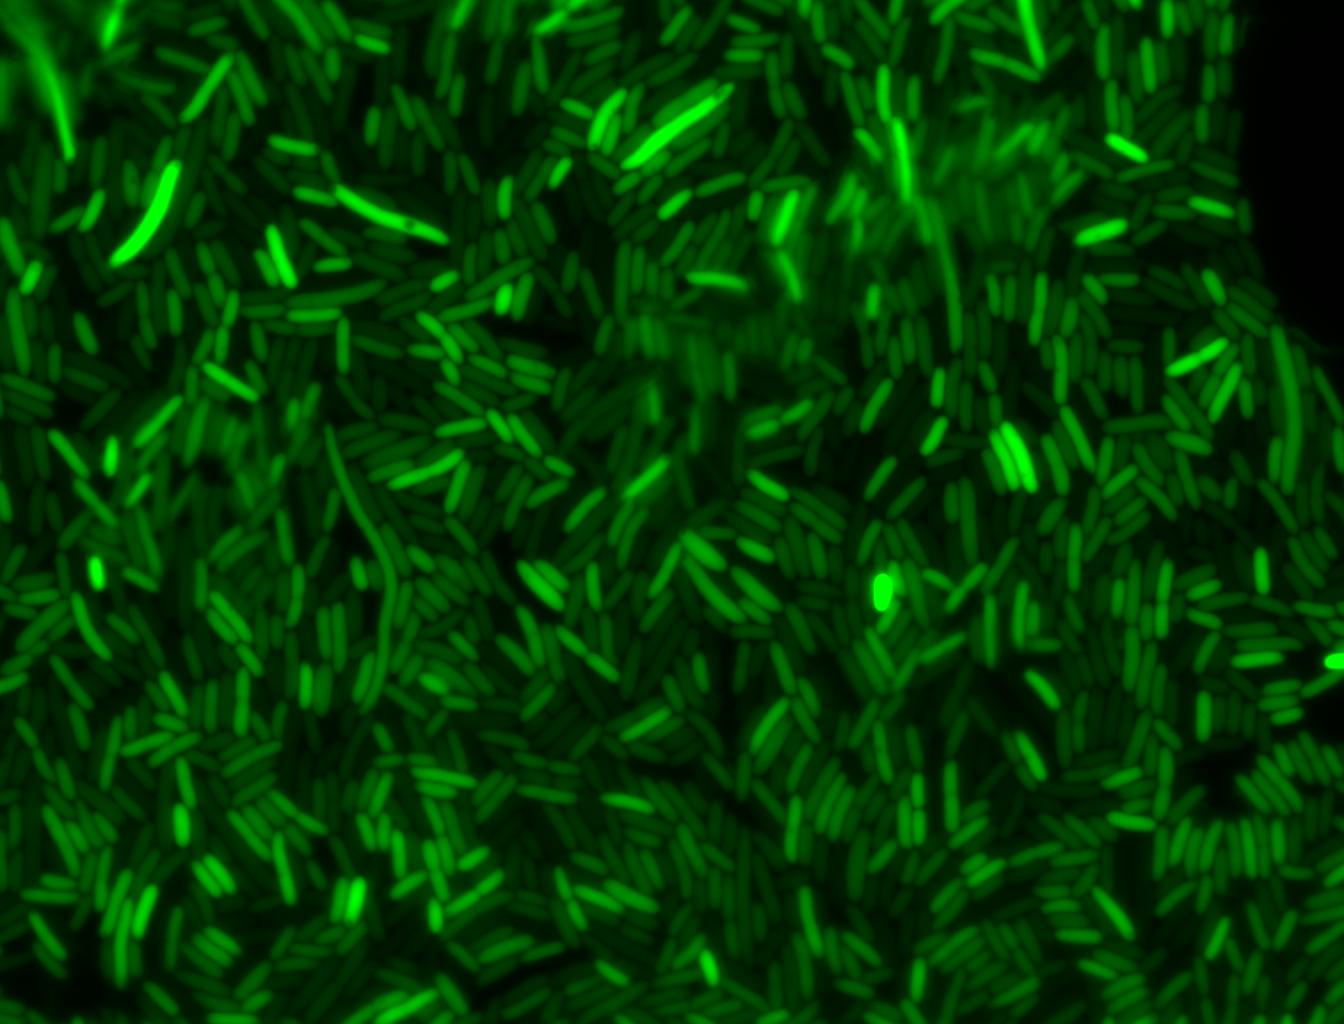
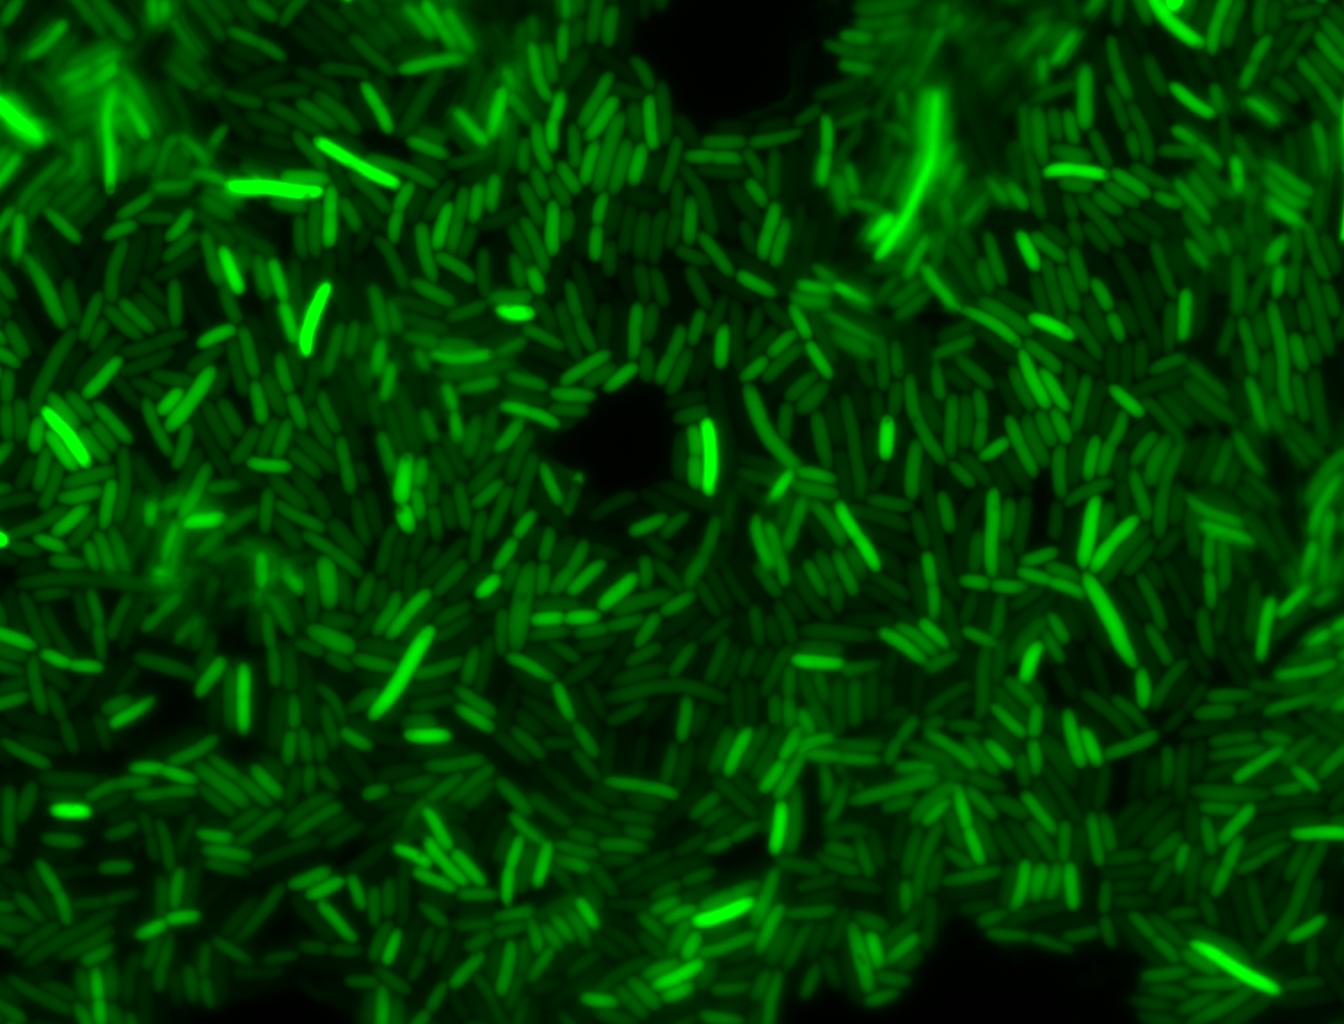
| - | DH5α cells contained in the images below | + | DH5α cells contained in the images below-visualized by an optical microscope with a GFP-specific filter- were incubated at 42°C for 10 minutes. |
| + | ======Images of Cells at t=0 min (Before Heat Shock)====== | ||
| - | [[Image: | + | [[Image:T0_HSP-GFP_4(FITC).jpg|400px]][[Image:T0_HSP-GFP_6(FITC).jpg|400px]] |
| + | |||
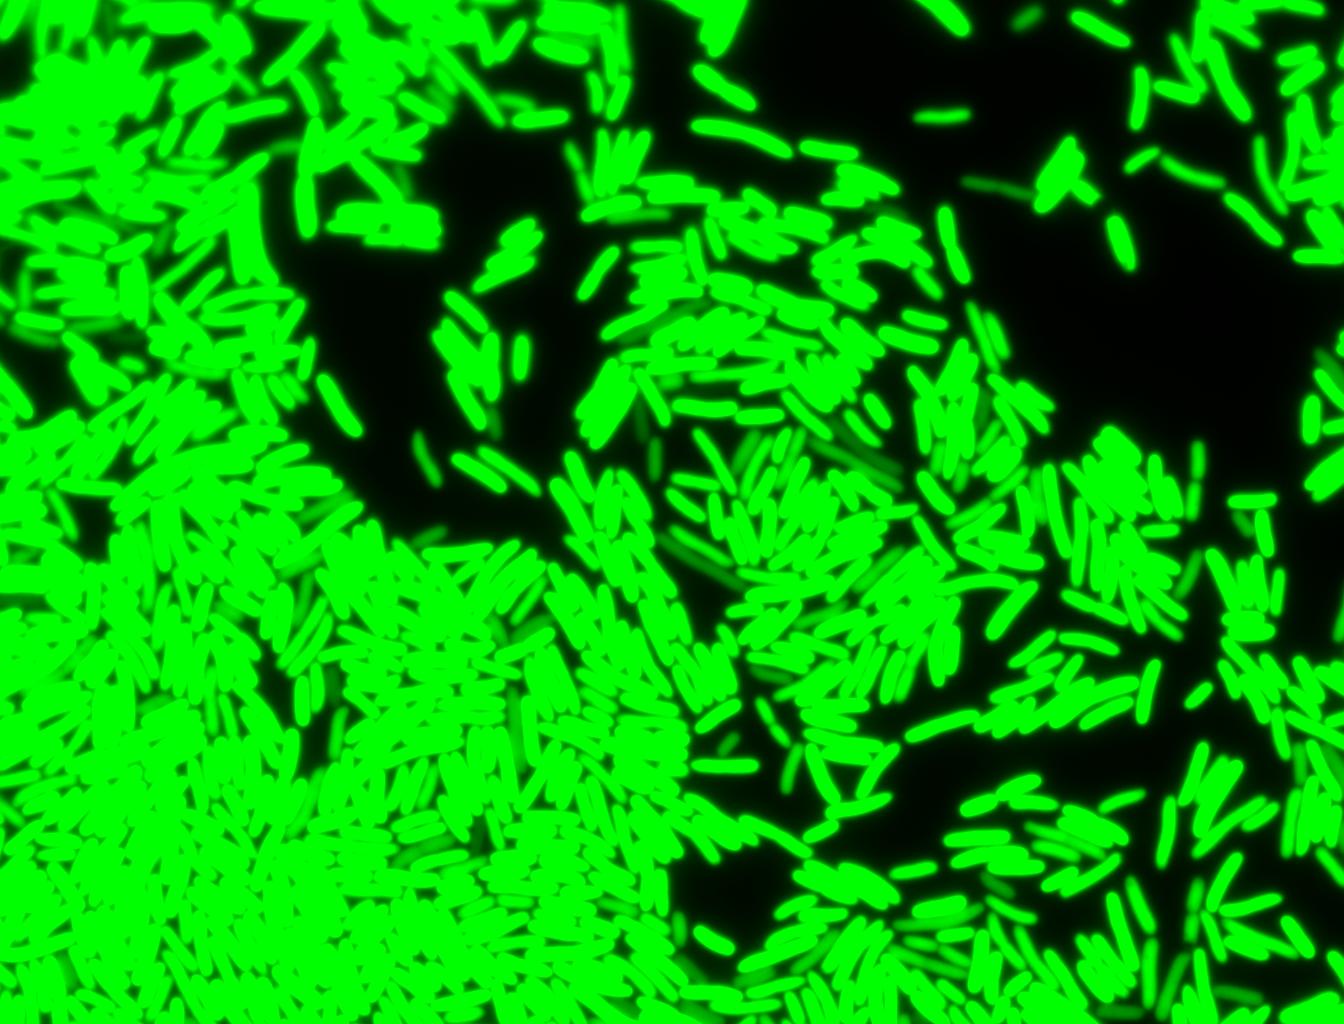
| + | Control: cells containing only GFP at t=0 | ||
| + | |||
| + | [[Image:T0_GFP_12(FITC).jpg|400px]] | ||
| + | |||
| + | ======Images of Cells at t=10 min====== | ||
| + | |||
| + | [[Image:T10_HSP-GFP_27(FITC).jpg|400px]][[Image:T10_HSP-GFP_29(FITC).jpg|400px]] | ||
| + | |||
| + | Control: cells containing only GFP at t=10 | ||
| + | |||
| + | [[Image:T10_GFP_36(FITC).jpg|400px]] | ||
| + | |||
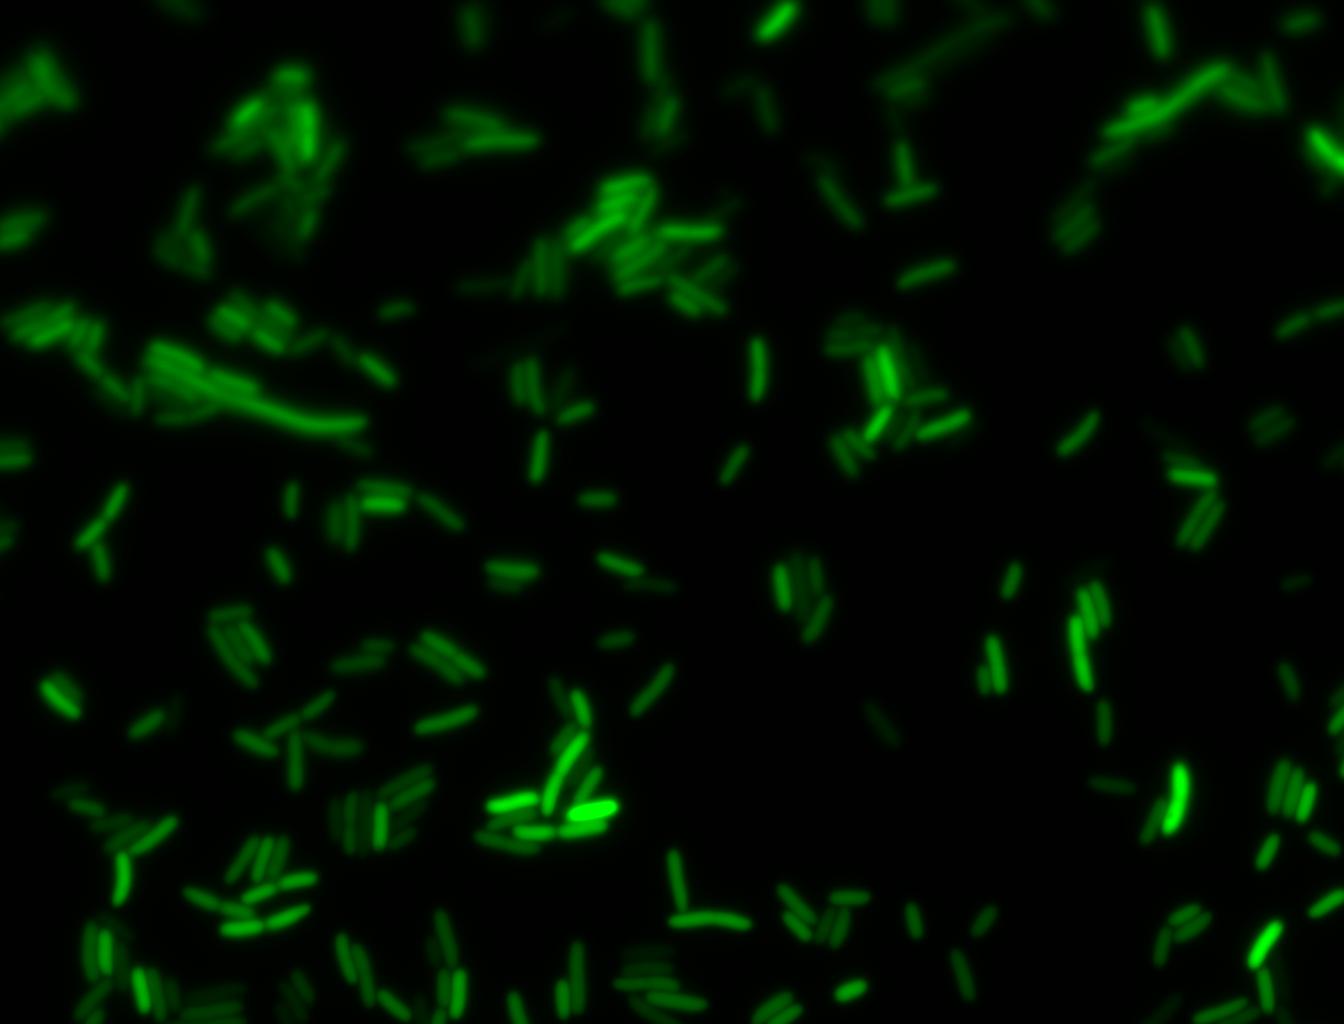
| + | ======Images of Cells at t=60 min====== | ||
| + | |||
| + | [[Image:T1hr_HSP-GFP_39(FITC).jpg|400px]][[Image:T1hr_HSP-GFP_40(FITC).jpg|400px]] | ||
| + | |||
| + | Control: cells containing only GFP at t=60 | ||
| + | |||
| + | [[Image:T1hr_GFP_47(FITC).jpg|400px]] | ||
| + | |||
| + | =====Glucose===== | ||
| + | |||
| + | An interesting observation was made: when adding 20 mM of glucose to the media at the time of growth,the cells are no longer morbidly elongated at the time of imaging. | ||
| + | |||
| + | ======Images of Cells at t=0 min (Before Heat Shock)====== | ||
| + | |||
| + | [[Image:T0_HSP-GFP-glu_8(FITC).jpg|400px]][[Image:T0_HSP-GFP-glu_10(FITC).jpg|400px]] | ||
| + | |||
| + | ======Images of Cells at t=10 min====== | ||
| + | |||
| + | [[Image:T10_HSP-GFP-glu_30(FITC).jpg|400px]][[Image:T10_HSP-GFP-glu_32(FITC).jpg|400px]] | ||
| + | |||
| + | ======Images of Cells at t=60 min====== | ||
| + | |||
| + | [[Image:T1hr_HSP-GFP-glu_44(FITC).jpg|400px]] | ||
| | ||
}} | }} | ||
Revision as of 03:30, 27 October 2010
|
People
|
<partinfo>BBa_K338001 short</partinfo> This is a modified K112400 heat shock promoter in BBa standard.
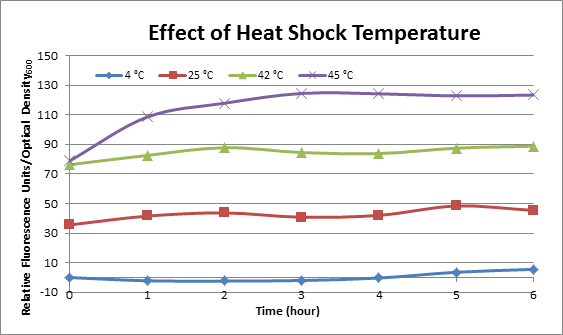
Usage and BiologyBioBrick CharacterizationEffect of Heat Shock TemperatureDH5α cells containing HSP-GFP were incubated at 4°C, 25°C, 42°C, and 45°C separately for two hours. Measurements of the fluorescence level of GFP were taken using the plate reader at 20 minute intervals and were averaged over a 1 hour interval. The vertical axis is raw fluorescence units normalized by OD600. Normalized value of 4°C at t=0 was subtracted from all the values to show a relative difference.
Effect of Heat Shock DurationDH5α cells containing HSP-GFP were heat shocked at 42°C for 0 min (kept at room temperature), 5 min and 10 min separately. Measurements of the fluorescence level of GFP were taken using the plate reader at 15 minute intervals and were averaged over a 1 hour interval. The vertical axis is raw fluorescence units normalized by OD600. The measurements suggest that a heat shock period of 10 minutes significantly increases the production of GFP, while a heat shock period of 5 minutes leads to a similar GFP production level as the untreated cells. Furthermore, the production of GFP shows a decreasing trend after 3 hours suggesting that the heat shock promoter was only activated for a certain time period. DH5α cells contained in the images below-visualized by an optical microscope with a GFP-specific filter- were incubated at 42°C for 10 minutes. Images of Cells at t=0 min (Before Heat Shock)Control: cells containing only GFP at t=0 Images of Cells at t=10 minControl: cells containing only GFP at t=10 Images of Cells at t=60 minControl: cells containing only GFP at t=60 GlucoseAn interesting observation was made: when adding 20 mM of glucose to the media at the time of growth,the cells are no longer morbidly elongated at the time of imaging. Images of Cells at t=0 min (Before Heat Shock)Images of Cells at t=10 minImages of Cells at t=60 min
|
 "
"

