Team:St Andrews/project/modelling/model 1
From 2010.igem.org


Model 1: Single Cell without Feedback
Contents |
Theory & assumptions
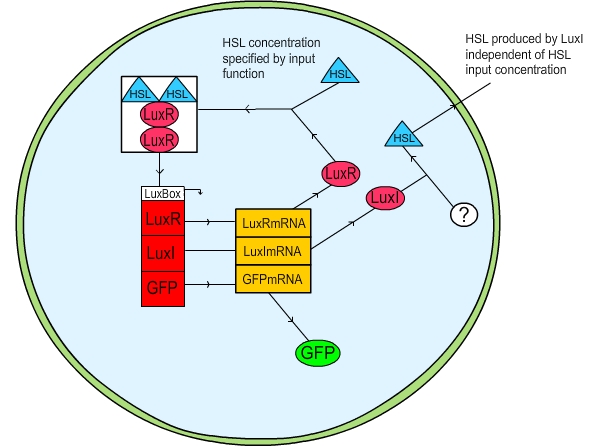
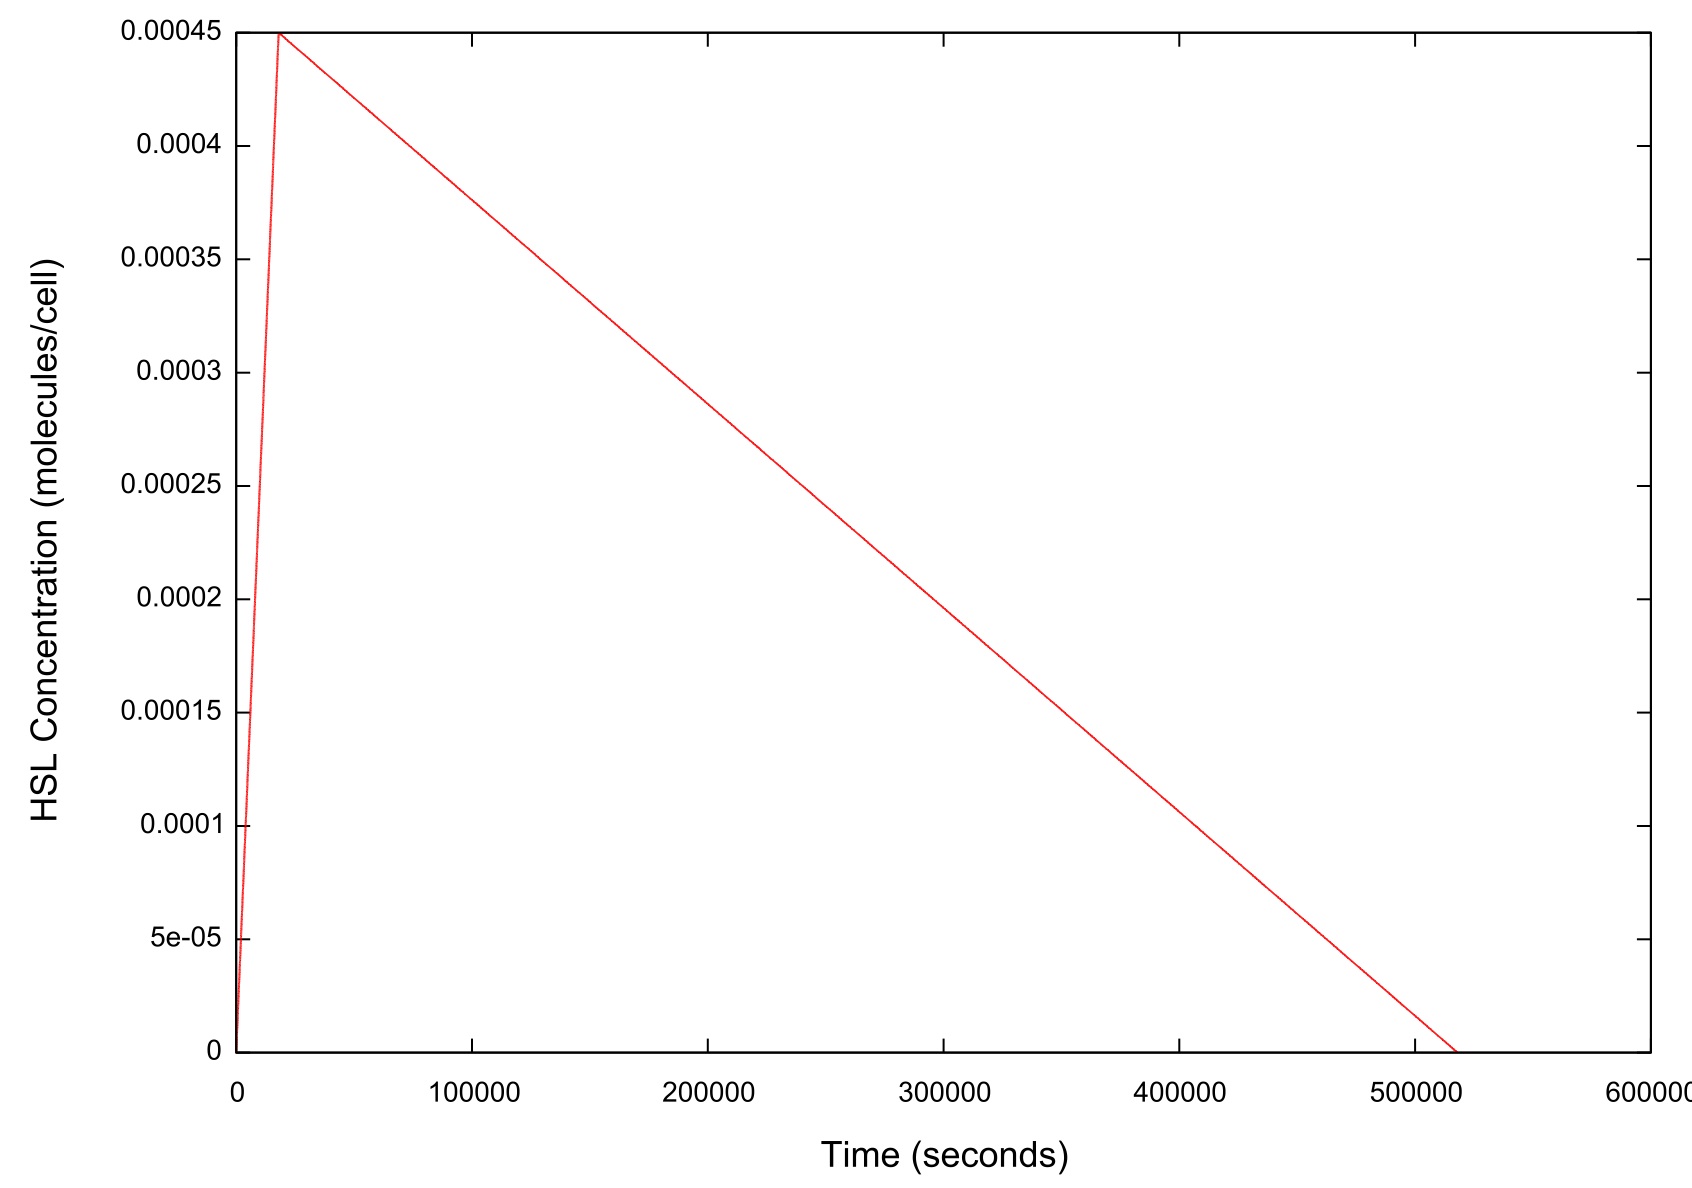
The first method we attempted was to put the user in control of the change in HSL within the cell, and take any HSL produced and remove it from the system entirely. In this fashion a gradual increase in cell density was simulated by a linear “ramp up” of the HSL in the cell; a gradual decrease (presumably due to cell death) was simulated by a linear “ramp down” in HSL. The activation of the cell was measured by plotting the GFP concentration. The practicalities of our code can be viewed here.
Figure 1: Schematic diagram of the LuxR quorum sensing circuit
Parameters
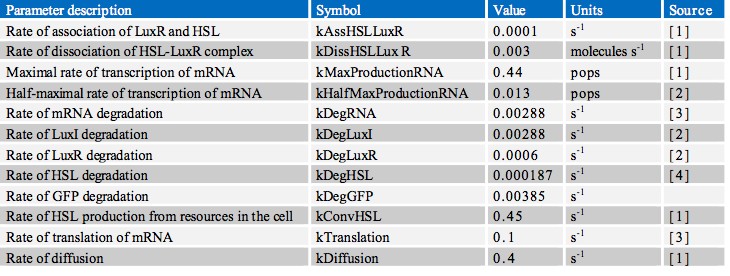
In finding the parameters for our model we searched through a great number of scientific papers in order to collate the various pieces of data which we required. Ultimately however, the most useful resource in our search proved to be the previous work done by other iGEM teams, notably Aberdeen’s Pico Plumber project of 2009. A comprehensive list of all rate constants used is given in the table below:
Results
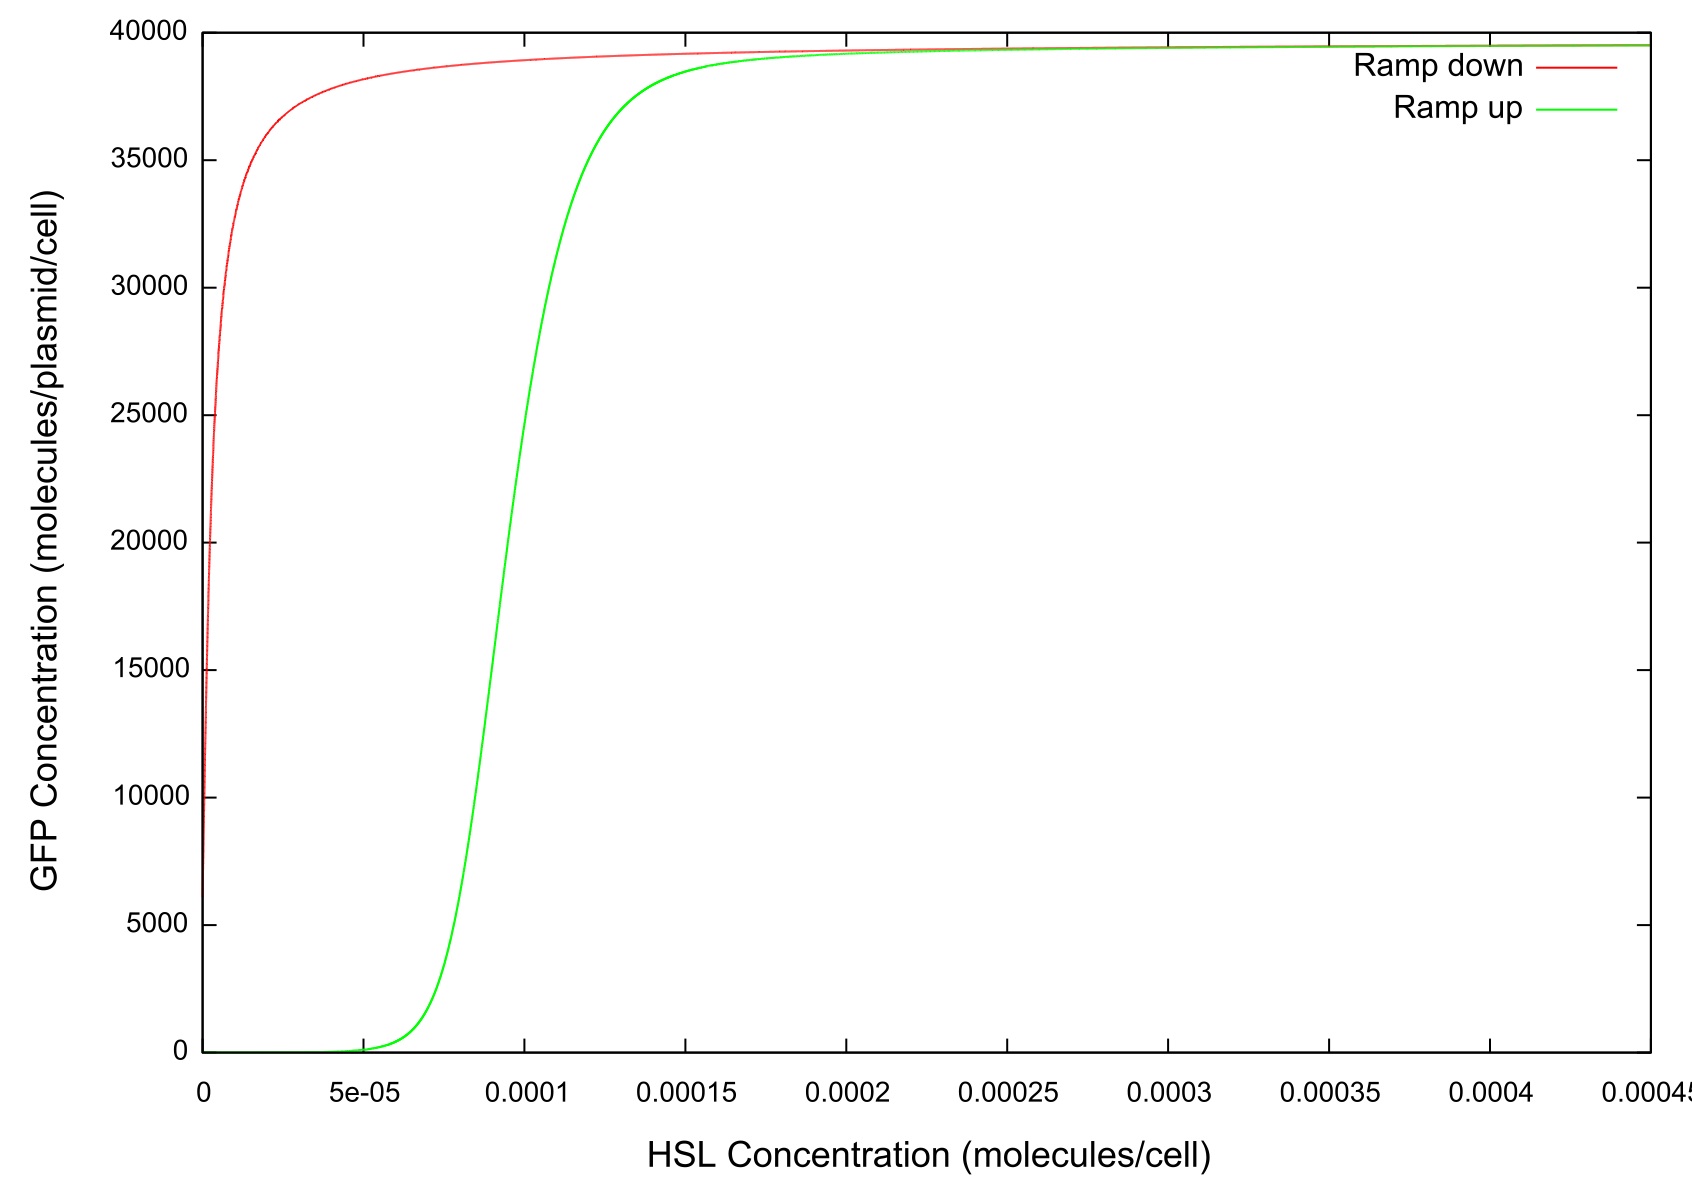
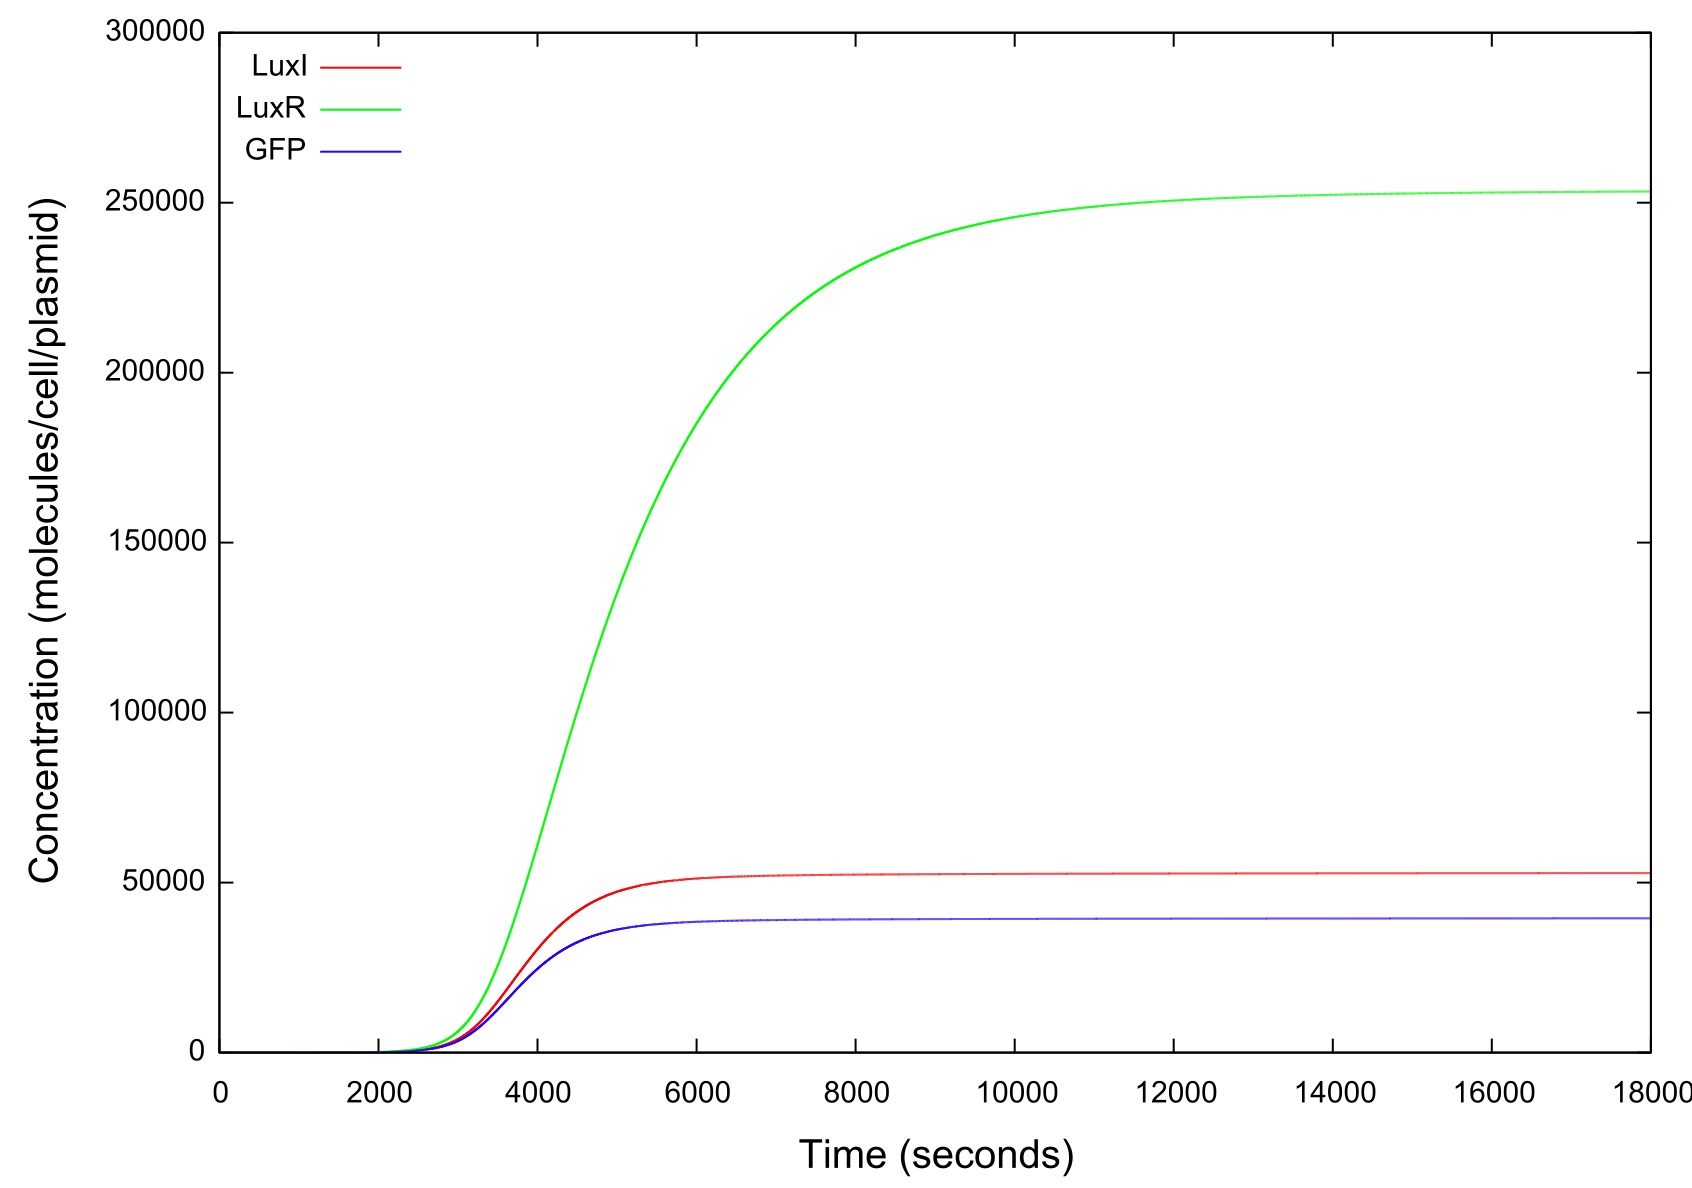
In order to simulate the effect of the cell colony growing in number we first set the change in HSL concentration to a fixed value and ran the model until a steady state was reached. It can be clearly seen from figure that the level of GFP in the cell reaches a point where the concentration starts to sharply increase before a plateau is reached and there is no further activity. This is the switch-on, where the cell has moved from a down-regulated to an up-regulated state and starts to produce greater amounts of HSL, LuxR, LuxI and GFP.
Figure 2: Graph of the HSL input over time
As figure 2 shows, when ramping the HSL down we chose a rate which was significantly slower than that used when performing a ramp up in HSL.
Figure 3: Graph of GFP v HSL
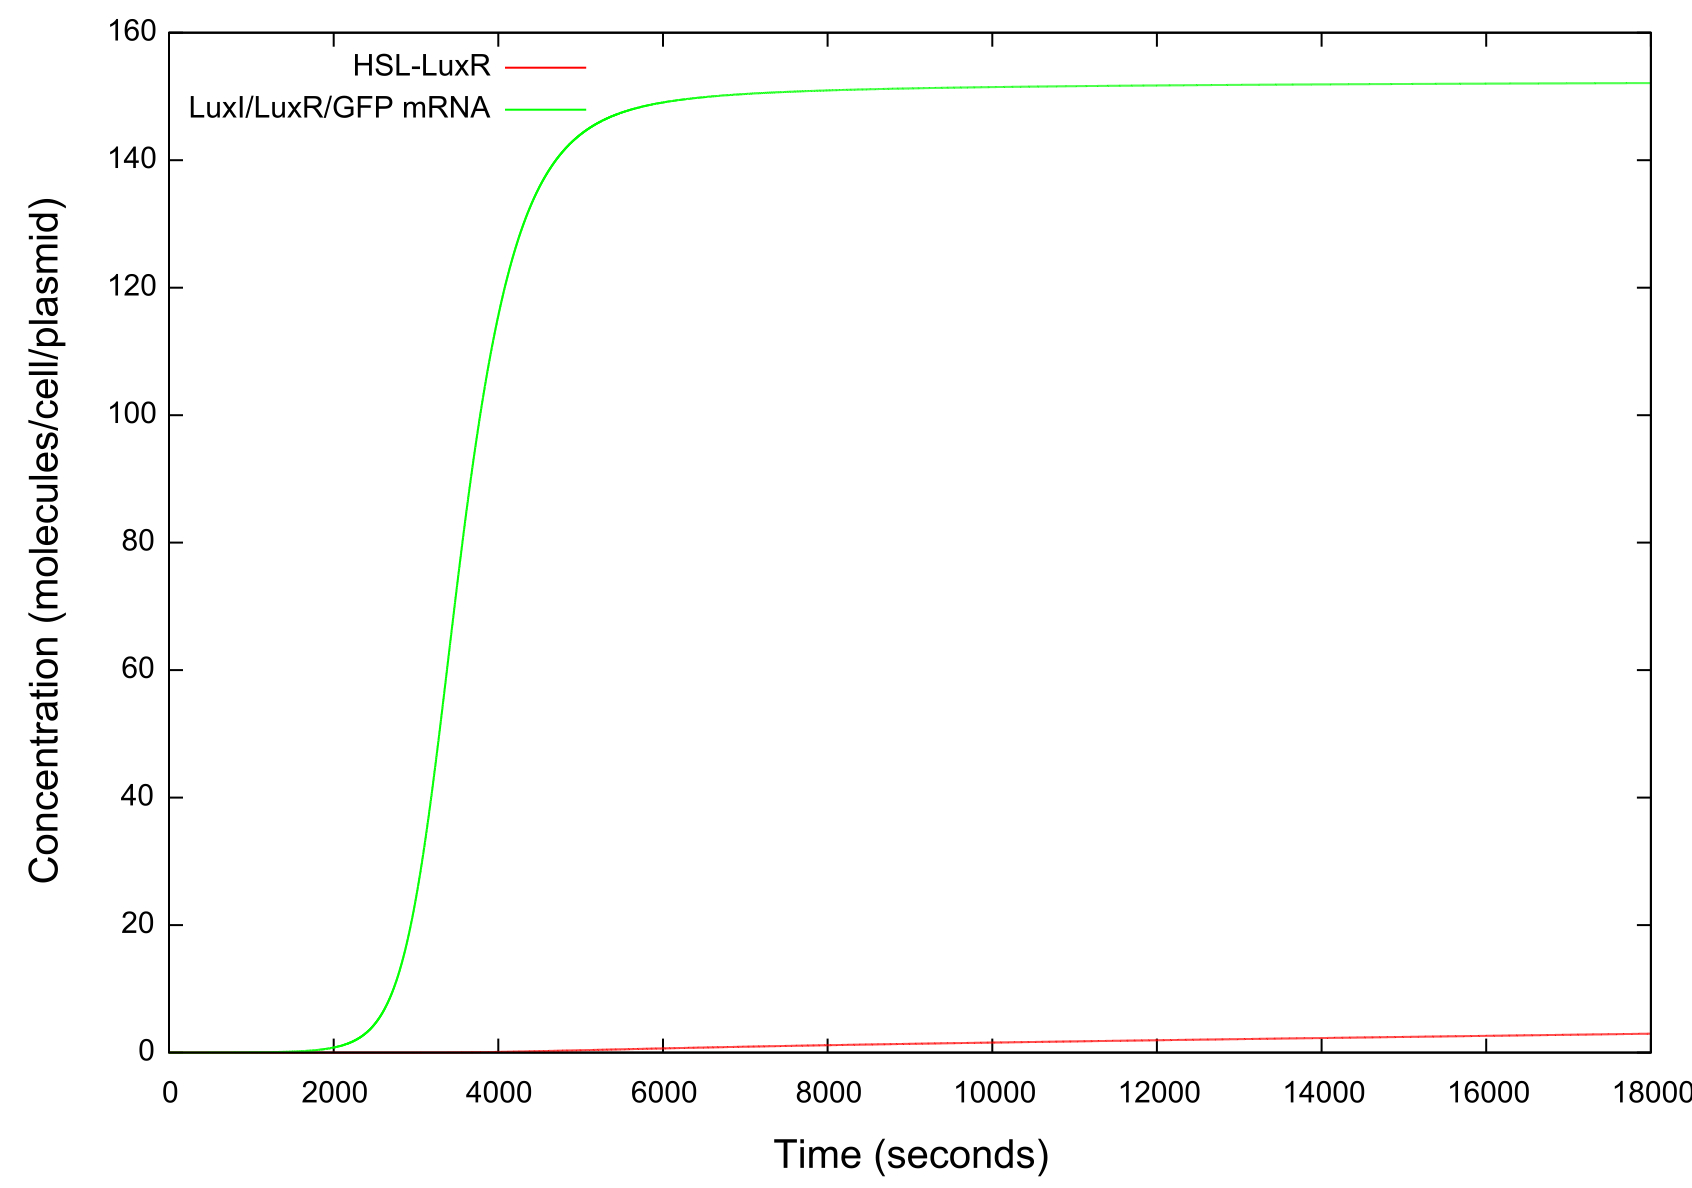
The final values of all the molecules are RNAs are then substituted into the model as the initial values for the next run and the HSL is reduced at a fixed rate, producing the data shown in figure. It can be seen that the up-regulation is maintained for a much lower HSL threshold than when the first run. In fact, the cell never fully returns to a down-regulated state again. After trying to achieve this through decreasing the rate at which the HSL is taken away and increasing the number of increments for which the model is run, it was decided that our model simply did not produce the behaviour we were looking for. Figure shows how the concentrations of the various molecules and the mRNAs changes over the transition from down- to up-regulated states. The model predicts low concentrations of the HSL-LuxR complex which is theoretically predicted, but in general the results were unsatisfactory as to drawing any real conclusions about the causes or otherwise of the bistability.
Figure 4: Graph showing the variation in the concentrations of all the components of the system with time during the HSL up ramp
It should be noted that while figure 4 actually contains plots of the mRNA concentrations and of the HSL-LuxR complex, they are so small when compared to the other components that they cannot be appropriately scaled.
Figure 5: Graph showing the change in concentrations of HSL-LuxR and mRNA with time over the HSL up ramp
Conclusions
Our first model was met with some success in that switching behaviour did seem to be present. However, after further analysis we found that the 'bistability' was not true to what we would expect and so was disregarded. In essence this model was too simplistic for any quantitative purpose and so further work was continued.
References
[1] Goryachev, A.B., D.J. Toh and T. Lee, “System analysis of a quorum sensing network: Design constraints imposed by the functional requirements, network topology and kinetic constant.” BioSystems 2006 83, 178-187
[2] Aberdeen 2009, "Parameters" iGEM wiki, <https://2009.igem.org/Team:Aberdeen_Scotland/parameters>
[3] Alon, Uri. “An Introduction to Systems Biology Design Principles of Biological Circiuts.” London: Chapman & Hall/CRC, 2007
[4] Subhayu Basu, “A synthetic multicellular system for programmed pattern formation.” Nature April 2005, 434, 1130-1134
 "
"
