Team:TU Munich/Lab
From 2010.igem.org
|
|||||||||||||||||||||||||||||||||||||||||||||||||||||||||||||||
|
|
Lab BookExplanation: ksyhbasöuig sdufg houfdug hsdufgh spdoöfgh sdoufg hdöfgh ödiöufgh ldsig hdsifuugsldifug hlsidufug sa sg sdf sdfg .sdf gsfd sdfg sdf gsdf sdff gsdfg sdf gsdfg asdffg sadh esta gesath sath thr. ksyhbasöuig sdufg houfdug hsdufgh spdoöfgh sdoufg hdöfgh ödiöufgh ldsig hdsifuugsldifug hlsidufug sa sg sdf sdfg .sdf gsfd sdfg sdf gsdf sdff gsdfg sdf gsdfg asdffg sadh esta gesath sath thr. ksyhbasöuig sdufg houfdug hsdufgh spdoöfgh sdoufg hdöfgh ödiöufgh ldsig hdsifuugsldifug hlsidufug sa sg sdf sdfg .sdf gsfd sdfg sdf gsdf sdff gsdfg sdf gsdfg asdffg sadh esta gesath sath thr.
Week1 [REDBOX] Week2 [REDBOX] [BLUEBOX] Week3 [REDBOX] ProtocolsMolecular BiologyPCR
So geht ne PCR CloseDigestion
So geht ne PCR CloseIn vivo measurement
So haben wir in vivo gemessen CloseIn vitro measurement
So haben wir in vitro gemessen Close
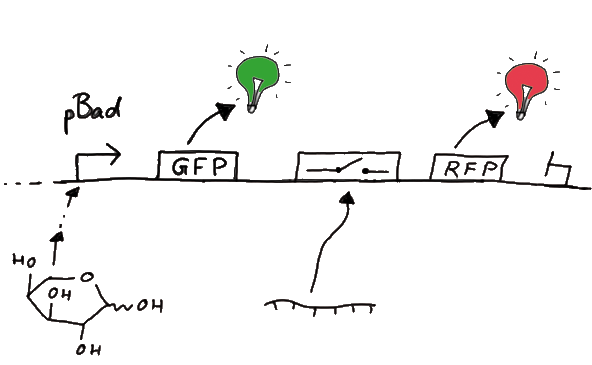
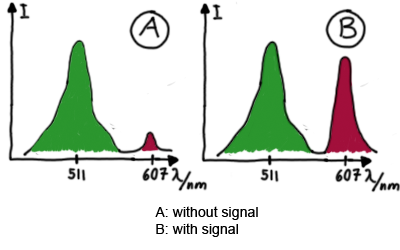
ExperimentsWe designed several experiments to test our switches, all of them based on fluorescence measurements. We designed experiment setting for measurements in vivo as well as in vitro. Our in vitro measurements relied on two different experiment set-ups. While the first was based on a commercial E. coli-lysate, the latter was reporting on a transcriptional level only, eliminating most of the possible side-effects one could expect in the complex behaviour of a living cell or cell-lysate. Read more The ExperimentsFluorescent proteins as reporterOur initial idea to prove our concept of antitermination was to use flourescent proteins as reporters. This approach gives the opportunity to measure the termination and antitermination efficiency of our designed BioBricks in vivo as well as in vitro, the latter using a translation kit based on E. coli lysate.
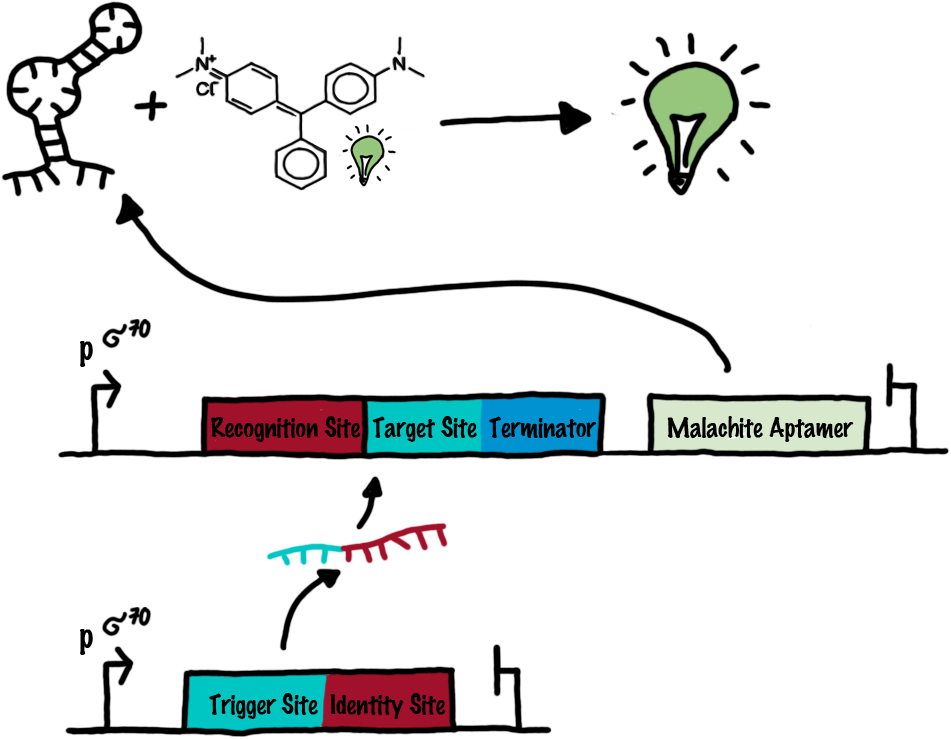
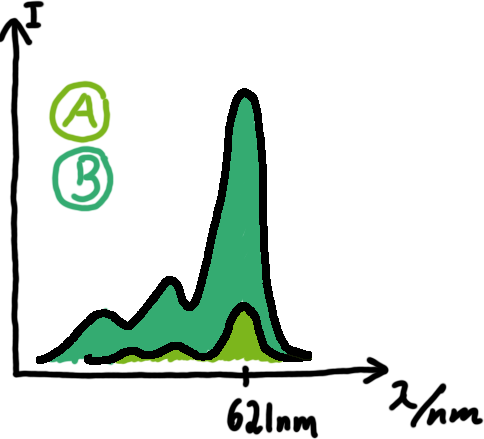
Wiith these measurements, it should also be possible to observe differences in efficiency of termination as well as antitermination between our designed switches. Measurements with the malachite green aptamer as reporterA second possibility to measure parameters of our switches we came up with, was the idea to investigate our system on the transcriptional level only. Therefore, we decided to use malachite green as reporter. Malachite green in a fluorescent dye, whose emission increasing dramaticly (about 3000 times) upon binding of a specific RNA-aptamer. ---concept to be desribed, as well as literature---
<ref>refs</ref>
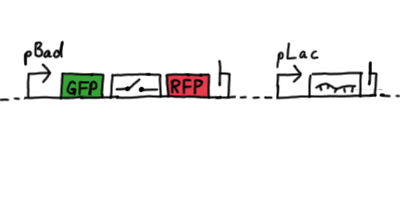
Also we made constructs, where the transcription of the signal-RNA is under the control of a sigma(70) promoter. These two linear DNA-constructs, together with the e.coli RNA-polymerase and the right buffer conditions should represent an easy-to-handle measurement kit on the transcriptional level.
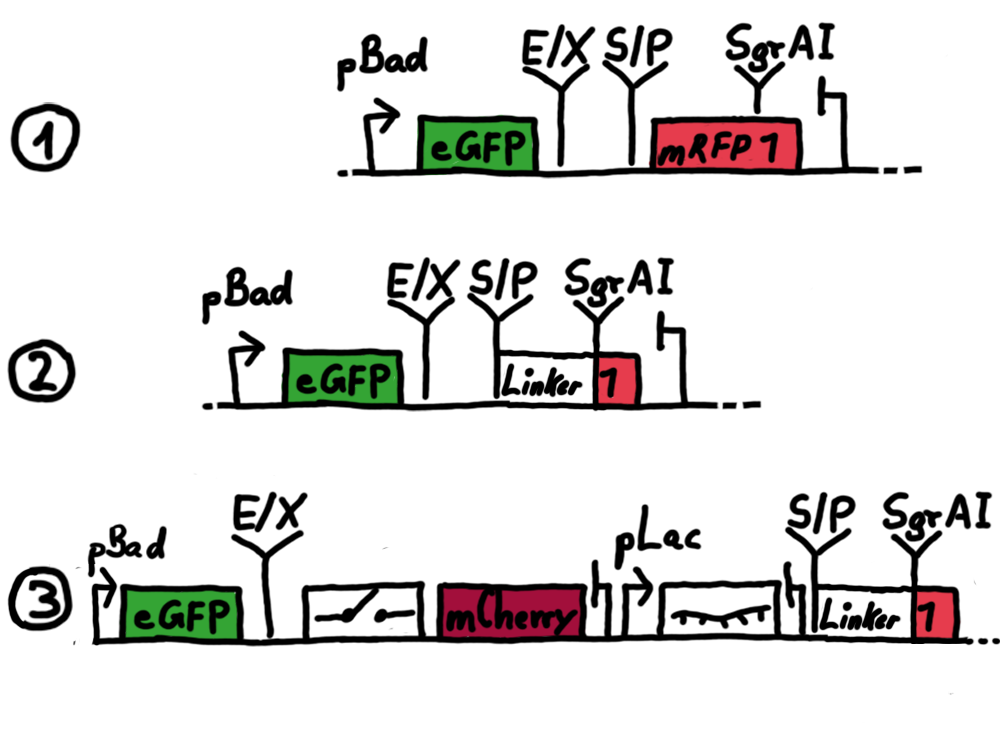
ResultsWe ...blablabla Read more Flourescent proteinsUnfortunatly, we had to change the reporter construct two times during our experiments as several problems occured in our measurements: First Try: based on the measurement plasmid pSB1A10At the beginning, we decided to use the reporter plasmid [http://partsregistry.org/Part:pSB1A10 pSB1A10] from the registry. It consists of the fluorescent proteins eGFP and mRFP1. Each sequence includes a ribosome binding site and a stop-codon; the two genes are divided by a cloning side including the BioBrick cleavage sites.In front of the eGFP sequence, the plasmid includes an arabinose-inducable promoter. The plasmid also contains an ampicilline resistence. We cloned our switches into the cloning site of the measurement plasmid and used an empty cloning site as control; our signal-RNAs we cloned into the [http://partsregistry.org/Part:pSB1K3 pSB1K3] vector, together with the BioBricks R0011 (Lac promoter) and B0014 (double terminator of transcription). Afterwards, we cut pSB1K3 with Aat2 and Pst1 and pSB1A10 with Nsi1 and Aat2 and ligated those fragments of each plasmid that contained our Bricks to get a Monsterplasmid. We transformed BL21(DE3) cells with the plasmid. We set up cultures, induced the arabinose promoter and measured the GFP and mRFP1 excitation/emission spectra within time.
Second Try: A measurement plasmid of our own designTo design our own plasmid to overcome the problems that occurred in our first try gave us tghe possibility to overcome several other problems: Third Try: One promoter for each proteinWe decided to use the measuremnt plasmid we developed in our second try but to clone another L-arabinose induced promoter into the plasmid, in front of our switch followed by the mCherry sequence. In this way, we still can use GFP fluorescence as internal control, because both protein transcription is under the control of a promoter of identical design. Though we are still not able to tell exactly why our previous measurements did not work, but with this construct we measured the first time fluorescence of the mCherry protein in our positive control.
On this page you can find our protocols for standard molecular biology procedure as well as the full notebook containing lab progress. ProtocolsGelsAgarose Gels
Running of Gels mix samples 1:1 with formamide loading dye (stored @ -20°C) carefully remove comb blow air into pockets with a 50 µl syringe fill samples into pockets run the gel (usually about 200 V) PCR
used protocols
|
||||||||||||||||||||||||||||||||||||||||||||||||||||||||||||||
| Application | DNA Binding Buffer : Sample | Example |
| Plasmid, genomic DNA (>2 kb) | 2 : 1 | 200 μl : 100 μl |
| PCR, cDNA, DNA fragment | 5 : 1 | 500 μl : 100 μl |
| ssDNA (e.g., M13 phage) | 7 : 1 | 700 μl : 100 μl |
- Transfer mixture to a provided Zymo-Spin™ Column1 in a Collection Tube.
- Centrifuge at ≥10,000 x g for 30 seconds. Discard the flow-through.
- Add 200 μl Wash Buffer to the column. Centrifuge at ≥10,000 x g for 30 seconds. Repeat wash step.
- Add ≥6 μl water2,3 directly to the column matrix. Transfer the column to a 1.5 ml microcentrifuge tube and centrifuge at ≥10,000 x g for 30 seconds to elute the DNA.
Ultra-pure DNA in water is now ready for use.
QIAquick purification Kit
[http://www1.qiagen.com/literature/render.aspx?id=103715 Handbook]
Procedure
1. Add 5 volumes of Buffer PB to 1 volume of the PCR sample and mix. It is not necessary to remove mineral oil or kerosene. For example, add 500 μl of Buffer PB to 100 μl PCR sample (not including oil).
2. If pH indicator I has beein added to Buffer PB, check that the color of the mixture is yellow. If the color of the mixture is orange or violet, add 10 μl of 3 M sodium acetate, pH 5.0, and mix. The color of the mixture will turn to yellow.
3. Place a QIAquick spin column in a provided 2 ml collection tube.
4. To bind DNA, apply the sample to the QIAquick column and centrifuge for 30–60 s. We changed it to 3 min @ 6000rpm !
5. Discard flow-through. Place the QIAquick column back into the same tube. Collection tubes are re-used to reduce plastic waste.
6. To wash, add 0.75 ml Buffer PE to the QIAquick column and centrifuge for 30–60 s.
7. Discard flow-through and place the QIAquick column back in the same tube. Centrifuge the column for an additional 1 min.repeat!
IMPORTANT: Residual ethanol from Buffer PE will not be completely removed unless the flow-through is discarded before this additional centrifugation.
8. Place QIAquick column in a clean 1.5 ml microcentrifuge tube.
9. To elute DNA, add 50 μl Buffer EB (10 mM Tris·Cl, pH 8.5) or water (pH 7.0–8.5) to the center of the QIAquick membrane and centrifuge the column for 1 min. Alternatively, for increased DNA concentration, add 30 μl elution buffer to the center of the QIAquick membrane, let the column stand for 1 min, and then centrifuge.
IMPORTANT: Ensure that the elution buffer is dispensed directly onto the QIAquick membrane for complete elution of bound DNA. The average eluate volume is 48 μl from 50 μl elution buffer volume, and 28 μl from 30 μl elution buffer. Elution efficiency is dependent on pH. The maximum elution efficiency is achieved between pH 7.0 and 8.5. When using water, make sure that the pH value is within this range, and store DNA at –20°C as DNA may degrade in the absence of a buffering agent. The purified DNA can also be eluted in TE buffer (10 mM Tris·Cl, 1 mM EDTA, pH 8.0), but the EDTA may inhibit subsequent enzymatic reactions.
10. If the purified DNA is to be analyzed on a gel, add 1 volume of Loading Dye to 5 volumes of purified DNA. Mix the solution by pipetting up and down before loading the gel.
Gel samples
ZYMO RESEARCH Gel DNA Recovery Kit
[http://www.acgtinc.com/PDF_files/Sample%20Prepation_ACGT/Zymoclean%20Gel%20DNA%20Recovery%20Kit_Zymo%20Research.pdf Product informartion]
Protocol
- Excise the DNA fragment1 from the agarose gel using a razor blade or scalpel and transfer it to a 1.5 ml microcentrifuge tube.
- Add 3 volumes of ADB to each volume of agarose excised from the gel (e.g. for 100 μl (mg) of agarose gel slice add 300 μl of ADB).
- Incubate at 37-55 °C for 5-10 minutes until the gel slice is completely dissolved2. For DNA fragments >8 kb, following the incubation step, add one additional volume (equal to that of the gel slice) of water to the mixture for better DNA recovery (e.g. 100 μl agarose, 300 μl ADB and 100 μl water).
- Transfer the melted agarose solution to a Zymo-SpinTM I Column in a Collection Tube.
- Centrifuge at ≥10,000 x g for 30-60 seconds. Discard the flow-through.
- Add 200 μl of Wash Buffer to the column and centrifuge at ≥10,000 x g for 30 seconds. Discard the flow-through. Repeat the wash step.
- Add ≥6 μl of water3,4 directly to the column matrix. Place column into a 1.5 ml tube and centrifuge ≥10,000 x g for 30-60 seconds to elute DNA.
Ultra-pure DNA in water is now ready for use.
- add other kits here...
Restriction
| Enzyme | 10 units is sufficient, generally 1µl is used |
| DNA | 1 µg |
| 10X NEBuffer | 5 µl (1X) |
| BSA | Add to a final concentration of 100 µg/ml (1X) if necessary |
| Total Reaction Volume | 50 µl |
| Incubation Time | 1 - 1.5 hour |
| Incubation Temperature Enzyme dependent |
XbaI, SpeI, PstI, SpeI : 37 °C |
[http://www.neb.com/nebecomm/tech_reference/restriction_enzymes/buffer_activity_restriction_enzymes.asp activity of restriction enzymes in NEB buffers]
Biobrick standard
[http://openwetware.org/wiki/Restriction_digest Protocols for IGEM standard digestion]
Dephosphorylation
using Antarctic Phosphatase
- Add 1/10 volume of 10X Antarctic Phosphatase Reaction Buffer to 1-5 µg of DNA cut with any restriction endonuclease in any buffer.
- Add 1 µl of Antarctic Phosphatase (5 units) and mix.
- Incubate for 15 minutes at 37°C for 5´ extensions or blunt-ends, 60 minutes for 3´ extensions.
- Heat inactivate (or as required to inactivate the restriction enzyme) for 5 minutes at 65°C.
- Proceed with ligation.
[http://www.neb.com/nebecomm/products/protocol76.asp from NEB]
Ligation
Using T4 Ligase, New England Labs
- 1 µl T4 Ligase (10.000 U)
- 50 ng plasmid
- 3x mol(plasmid) insert
- 2 µl T4 Ligase 10x buffer
- add H2O to reach final volume of 20 µl
- incubation at 22°C for 1 h
- storing at 16 °C for 40 min
Biobrick Standard
[http://parts2.mit.edu/wiki/index.php/Standard_Assembly Standard BioBrick assembly]
Transformation
At Woehlke's S1-Lab !!!
- Thaw competent cells on Ice
- Add DNA, pipette gently to mix
- Let sit for 30 minutes on ice
- Incubate cells for 45 seconds at 42°C
- Incubate cells on ice for 2 min
- Add 1 ml LB0
- Incubate for 1 hour at 37oC on shaker
- Spread 100-300 μl onto a plate made with appropriate antibiotic.
- Grow overnight at 37 °C.
- Save the rest of the transformants in liquid culture at 4 °C
modified from [http://openwetware.org/wiki/Transforming_chemically_competent_cells open wetware]
Miniprep
Preparation of BioBricks from distribution 2008
Sequencing
- Monsterplasmids contain GATC-Standard-Primer pBR1 (CGAAAAGTGCCACCTGAC ) directly in front of AATII cleavage site.
- Monsterplasmids contain GATC-Standard-Primer pGFP-FP () approx. 100 bp upstream of Biobrick insert site.
!!! Please always fill in iGEM-Sequencing-YYMMDD (e.g. iGEM-Sequencing-100625 for today´s date) as internal billing number!
Notebook
Boxes: for example Cloning --> work done in this week
Week 1 (BOX1) (BOX2)
 "
"


