Team:ETHZ Basel/Modeling/Interworking
From 2010.igem.org
Molecular Models
The network topology
Many bacteria posses a signal transduction network that makes it possible to sense the changes in concentration of a certain chemical attractant/repellent in the extracellular environment and direct the movement towards the attractant and away from the repellent. This property is what is known as ‘chemotaxis’. There are basically two types of movement that the bacterium can employ: 'tumbling', which means change of direction and occurs when the bacterium doesn’t sense an increase of attractant concentration in the extracellular environment anymore and 'running straight', which occurs when the attractant concentration is increasing. The running straight stands for “correct direction, ok, keep going” (towards the attractant/away from repellent) while the tumbling stands for “wrong direction, give it another shot”. In the case of E.coli, these two types of movements correspond to different rotation directions of its 4 flagellar motors (clockwise: tumbling; counter-clockwise: runs).
The direction of rotation of the motors can be determined by the ratio of concentrations of certain proteins inside the cell. That is, there are some quantitative indicators from which one can infer whether the bacterium will run or it will go straight, as a response to changes in input concentration. These indicators (concentration levels for certain proteins) are the result of a well – studied signal transduction network, consisting of membrane receptor proteins and intracellular proteins (Che).
Our models were constructed based on the following network topology:
<no worries, picture to be inserted>
CheW and CheA are localized right next to the membrane, inside the cell. They form a complex together with the receptor clusters on the membrane (which sense the changes in input concentration in the extracellular environment). This complex can be successively methylated (on different methylation states), a constant process done by CheR. In the literature, there are usually 5 methylation sites considered (m = 0,1,2,3,4; m=0 stands for no methylation and m=4 stands for the highest methylation level).
The key process that influences the outcome of the network (tumbling/running) is the autophosphorylation of the protein CheA, which is favoured either by the increase in the methylation state of the membrane complex, done by CheR, or by decreasing attractant concentration.
With decreased attractant (increased repellent) concentration, CheA is autophosphorylated. The phosphoryl groups are being used to produce either CheYp or CheBp. CheYp diffuses through the cytoplasm to the motors, generating clockwise spins, therefore tumbling. CheBp is responsible for de-methylation of the receptors, which reduces the chances of CheA being autophosphorylated, therefore the system is returning to its previous state.
With increased attractant (decreased repellent) concentration, the rate of CheA autophosphorylation is reduced, meaning that there are less phosphate groups available for CheYp and CheBp. Therefore the level of CheYp decreases and the level of CheY increases, which leads to straight runs. Then, the level of CheBp decreases, increasing the chances of CheA being autophosphorylated (since the receptors are methylated by CheR), therefore returning the system again to its previous state.
A perfect model of the chemotaxis pathway should reconstruct a system that exhibits the following characteristics:
• adaptation: the ability to respond to changes in the external environment and return the intracellular protein phosphorylation levels to their pre-stimulus levels.
• sensitivity: even small changes in the concentration of the attractant/repellent trigger chemotactic responses from bacteria.
• gain: the ability to amplify the received signal from the extracellular environment, so as to modulate the intracellular signaling cascade.
• robustness: perturbations of the network’s parameters should not influence the behavior of the system.
Even though the chemotaxis system has been long and in depth studied and it is well documented in the literature (from a modeling point of view), it is to be noted that none of the existing models, accounting for experimental findings, can satisfy all of the above requirments. So, we decided to implement several models to answer our questions.
Tasks for our models
1. Estimate CheYp for no tumbling: we already know from the literature that the tumbling frequency of the bacterium is a function of the concentration of CheY phosphorylated. Therefore, our first task was to determine the concentration of CheYp (defined as the ‘Threshold’) necessary to get a bias (= time not tumbling/total time) of 1 or close enough to 1 so that we could consider that the bacterium exhibits no tumbling (for a given input).
2. Construct the light input: Given the value of CheYp from 1), the second task would be to construct this light input which induces the effect of ‘no tumbling’ (or ‘running straight’). This is to be done by fusing PIF3 (for example) with any of the Che proteins (CheB, CheR, CheZ). The best light input signal is the one for which the bias is close enough to 1 for the highest amount of time (in other words, CheYp stays the most beyond the Threshold).
3. Repeat the previous tasks for different values of the input concentrations (different input values trigger different effects on the bias of the system).
ODE models of the chemotaxis pathway
Spiro (1997)
This model basically predicts that for all Che proteins (CheR, B, Y and Z) would make a good light input. For CheR and CheY the concentration of CheYp drops more than Delta (initial value - Threshold), for CheB and CheZ it increases more than Delta. For all Che proteins the concentrations stay like forever below/above the Threshold, until we deactivate them with far-red light. The best results was obtained for assuming a high ligand concentration (saturation, so that the methylation level of the receptors is high). For CheY and CheZ the reaction times were (as expected), much faster than for CheB and CheR. However, for these proteins the reaction times were still fast enough.
Mello (2003)
This model is already implemented compatible to the Spiro1997 model, but not yet documented.
Rao et al. (2004)
This model predicts quite a similar behavior of the Che proteins, as demonstrated by the previous model. A notable difference is that the response of CheYp level to the change of the level of the other Che proteins is robust to the fluctuations of the ligand (attractant) concentration. In the previous model (Spiro), the most desirable results were obtained only for higher concentrations of the ligand.
A detailed analysis of the simulation results obtained from this model can be found here.
Barkai & Leibler (1997)
The model is implemented, but not yet documented.
Modeling of the light-input, light-output system
The light-input, light-output system PIF3-PhyB will be used to control spatial localization of key-proteins from chemotaxis. A model will be implemented according to a recent publication. In a next step, this model will be integrated with the existing chemotaxis models to predict photo-activation / -deactivation by the experimental setup.Status: implemented; documentation required
Combinations of the molecular models
Light-input system coupled to chemotaxis model (Sorokina/Mello)
The Sorokina model will be coupled to the Mello model.Status: in development
Stochastic model
The stochastic features of the chemotaxis pathway seem to be quite strongly expressed, so we also looked into stochastic simulation models. The goal was to get a more realistic view over the chemotaxis process and complete the big picture obtained by implementing the above deterministic ODE models.Status: in development.
Movement model
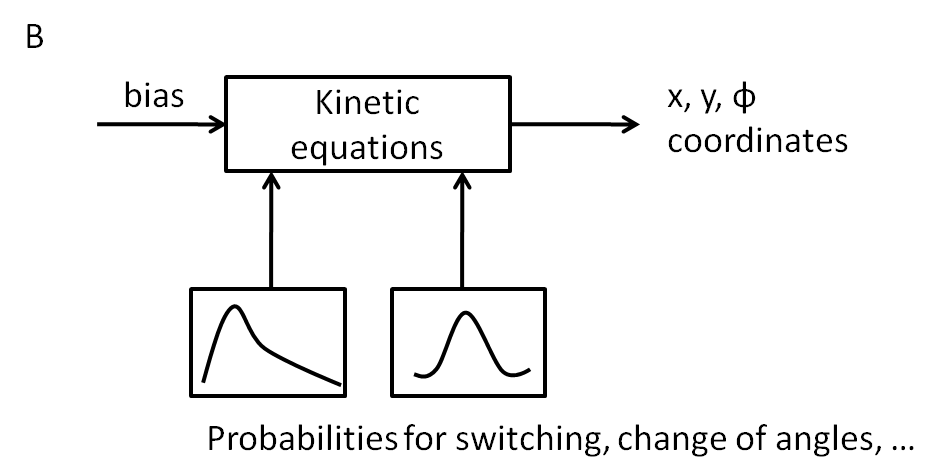
.Analogous to the highly complex signal transduction in chemotaxis there is an equally extensive system on side of the flagella, which is even lower understood. As the movement model is only set up in order to close the feedback chain for testing purposes, a phenomenological implementation will be sufficient.
Brief descriptions about the statistics of E. coli movement can be found in the literature section and therefore the model will be a stochastical one.
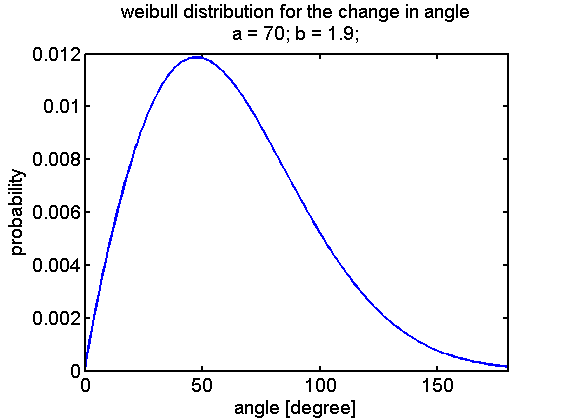
A first implementation was performed by linking the CheYp concentration to the probability of being in the run or tumbling state. These two states either describe the movement and the reorientation as difference equations that can be evaluated at discrete time points. Based on literature statistics about the distribution of change in angle due to tumbling a weibull distribution was selected:
To represent the probability density function it is transformed into a vector that has a frequency of elements that corresponds to the relation of probabilities of the function.
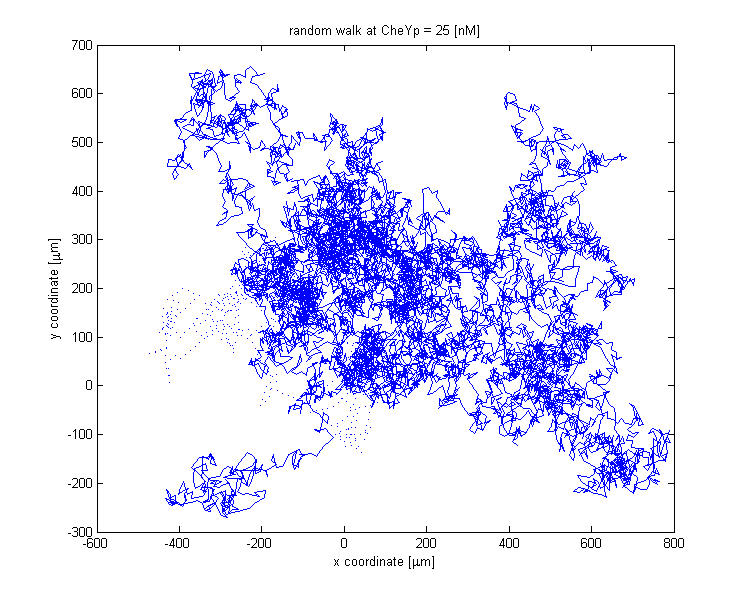
The reorientation happens by selecting a random element of the vector giving the new change in angle. The walks for a thousand steps at different constant CheYp concentrations are shown below:
At a CheYp concentration of 0 the probability for running is about 98%.
At CheYp = 12.5 [nM] both states are equally probable.
At CheYp = 25 [nM] tumbling is dominant.
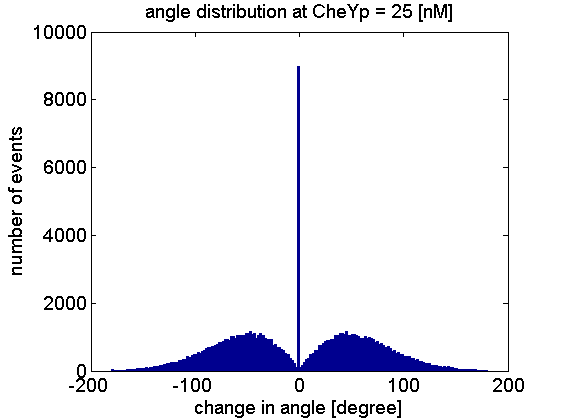
Here is the check of change of angele at 25 [nM] for 1e5 steps:
 "
"


![A random walk at CheYp = 0 [nM].](/wiki/images/f/f7/Walk_CheYp_0.png)
![A random walk at CheYp = 12.5 [nM].](/wiki/images/b/bd/Walk_CheYp_12p5.png)
![A random walk at CheYp = 25 [nM].](/wiki/images/5/5b/Walk_CheYp_25.png)
