Team:TU Delft/26 July 2010 content
From 2010.igem.org
Emulsification Assay
We have been looking for a robust protocol for the characterization of the emulsifiers for quite some time now. Somehow most literature refers to spectrophotometric assays based on turbidity after mixing. This a somewhat arbitrary method, and so far we were unable to get reproducible results. Today we decided to explore this method once more, using a lot of different conditions.
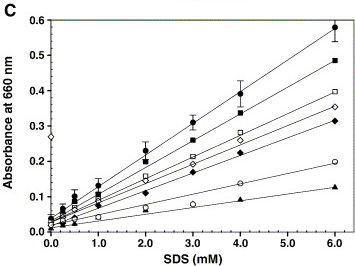
The method is based on a simple article in Biochemical and Biophysical Methods: Spectrophotometric method for quantitative determination of nonionic, ionic and zwitterionic detergents by Rajakumari et al. 2006.

The article shows the graph on the right, which we tried to reproduce. However, instead of triolein we used hexane. And the buffer used was 200 mM Tris-HCl, pH 8.
| # | [SDS] (mM) | Absorbance 660 nm (AU) |
| 1 | 10 | 0.598 |
| 2 | 8 | 0.425 |
| 3 | 6 | 0.830 |
| 4 | 4 | 0.432 |
| 5 | 2 | 0.379 |
| 6 | 0 | 0.001 |
This looked promising, so the experiment was carried out once more in triplo and with proper controls.
| # | [SDS] (mM) | Serie 1 | Serie 2 | Serie 3 | W/O Hexane |
| 1 | 8 | 0.640 | 0.439 | 0.622 | 0.011 |
| 2 | 6 | 0.454 | 0.389 | 0.410 | 0.014 |
| 3 | 5 | 0.514 | 0.539 | 0.440 | 0.023 |
| 4 | 4 | 0.365 | 0.415 | 0.449 | 0.022 |
| 5 | 3 | 0.346 | 0.485 | 0.478 | 0.028 |
| 6 | 2 | 0.413 | 0.404 | Sorry, dropped the sample :( | 0.024 |
| 7 | 1 | 0.399 | 0.500 | 0.388 | 0.011 |
| 8 | 0 | 0.003 | 0.007 | 0.004 | 0.002 |
As you can see in the Table above, the measurements are kind of random. The way in which you pipet also influences the measurement a lot. That is why we decided to vortex the fluid in the cuvet, and take lower concentrations.
This experiment was also done in triplo:
The conclusion is that hexane dissolves much easier than triolein. This curve might be useful in measuring the emulsification capacity of our proteins. So, next
 "
"