Team:SDU-Denmark/K343006
From 2010.igem.org
Contents |
K343005
UV-Vis determination of beta-carotene and retinal production
Both beta-carotene and retinal have unique and characteristic spectres when studied by UV-vis spectrometry. The spectra can be obtained by harvesting beta-carotene- and retinal-producing cells, re-suspending them in acetone and lysing them, which we chose to do by sonication. Afterwards, the cell debris can be pelleted and the supernatant can be examinated.
The acetone suspension of beta-carotene and retinal can then be subjected to spectrophotometry, and the obtained values and spectra can be compared to those of pure beta-carotene or retinal in known concentrations. This method provides both a qualitative answer to whether or not the desired compound is present and a qualitative indication of the concentration in the cells.
In this experiment cells were prepared and harvested according to protocol EX1.1. This experiment was performed with six different strains of E. coli:
Wild type TOP10
Wild type MG1655
TOP10-pSB1A2-K274210
MG1655-pSB1A2-K274210
TOP10-pSB1A2-K274210/pSB1C3-K343005 (double transformants)
MG1655-pSB1A2-K274210/pSB1C3-K343005 (double transformants)
Both K343005 and K274210 were constitutively expressed.
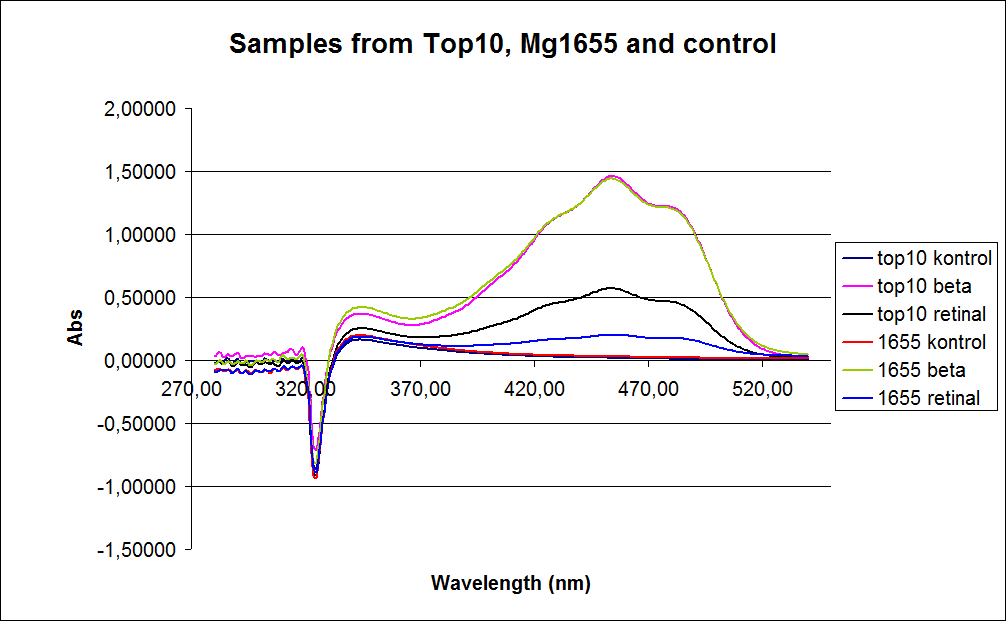
Since the first experiment showed no or small amounts of product in cells grown to exponential phase the measurements were performed on cells incubated for 20 hours at 37 degrees Celcius and 180rpm. The graphs obtained from the experiment are presented below:
In the spectrum a sudden drop between 330 and 320 nm occurs, this can be caused when the samples was auto zeroed according to acetone which is the solvent used in the extraction of the beta-carotene and Retinal.
The graph also shows that cell material interferes with the UV-vis measurement where the retinal has the strongest absorption. Therefore, an organic separation is required prior to the measurements.
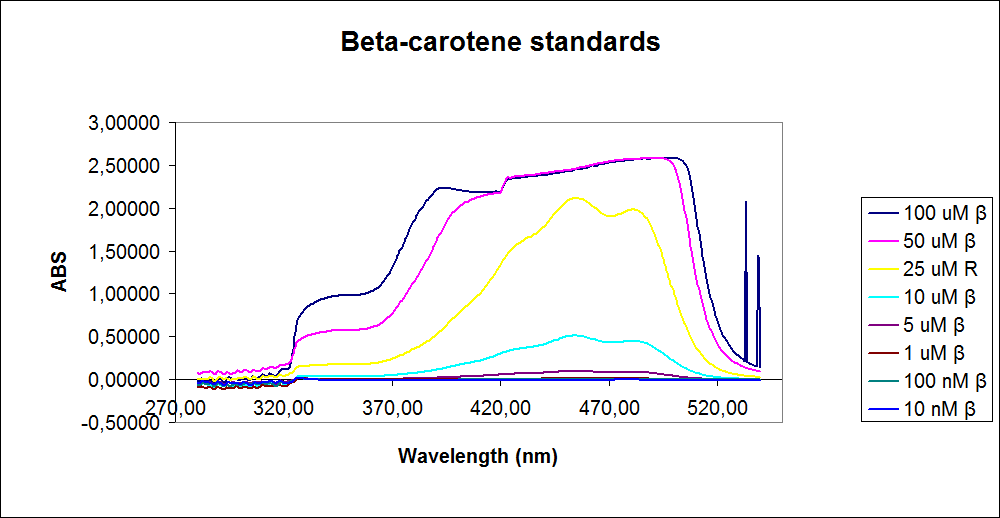
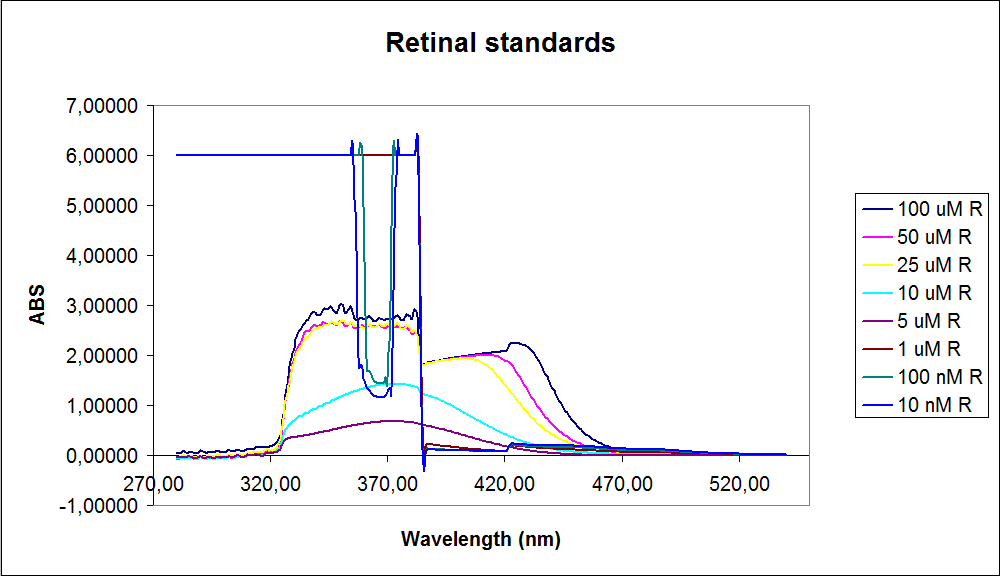
In order to assess the results, standard dilutions of beta-carotene and retinal were made and measured. The concentrations were 1mM, 100 µM, 50 µM, 25 µM, 10 µM, 5 µM, 1 µM, 100 nM and 10 nM. The standard dilutions were measured on the spectrophotometer. The resulting graphs are presented below:
The spectrum for the Beta-carotene looks normal and reliable, the standards for retinal however doesn’t look reliable. The spectra for the three lowest concentrations appears to be distorted and implies that something is interfering with the measurement.
The measurement jumps rapidly from nearly nothing to the maximum absorbance, this might be because the concentration of retinal is to low to be measured as a spectrum, but the concentration of the individual derivates of retinal might be high enough to be measured.
It might also just be that the concentrations are to low and something else is influencing the measurements.
Because of the error in the UV-vis spectra concerning retinal detection in both the standards and samples the next characterization experiments is preformed on a HPLC.
All data can be seen under Raw data
K343006
HPLC determination of beta-carotene and retinal production
Apart from spectrophotometry, the resuspension of beta-carotene or retinal in acetone can be subjected to analysis by HPLC. HPLC can be used to separate retinal from beta-carotene, to get a better indication of whether or not our retinal-generating part actually produces retinal from beta-carotene.
In this experiment cells were prepared and harvested according to protocol EX1.1. This experiment was performed with six different strains of E. coli:
Wild type TOP10
Wild type MG1655
TOP10/pSB1A2-K274210
MG1655/pSB1A2-K274210
TOP10/pSB1A2-K274210/pSB1C3-K343005
MG1655/pSB1A2-K274210/pSB1C3-K343005
Both K343005 and K274210 were constitutively expressed.
MG1655 containing PSB1A2 with K274210 plus PSB1C3 with K343005 both under a constitutively active promotor
The measurements were preformed on cells after 20 hours of growth. The resulting graphs is presented beneath the text.
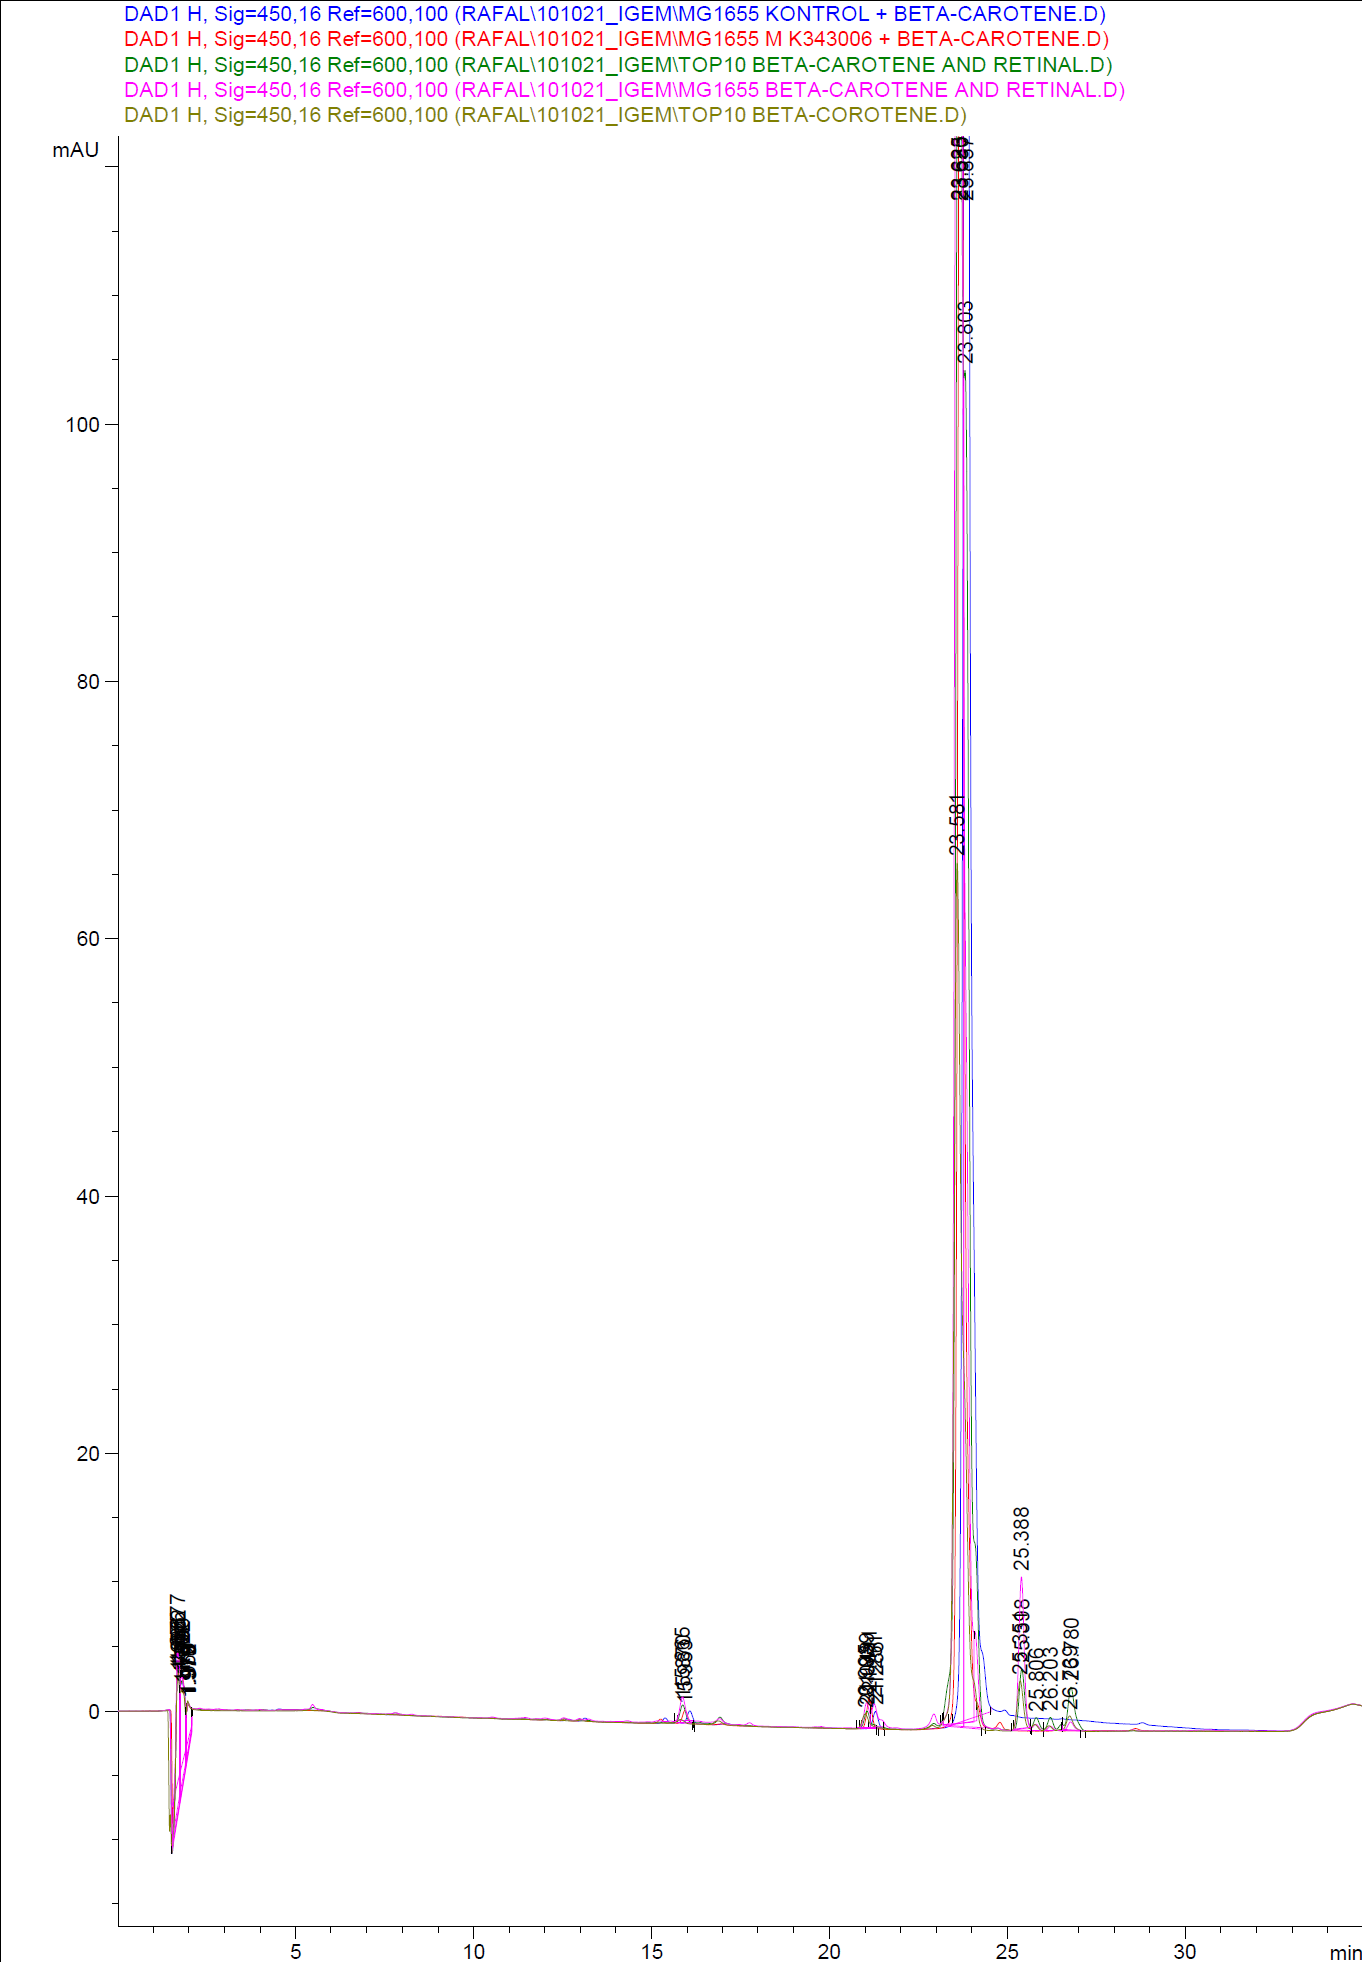
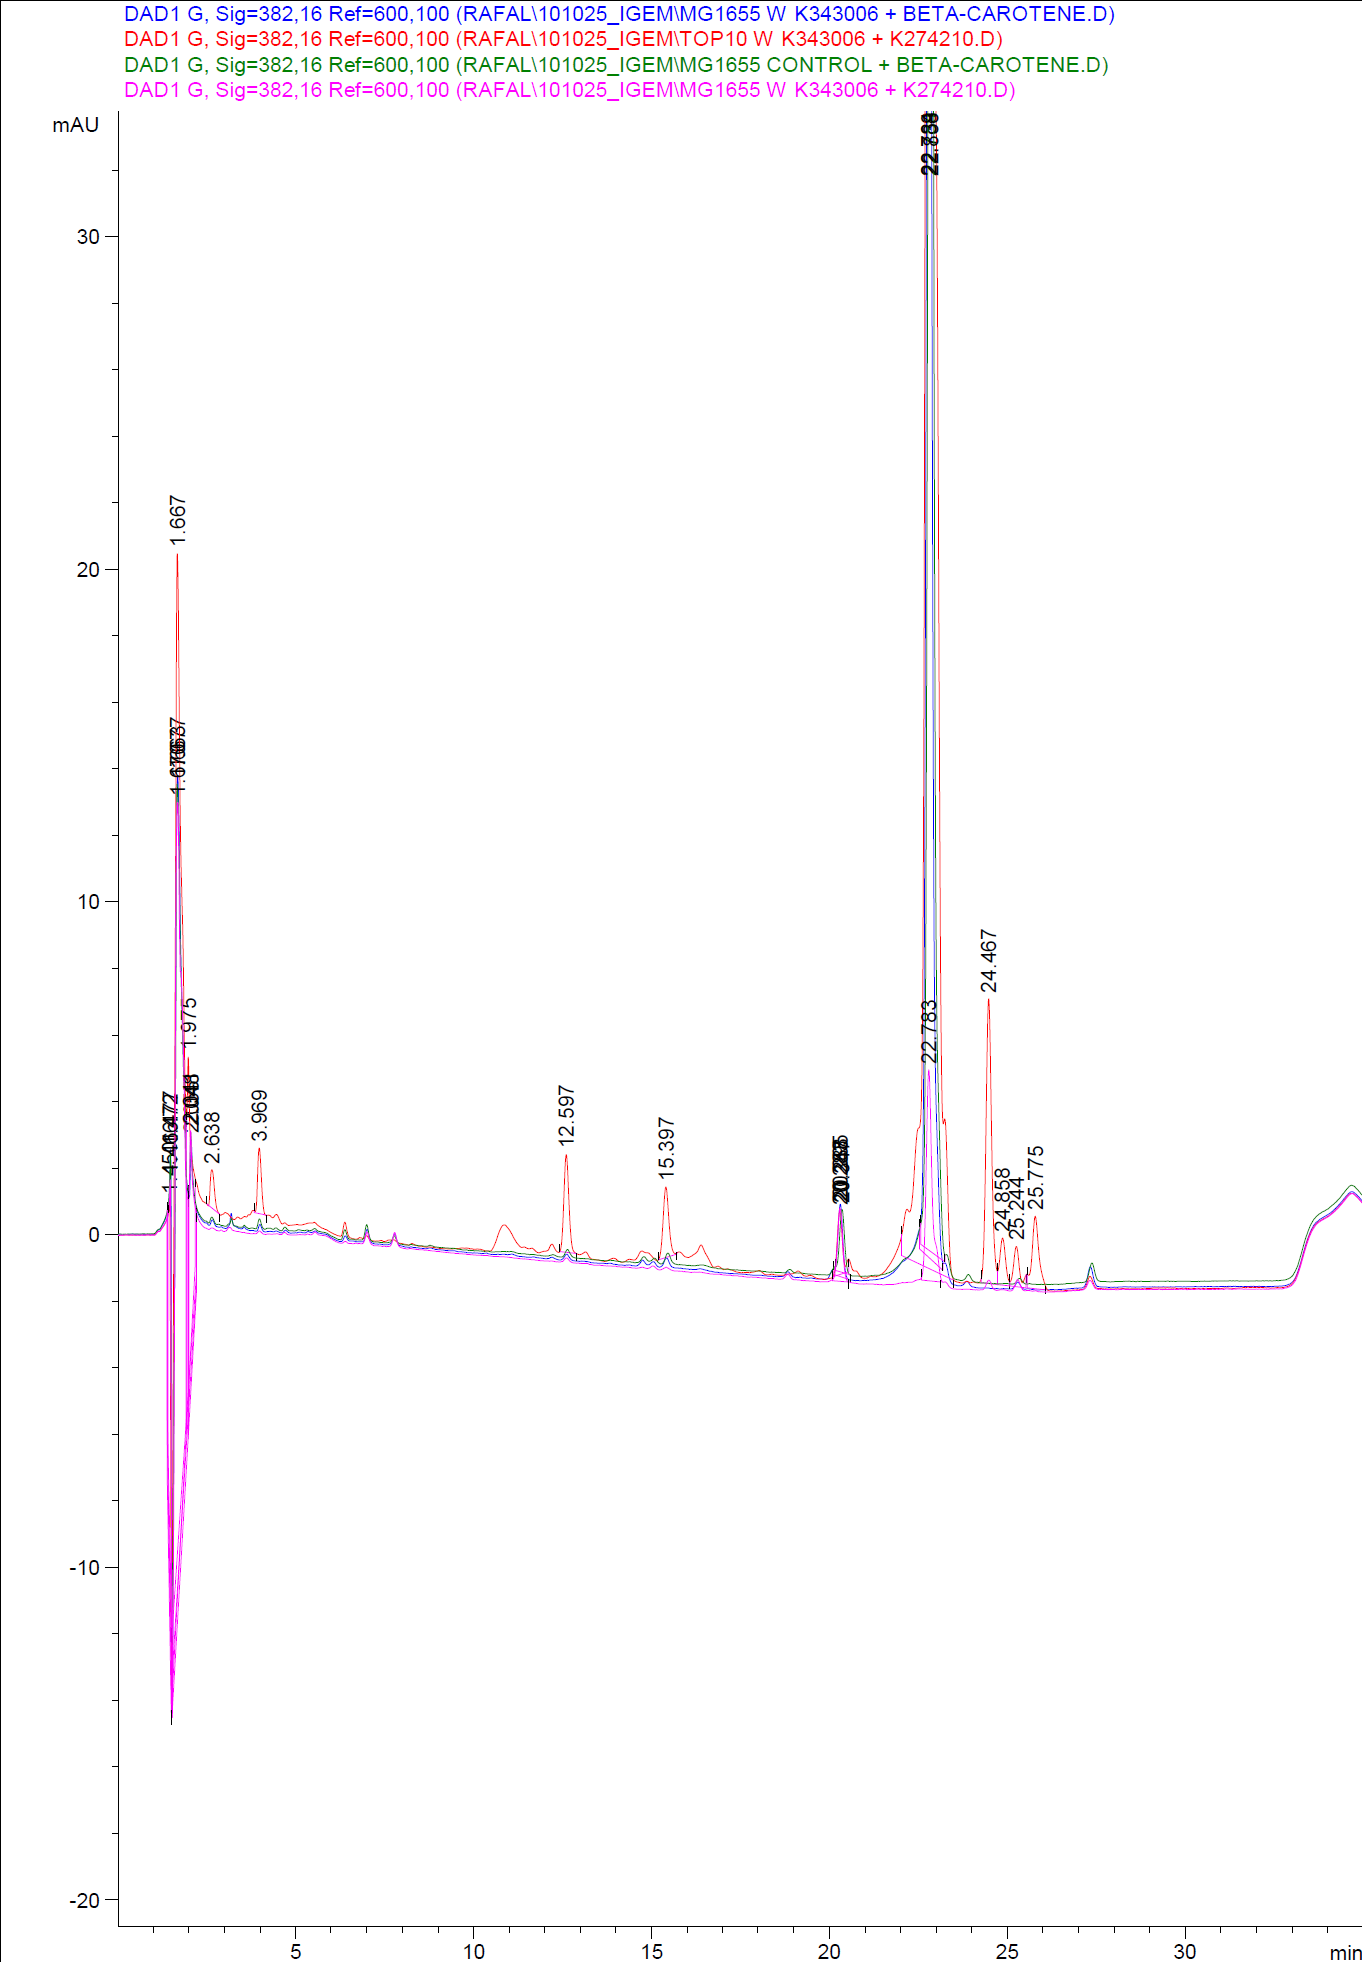
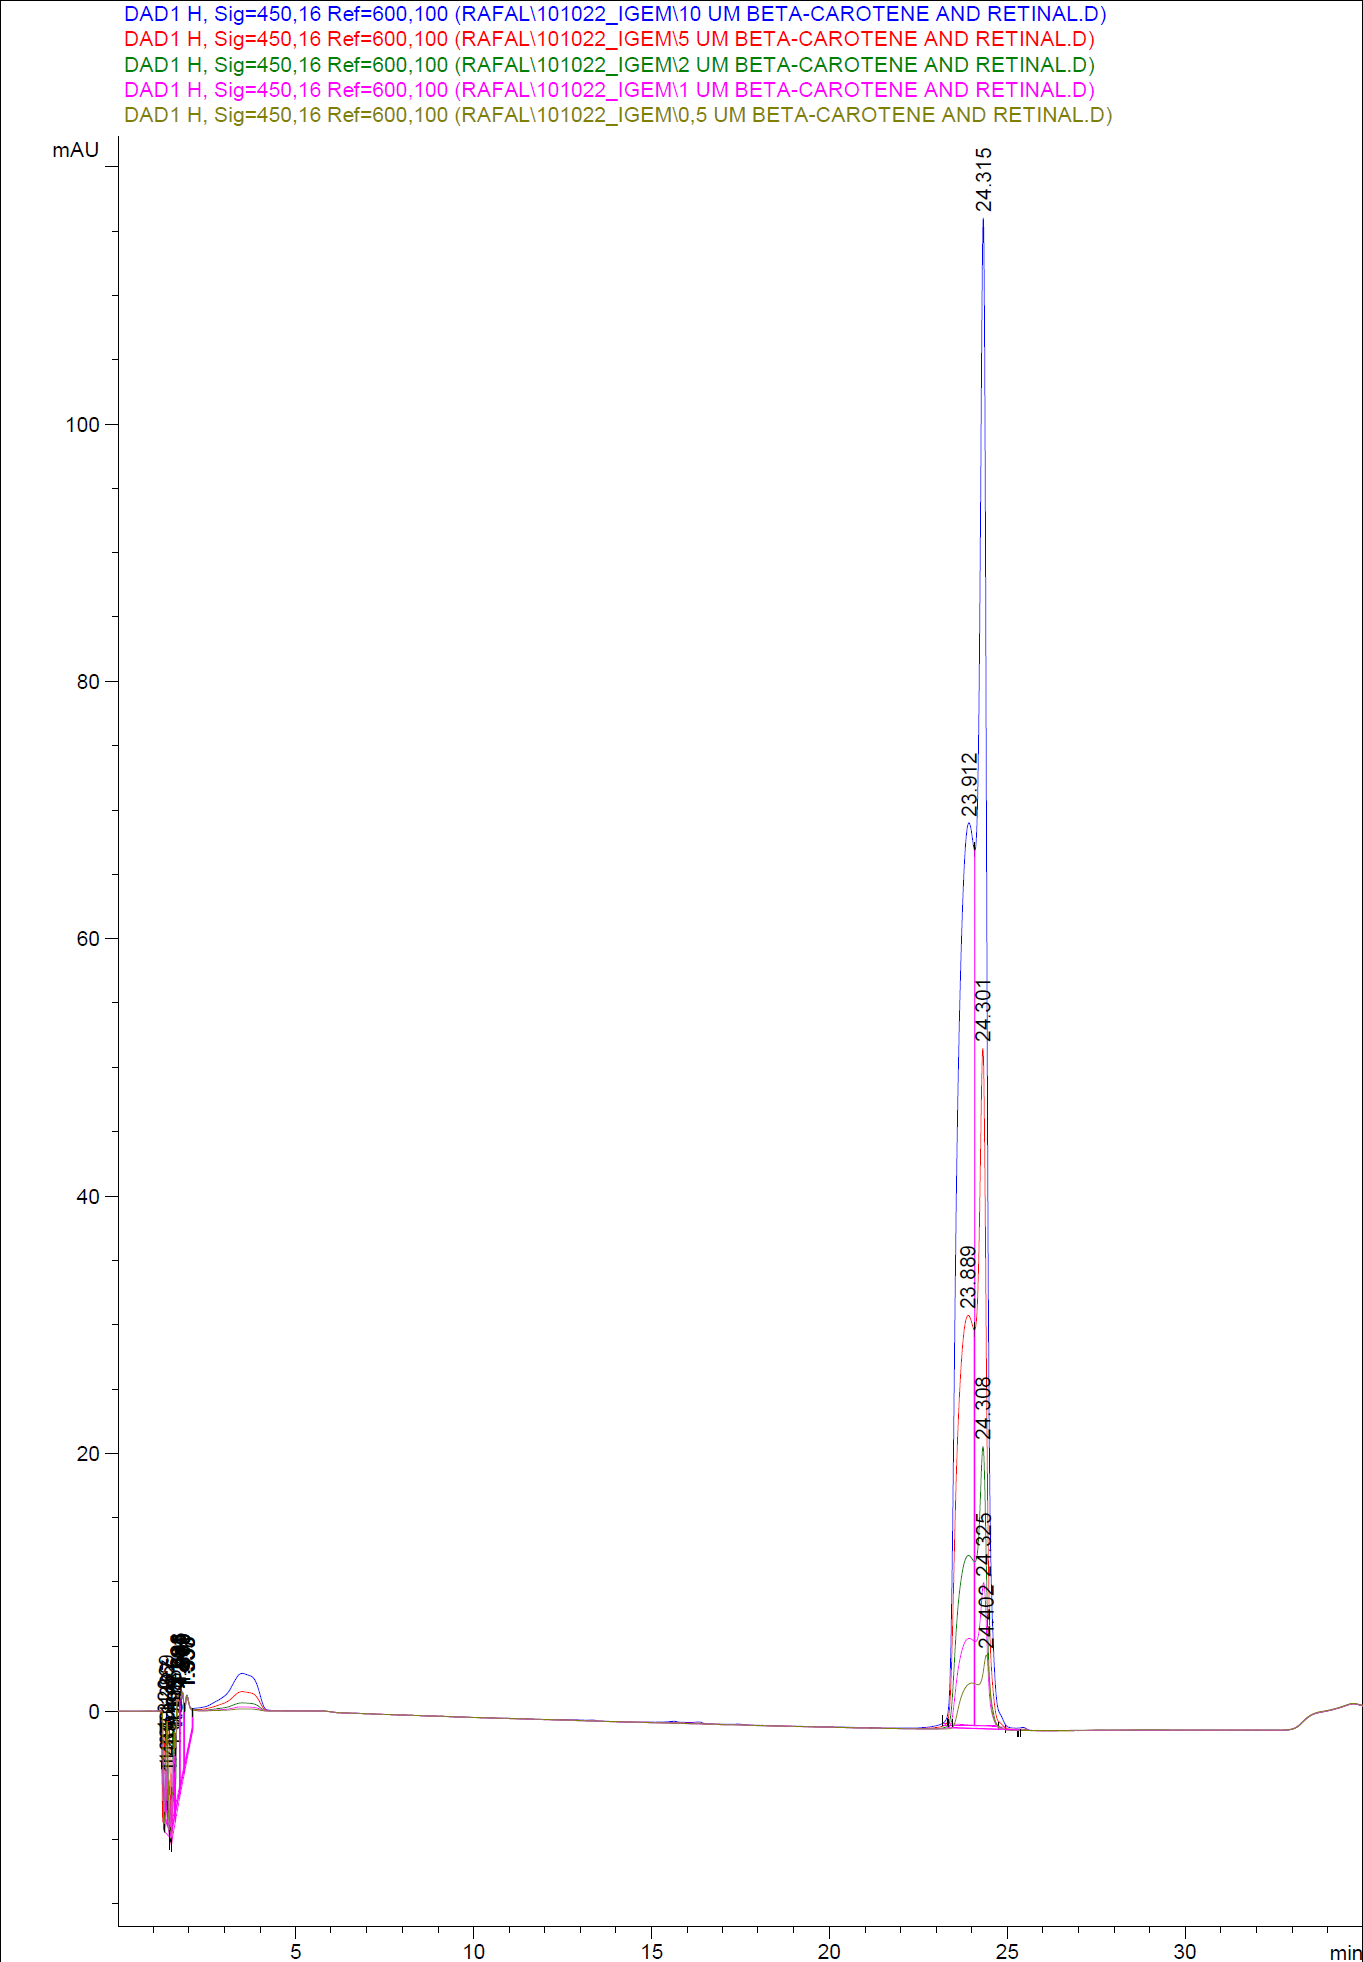
When looking at the retinal and beta-carotene standards analysed on the HPLC, peaks for both chemical are clearly present. The retinal retention time is 3,480-3,490 minutes and the beta-carotene retention time is 23,300-23,600 minutes.
The spectres for the first run of samples show large amounts of beta-carotene, smaller amounts of which also are products produced by the K274210 biobrick or absorbed form the media in the cells where the K274210 biobrick is absent.
The spectre shows no measurable amounts of retinal in neither of the samples, but the samples produced by bacteria containing the K343006 brick have a lower amount of beta-carotene.
which can indicated that either the bacteria’s production of beta-carotene is lowered or that some of the beta-carotene have been metabolized in the cell, either to a non-measurable concentration of Retinal or some other metabolite. It is also a possibility that the retinal is exported out of the cells.
In the spectres from the second run of samples again show large amounts of beta-carotene produced by the K274210 biobrick or absorbed form the media in the cells where the K274210 biobrick is absent.
The only sample displaying any changes form the first run on the HPLC is TOP10 containing both the K343006 and K274210 biobricks. In the spectre higher amounts of cell metabolites some of them still being produced by the K274210 biobrick but also others produced by the cell.
In this spectra the peak with a retention time of 3,969 is close to the retention time of retinal form the standards but when examining the spectre of the peak it can be concluded that it not a retinal peak.
In order to assess and quantify the results a standard dilution of beta-carotene and retinal was made and measured: 10 µM, 5 µM, 1 µM, 2 µM, 0,5 µM. The standard dilutions were also measured on the HPLC with the same injection volumen and program as the samples. The resulting graphs are presented beneath
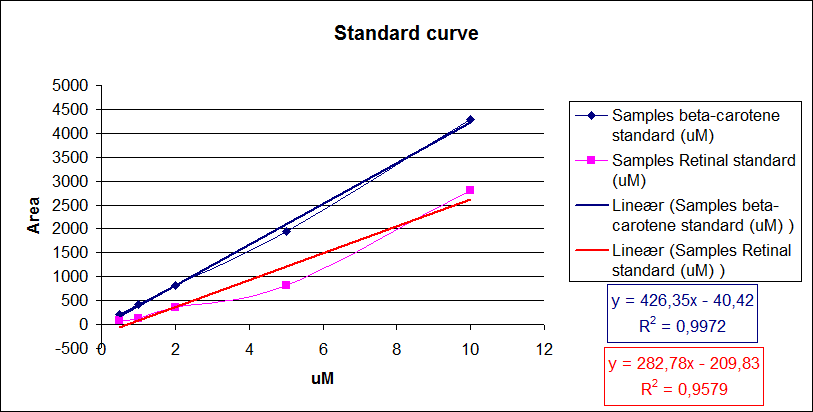
When doing a HPLC analysis it is possible to quantify the amounts of the chemical compounds in the samples.
This is done by doing a standard curve with known solutions of the chemical and recording the area under the peaks. The peak area correspond to the concentration of the chemical in the sample.
Then plotting the area under the peaks on the y- axis, the know concentrations of the standards on the x-axis and calculating the regression line.
Now it is possible to calculate unknown concentrations from samples using the regression line from the standard curves.
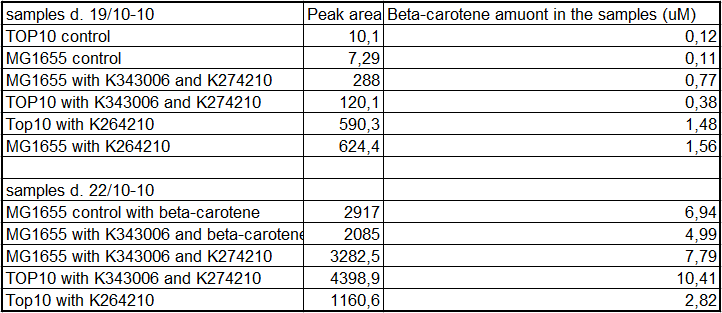
The results for our HPLC analysis can be seen beneath the text.
From the equations for the regression line it is possible to calculate the amount of beta-carotene produced by bacteria grown for 20 hours in LB media.
All data can be seen under Raw data
Stability assay
To dertermine the stability of our pSB1C3-K343006 plasmid, a stability experiment was carried out according to protocol[SA1.1]. E.coli MG1655/pSB1C3-K343006 was grown in LB media without chloramphenicol, whereby no selection pressure is excerted on the bacteria. Dilutions of the culture was spreaded on LA plates and LA plates with 35ug/mL chloramphenicol, respectively, and the colony forming units (cfu) was determined for each plate. The cfu for the LA plates represents the total amount of bacteria in the culture, and the cfu of LA plates with chloraphenicol corresponds to the amount of plasmid carrying bacteria. The percentage of the total amount of bacteria carrying the plasmid was plotted in a semi-logarithmic graph as a function of number of generations.
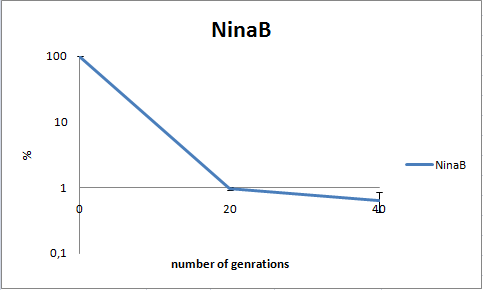
As seen in the graph, almost all of the bacteria had shedded the plasmid after 20 generations, suggesting that the plasmid is only stable within the cell for a few generations (<20). This is presumably due to the strain brought upon the bacteria by the plasmid. Thereby when the bacteria are carrying a high-copy plasmid like pSB1C3-K343006 it is plausible that the bacteria will quickly shed the plasmid when no longer exposed to a selection pressure.
Growth assay
The purpose of this assay is to see if our transformants deviate from the wild type in growth rate. In the growth measurement assay we have measured OD at 550 nm every hour for 12 hours and at hour 24. In the experimental setup we used no lag phase was observed in any of the measurements.
The graph below shows the growth of our wild type E. coli strain MG1655, the MG1655/pSB1C3-K343006 respectively.

From our data we see no significant difference between the plasmid carrying bacteria and the wild type. This can be said to be quite conteradictory to our results obtained from the stability assay. The transitory stability of pSB1C3-K343006 suggests that it is highly unfavorable for the bacteria, wherefore it might be expected that the growth of the bacteria containg this plasmid would be affected. Thus, however much a disadvantage the plasmid pose to the bacteria, their growth are not significantly influenced by the plasmid. The added reproduction load due to the plasmids, might also prolong the lag phase of the bacteria. Whether this is the case can not be concluded based on this experiment as no lag phase was observed in this experiment.
 "
"
