Team:St Andrews/project/modelling/model 3
Model 3: Pseudo Multi Cell One Dimension
Contents |
Theory & assumptions
The results produced from both of our previous models were unsatisfactory, since neither gave us quantifiable data from which experimental comparisons could be made, although the switching on was clearly visible in both. Therefore it was decided that in order to properly capture the mechanism of bistability it was essential to have some element of cell number, and as such we must simulate the growth of a cell colony rather than artificially increase the amount of HSL in our external environment. Several crucial elements were added to the model to incorporate this new outlook:
i. A new variable 'Number of cells' was added
ii. Two new functions which simulate cell growth and cell death
iii. A new paramter 'Volume'
The number of cells is set at the beginning of the simulation by the user. Based on a doubling time of 20 minutes, the variable is increased every increment by the cell growth function. In order to simulate the increase in HSL due to these new cells, each new cell is accompanied by an increase in HSL which is equal to that being contributed by the cells already present in the system. (VOLUME THING IN DIFFERENTIALS). Similarly we included a cell death function which decreases the number of cells at a halving rate of 20 minutes in tandem to the growth rate.
Results
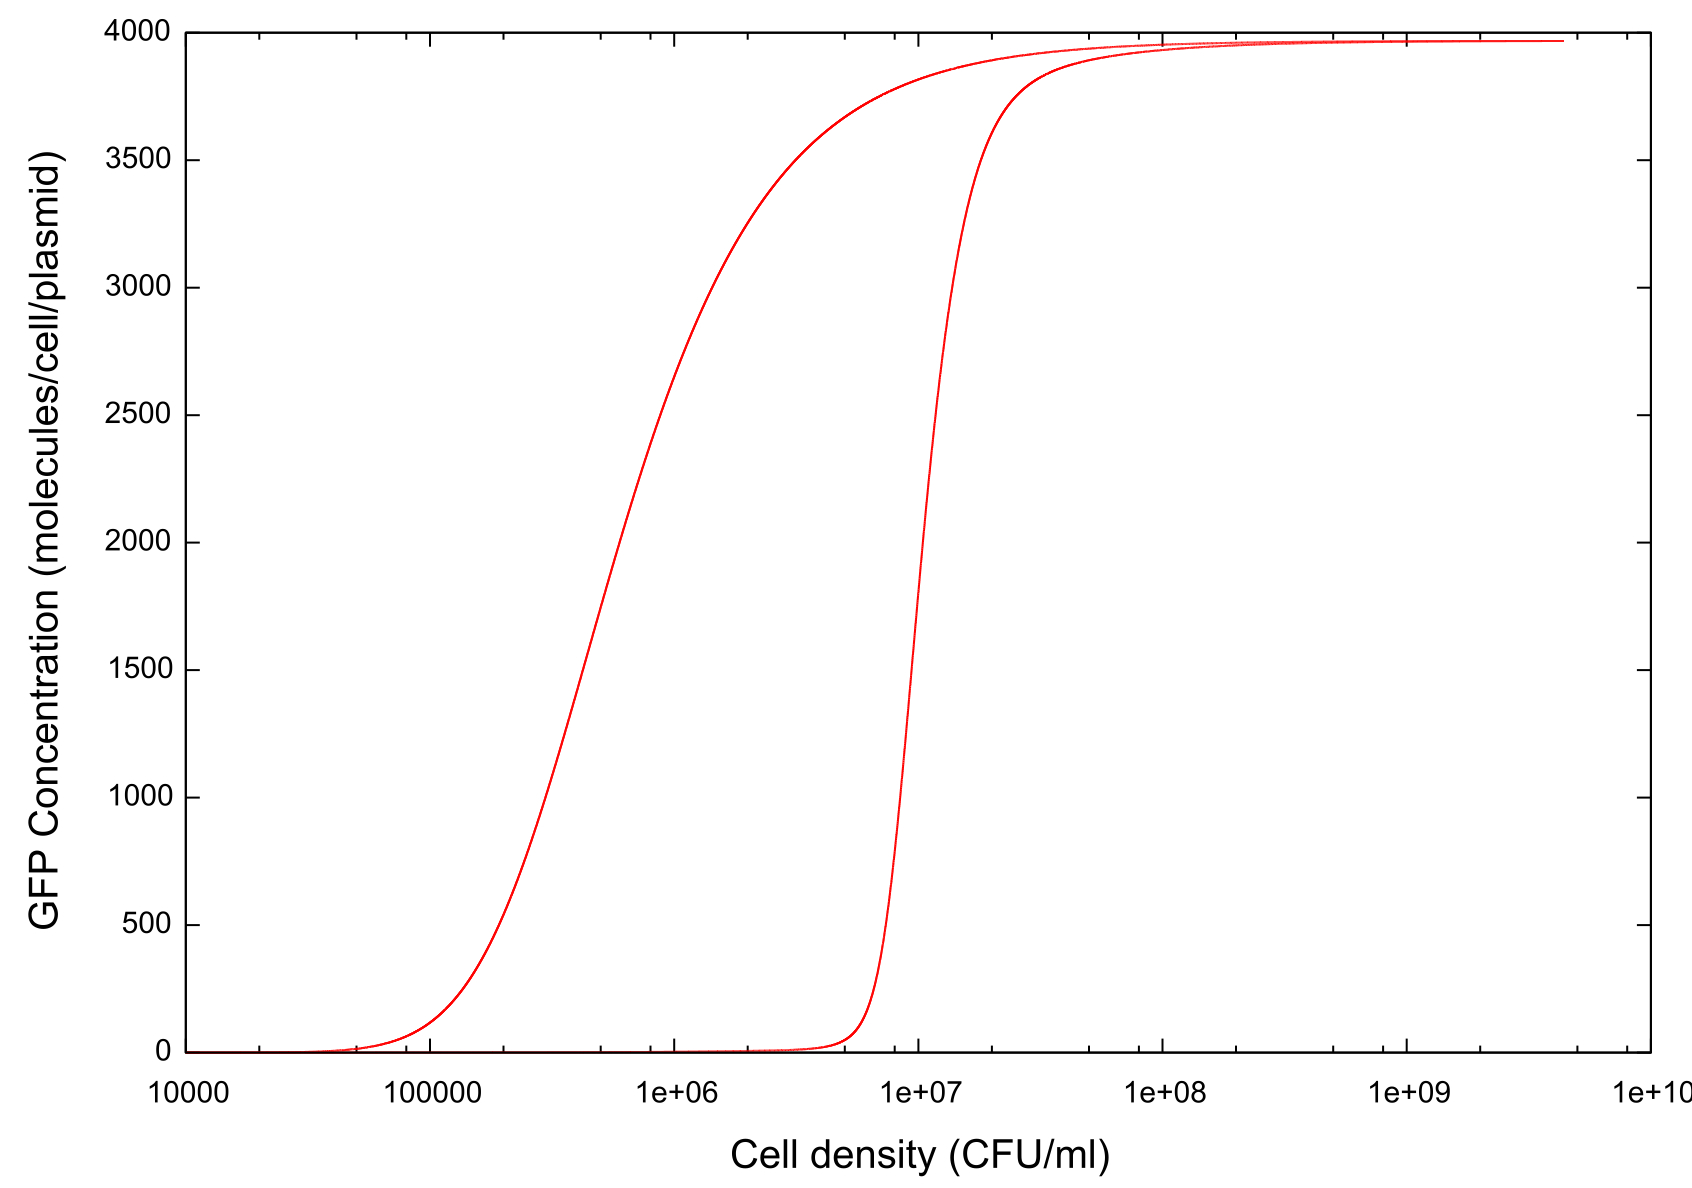
On running the model through the cell growth, stationary and cell death phases, the first example of ‘true bistability’ is produced, see figure 1. Since this model contains spatial dimensions we are able to determine a specific cell density at which the switch happens, and this is comparable to the value predicted by other models and by experimental evidence. At a cell density of between 1x10⁶ and 1x10⁷ colony forming units (CFU), there is an exponential increase in the GFP concentration, indicating an increase in the activity of the cells and a transition from the 'off' state to the 'on'. At a value of approximately 1x10⁸ CFU the GFP concentration then begins to level out and the system reaches a steady state. At this point all the cells in the system would be seen to have turned out and any associated virulence factors would now be expressed.
We can clearly see that the model produces bistable behaviour. The steady-state level of GFP remains for a lower cell density that it did on turning on, with the cells turning off at a lower cell density of approximately 1x10⁵ CFU. Clearly our model produces at least some form of the bistability which we were looking for it to produce. More important however is to find a reason why this bistability occurs, what its effects are, and how we can manipulate it effectively.
Figure 1: Graph showing change in GFP concentration against cell density
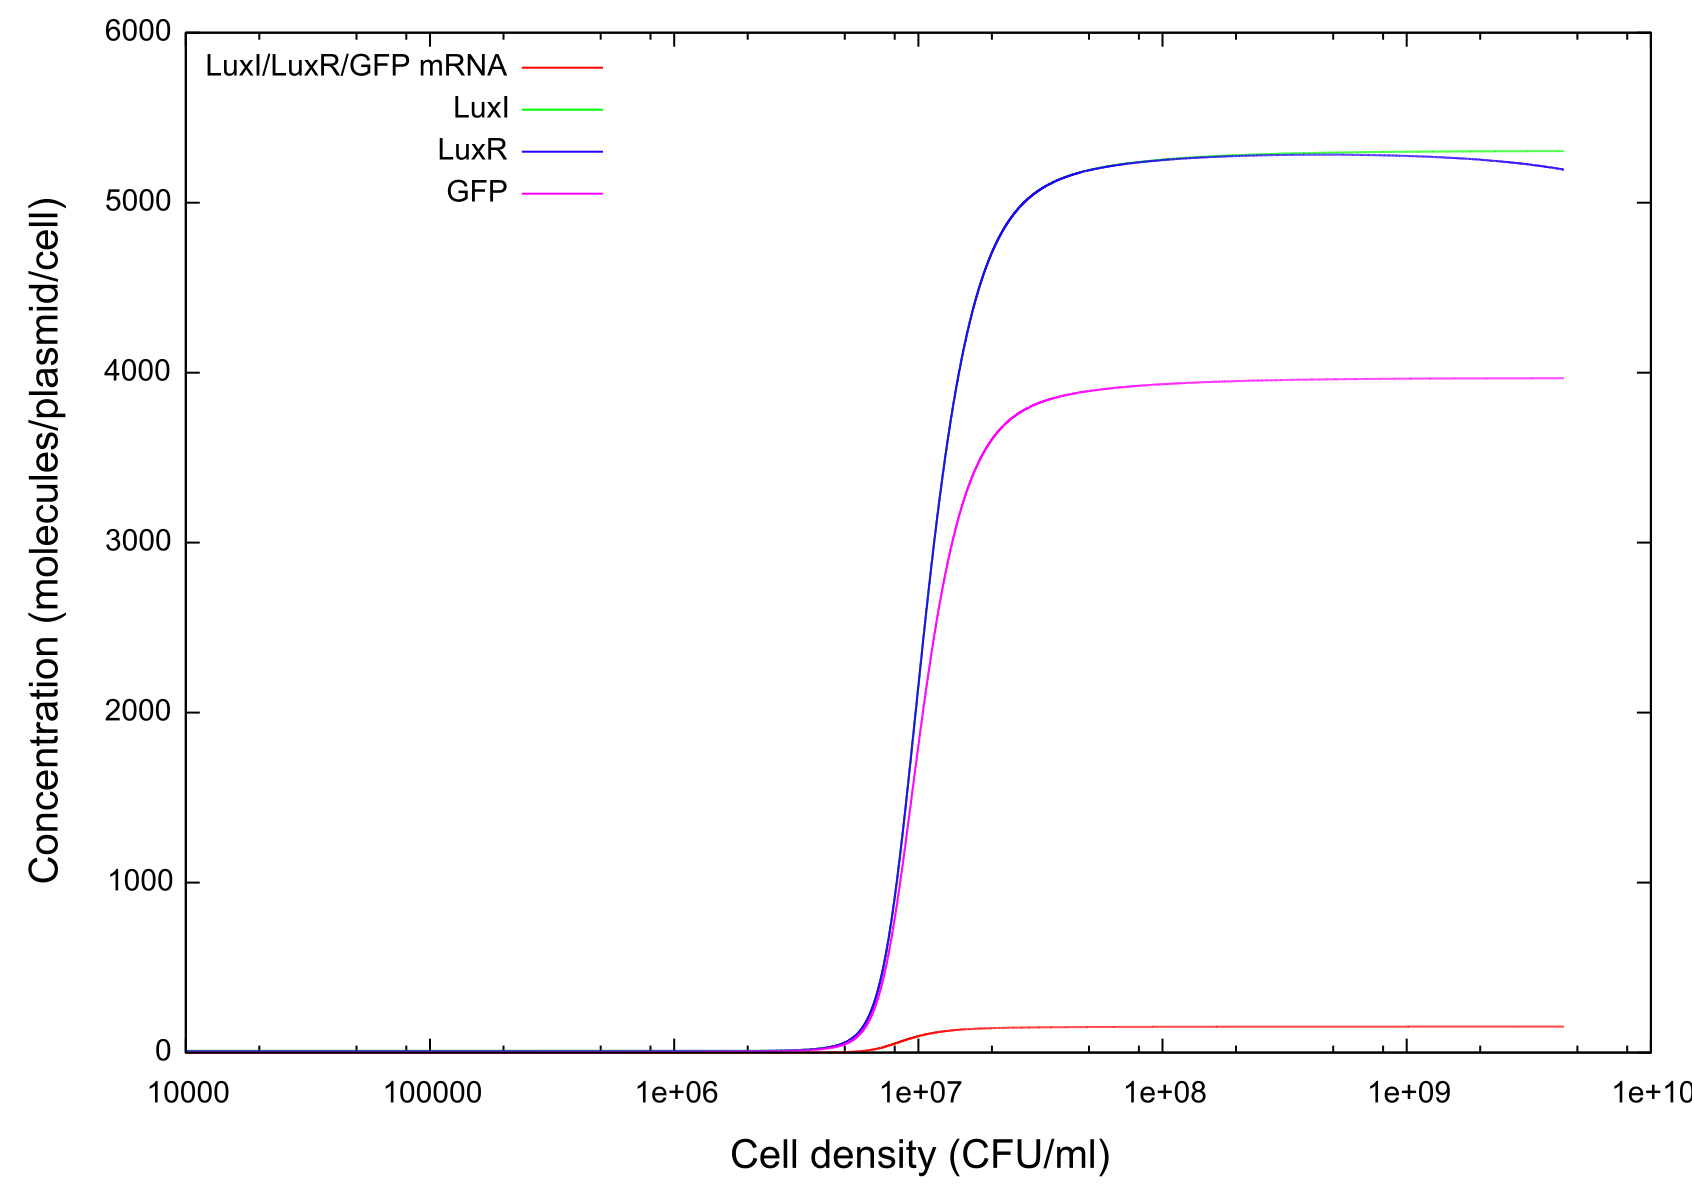
Figure 2 gives us an insight into how some of the chemicals taking part in the quorum sensing reactions change with cell density. Concentration of GFP has been plotted again on this graph to allow the concentrations of the other chemicals to be compared at key points. We can see that at the same cell density that GFP concentration begins to rise there is a similar rise in the concentrations of LuxR and LuxI in the system. Similarly there is a slightly delayed, and markedly lower increase in the concentration of LuxI/LuxR and GFP mRNAs present. The mRNA concentrations also reach a steady state at a lower cell density than the other chemicals. We make the assumption that as the cell density increases, the associated increase in HSL cause and increase also in HSL-LuxR, which then results in a greater concentration of the mRNA (and hence the proteins themselves). Although not shown on these figures, the HSL-LuxR concentration mirrors that of the mRNA exactly, and so remains at a low concentration of approximately 100-200 molecules/plasmid/cell. This fits the known theory which says that the HSL-LuxR complex is highly unstable, and will therefore only ever exists in small amounts.
Figure 2: Graph showing change in GFP, LuxR, LuxI and mRNA concentrations for the transition from off to on
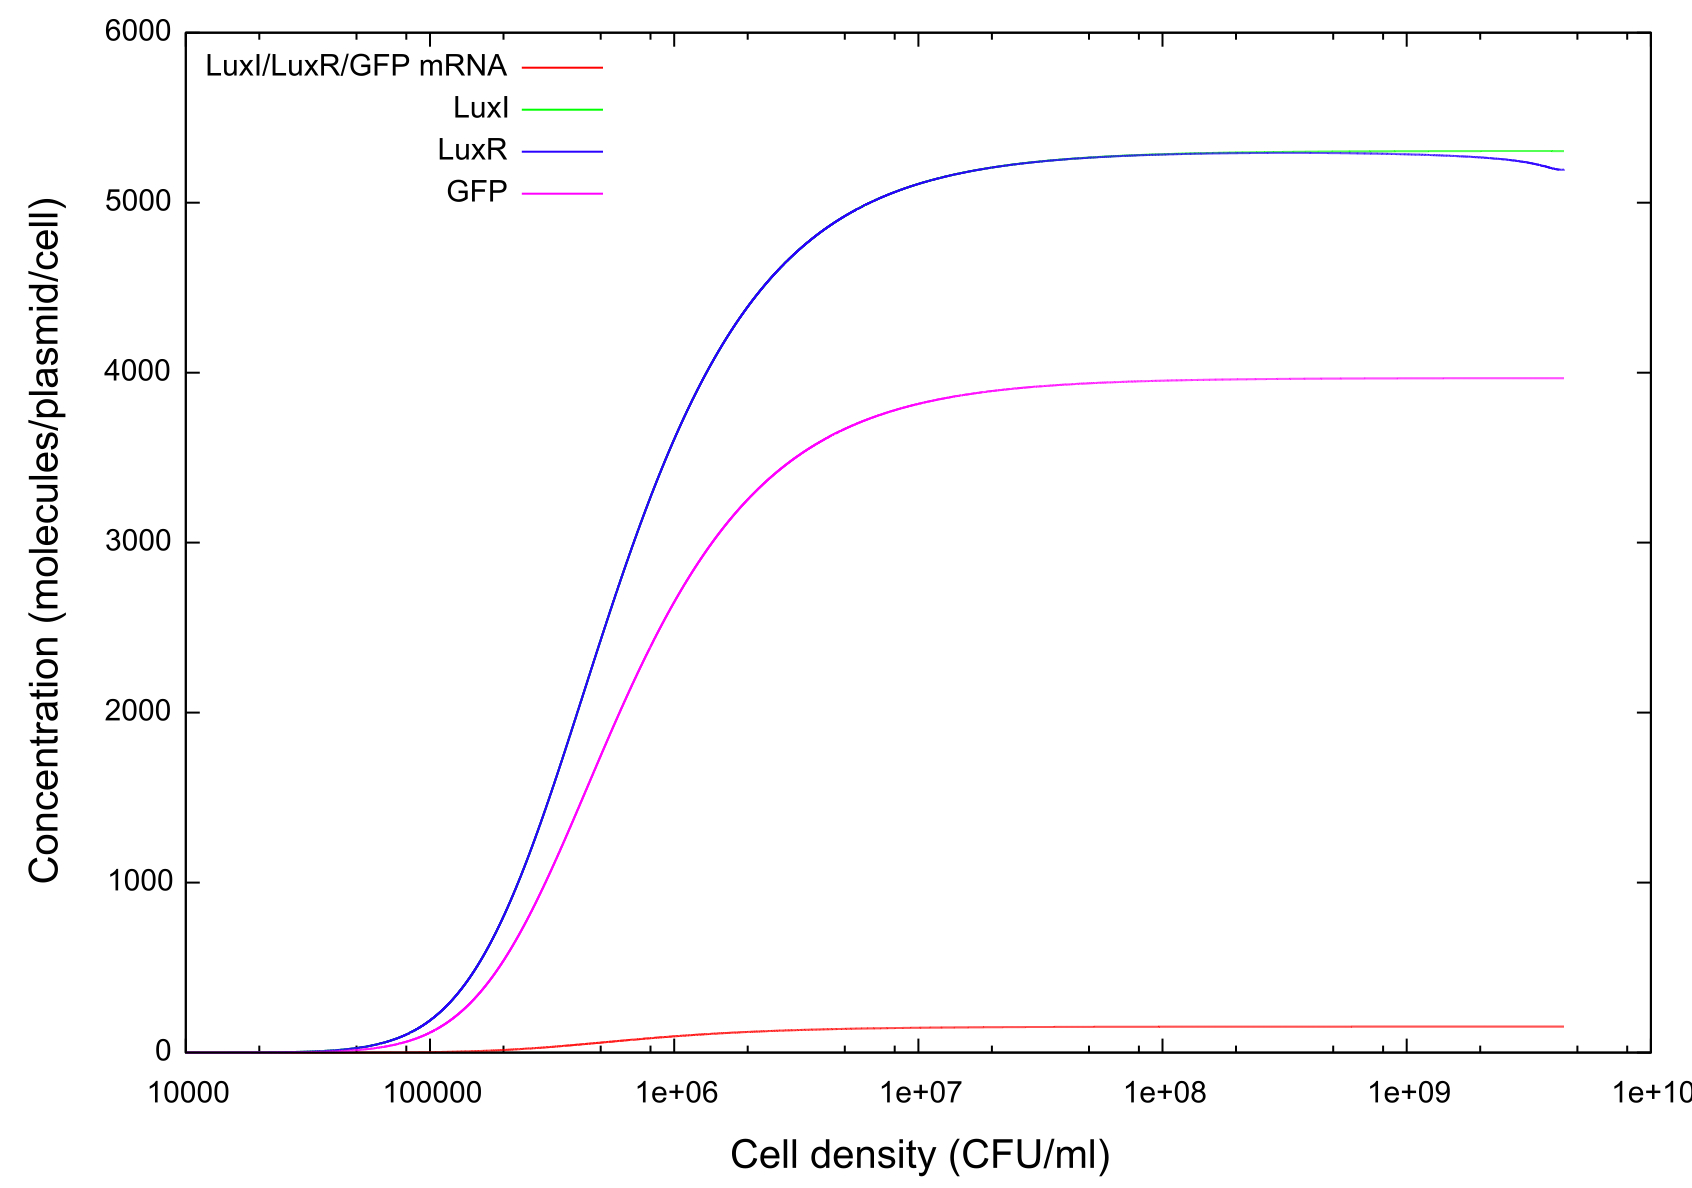
Direct comparisons should be made between figures 2 and 3, which show the cell growth and cell death phases of the same simulation. Clearly the bistability extends to chemicals other than GFP, with the LuxI and LuxR concentrations following a similar curve as GFP. The concentrations of both of these start to drop at a lower cell density than in figure 2, but the exact reason for this is hard to define.
Figure 3: Graph showing change in GFP, LuxR, LuxI and mRNA concentrations for the transition from on to off
Possible reasons include:
- Since chemicals take time to degrade there is an excess which remains present in the system until it is used in a reaction or degrades
Parameter Testing
The next stage in the development of our model was to probe which factors had an impact on the behaviour of the system and exactly what that impact was and what implications they have. This was done by performing a series of "parameter tests". The methods used and the results obtained can be found below.
Measuring bistability
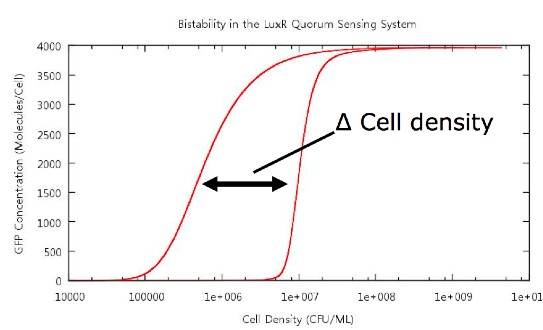
The key point which we wished to investigate was the bistability of our system, so in order to do this we had to develop a standard way in which we would measure the 'level' of bistability. The method decided upon was to take a reading of the cell density at a fixed value of GFP concentration during cell growth and similarly record the cell density at the same GFP concentration during cell death. Thus we would obtain a value Δ Cell density which gives us a useful quantity which we can use in our tests. For our tests we chose a value of 20 molecules/plasmid/cell, as an indication that the system has begun switching on, as experience had shown that this was an appropriate value.
Figure 4: Our method of bistability measurement
Testing our switch
We decided that there were some key parameters which we would like to test since experimental knowledge and our experience of modelling the system suggested that they would be of interest. These were the rates of:
- Association and dissociation
- HSL production and degradation
- LuxR degradation
- Promoter binding site strengths
Implementation
In order to test the level of bistability, we first needed to find the parameter range for which the system switched on, otherwise there would be no bistability whatsoever. This was done by running our model many times, each time changing the value of the parameter under investigation. We then looked for which values the system switched on by the final concentration of GFP. We could then operate only within the operating range of the switch and run our model many times within this range, looking at the value of ΔCell density and comparing the results for different parameter values.
Association and dissociation of HSL-LuxR
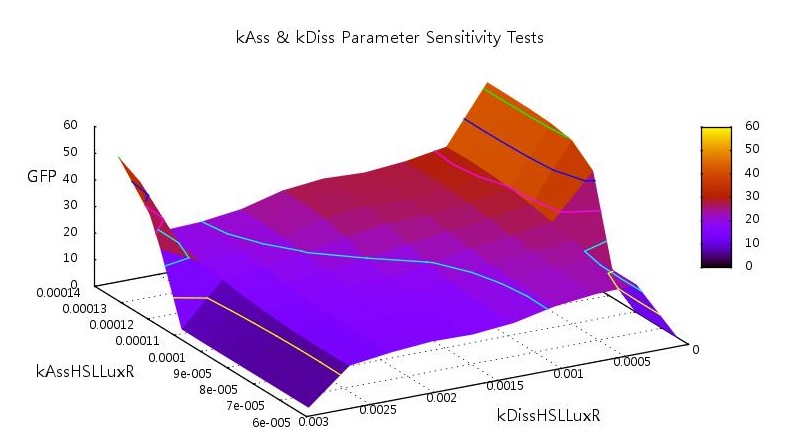
The HSL-LuxR complex is key to the entire quorum sensing circuit and as such we would expect it to play an important role in the level of bistability of the system. Our initial tests showed unsurprising results, that at high dissociation rates the system requires a higher rate of association to switch on and vice-versa. This is what we would expect, since when the association rate is high HSL-LuxR will accumulate much faster and so promote transcription much faster also. Similarly a high dissociation rate will result in very few HSL-LuxR molecules present to promote transcription and so GFP production will be less pronounced. There is a definite central plateau on the graph in which the rates of association and dissociation are such that the system switches on and this is the parameter space in which we were to perform our tests.
Figure 5: Parameter sensitivity tests on rate of associations and dissociation on HSL and LuxR
HSL production & degradation
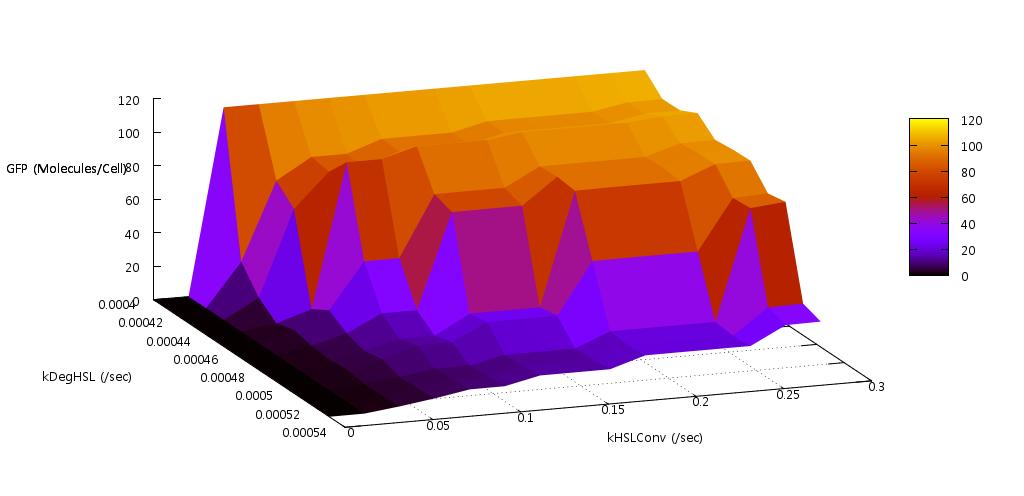
We reasoned that the rate at which HSL was both produced, and degraded within the system should have a significant effect on the bistability since this molecule is fundamental to the process of quorum sensing in E.coli. Indeed our initial tests found that if the conversion rate was too low, or the degradation rate too high, the system did not actually switch on (see figure 6). This would make biological sense, since if we have HSL being produced in the cells at a high rate there will be a plentiful supply with which the LuxR can bind. Similarly a low production rate or high degradation rate will result in a shortage of HSL.
Figure 6: Results from initial parameter tests on rate of HSL production and degradation
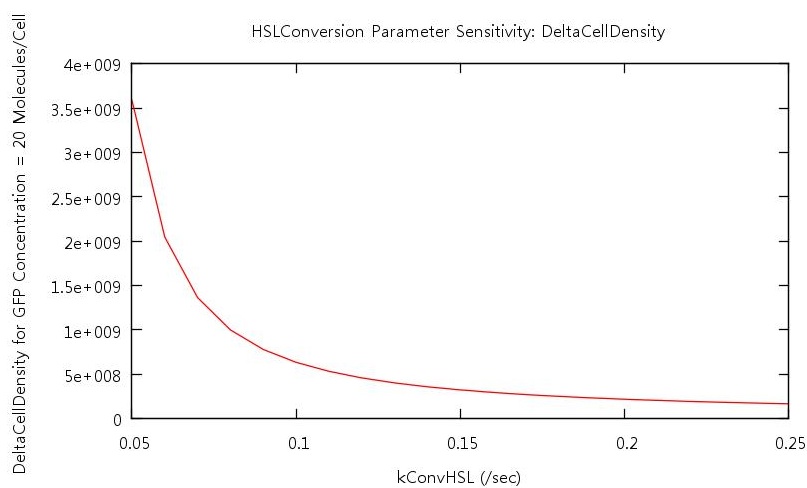
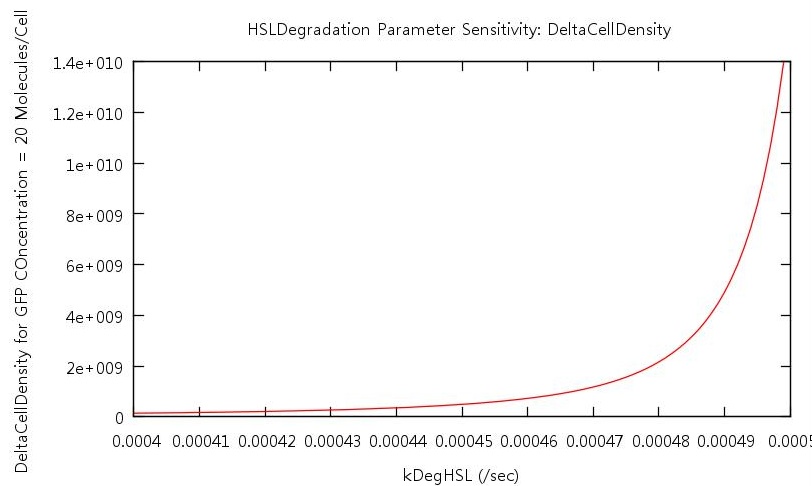
Our test indicated that our parameter test should be performed for values, 0.05 < kConvHSL < 0.25 and 0.0004 < kDegHSL < 0.0005. The next stage of testing was to run our simulation through these two ranges of values and observe the values produced for ΔCell density. The results of these tests are shown below. From these plots we can clearly see that by increasing the HSL conversion rate we also decrease the bistability of the system and by increasing the HSL degradation rate we increase the bistability of the system. Thinking through these two results, logical conclusions can be drawn. With a high value for kConv, the saturation concentration of HSL is reached much quicker, and so when the cell death cycle is invoked, the difference between the two graphs is smaller than if a low value had been used. The key point to think about is that kConv does not change the final concentrations of any of the chemicals, rather it decreases the cell density required to reach those final concentrations.
Looking now to the HSL degradation rate, a higher degradation rate will have the opposite effect of a high conversion rate, causing the system to take a longer time to reach the steady state. Thus when the cell death cycle is invoked a greater level of bistability will be displayed.
Figure 7: Parameter sensitivity test on rate of HSL conversion
Figure 8: Parameter sensitivity test on rate of HSL degradation
LuxR degradation
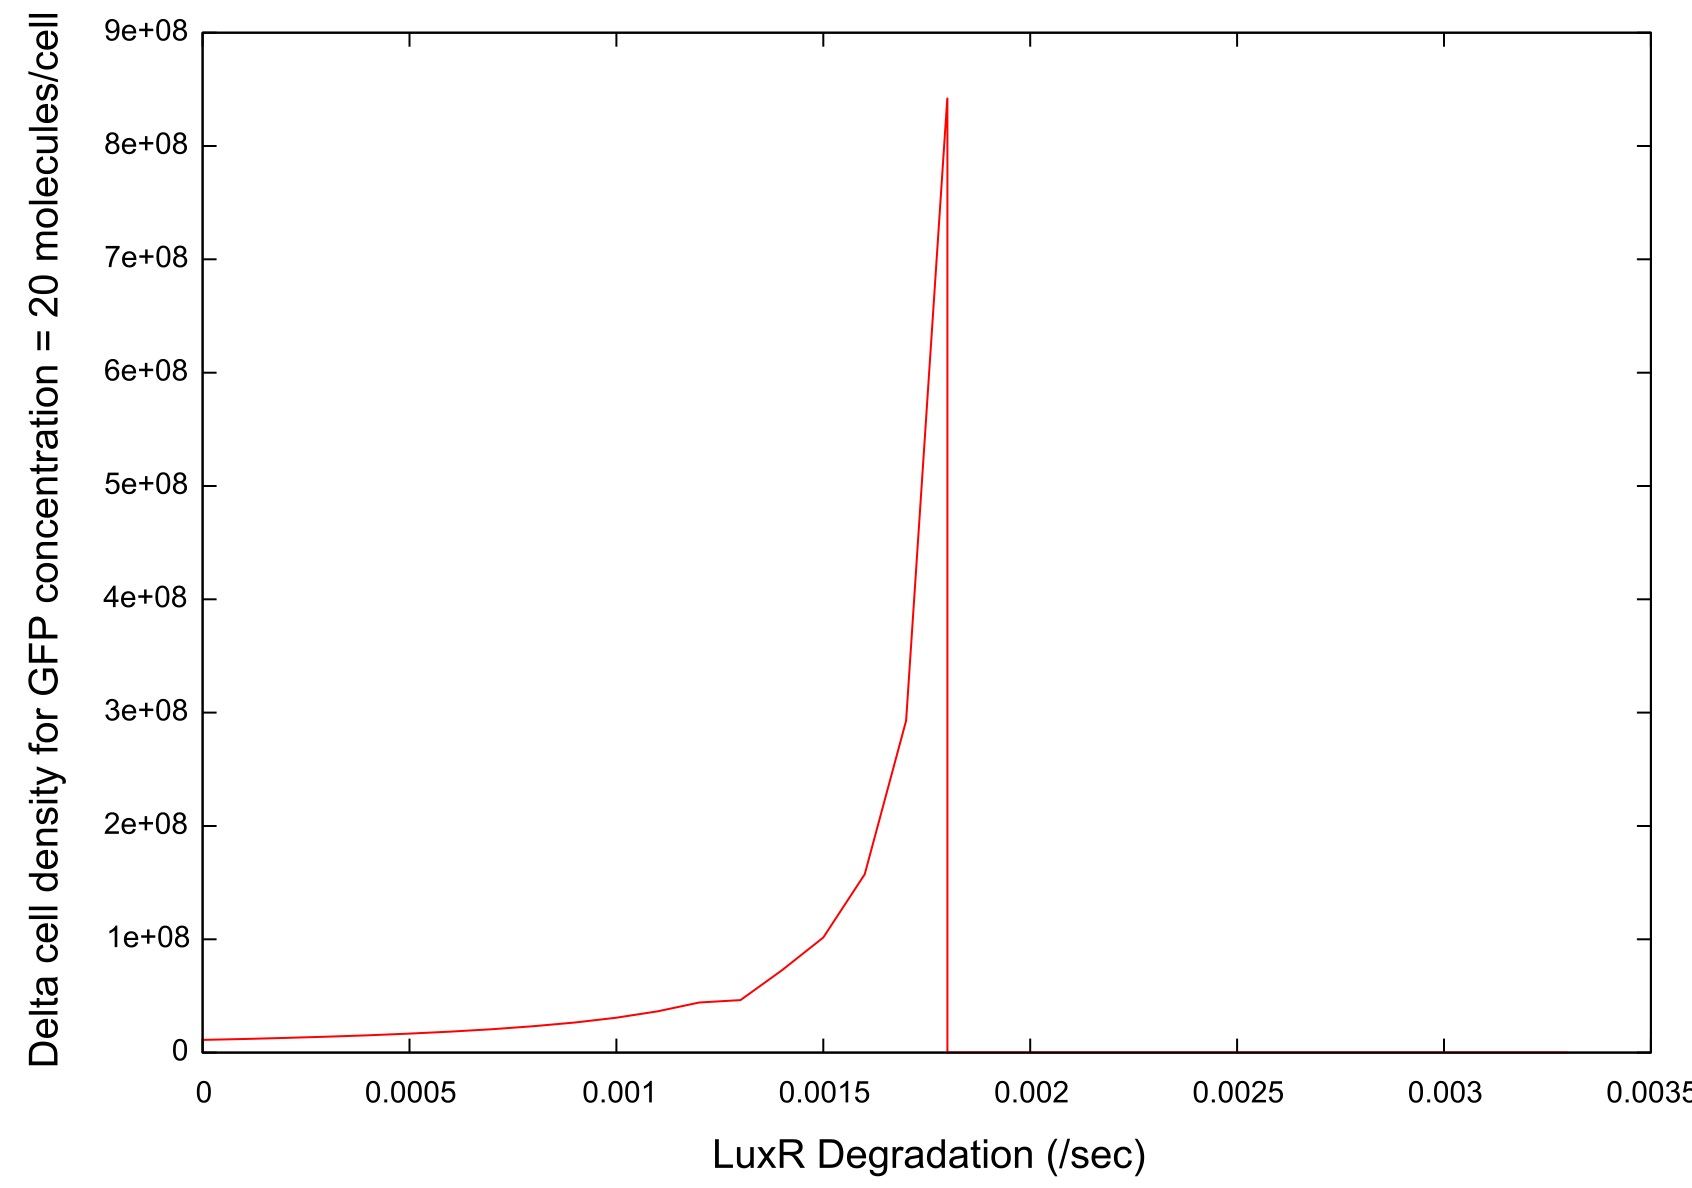
Similar tests were performed on the effects of changing the rate of LuxR degradation. We also expected interesting results from these tests since the LuxR is the HSL binding molecule. Our initial test to find a suitable parameter range gave us the data shown in figure .
Figure 9: Parameter sensitivity test results on LuxR degradation rate
There is a clear drop to zero in the bistability at a certain threshold level for LuxR degradation. This is due to the fact that the LuxR is degrading at such a high rate that there is not enough binding between it and the HSL to sustain the quorum sensing network, and thus the system never switches on during the cell growth cycle. Before this point there is an exponential relationship between the level of bistability and the LuxR degradation rate. The explanation for this we hypothesise is the same as was the case for the HSL degradation, in that if the degradation rate is high the system takes longer to reach the equilibrium and so the bistability is greater.
Promoter efficiency and affinity
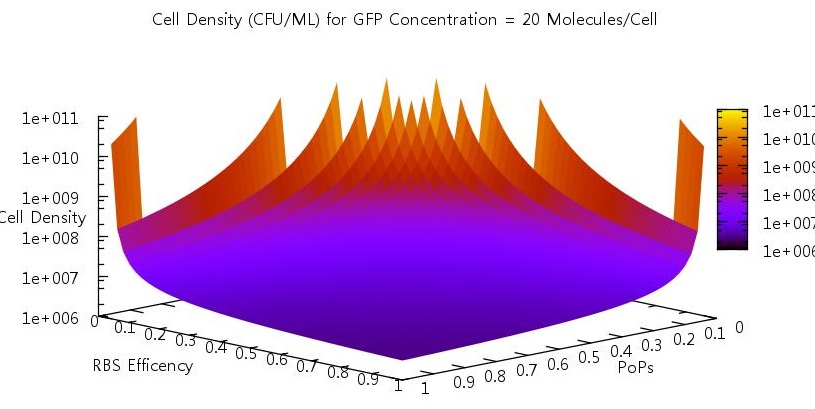
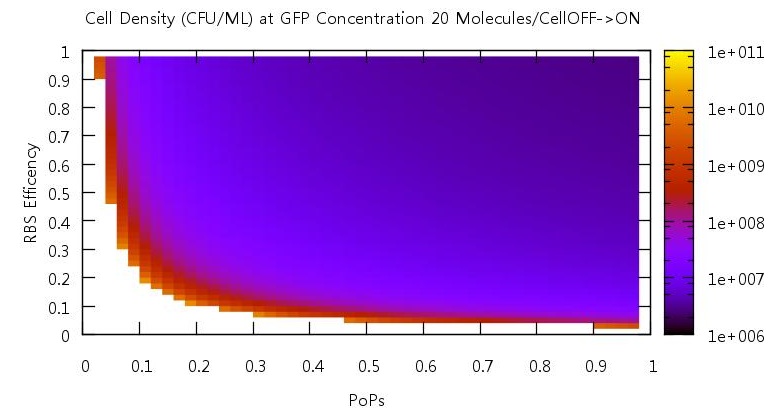
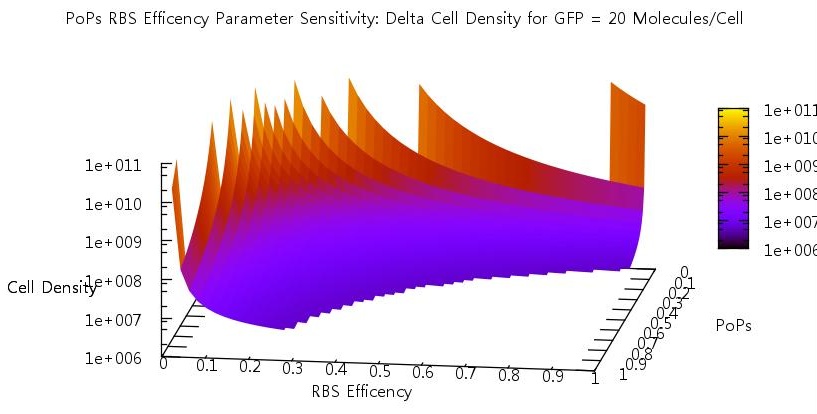
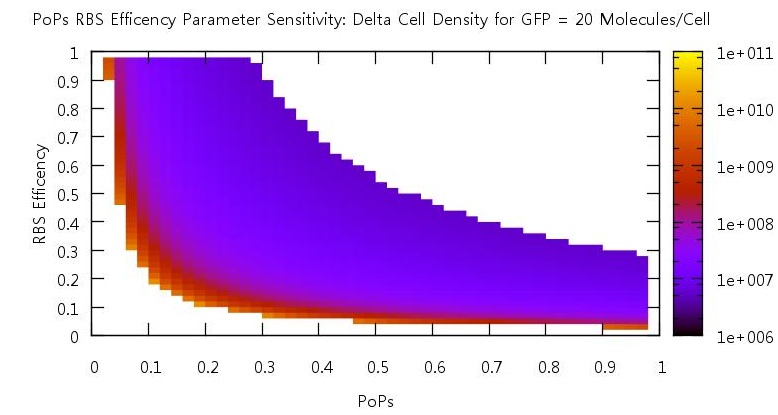
There are two aspects of the quorum sensing network over which we as experimental scientists can control: the speed at which ribosomes translate our proteins and the binding of the promoter. In our model, these two phenomena correspond to the rate of translation kTranslation and kMaxProductionRNA. Thus we felt it would be very useful if we could characterise the beahvaiour of our switch on changing these parameters, since if the switch is to be put to any practical use it will be these parameters which would experimentally be changed. Thus we performed parameter tests changing these rates simultaneously to investigate the effects.
Figure 10
Figure 11
Figure 12
Figure 13
 "
"


