Team:Brown/Modeling/Results
From 2010.igem.org
Results
This page will discuss the insight gained through our mathematical modeling.
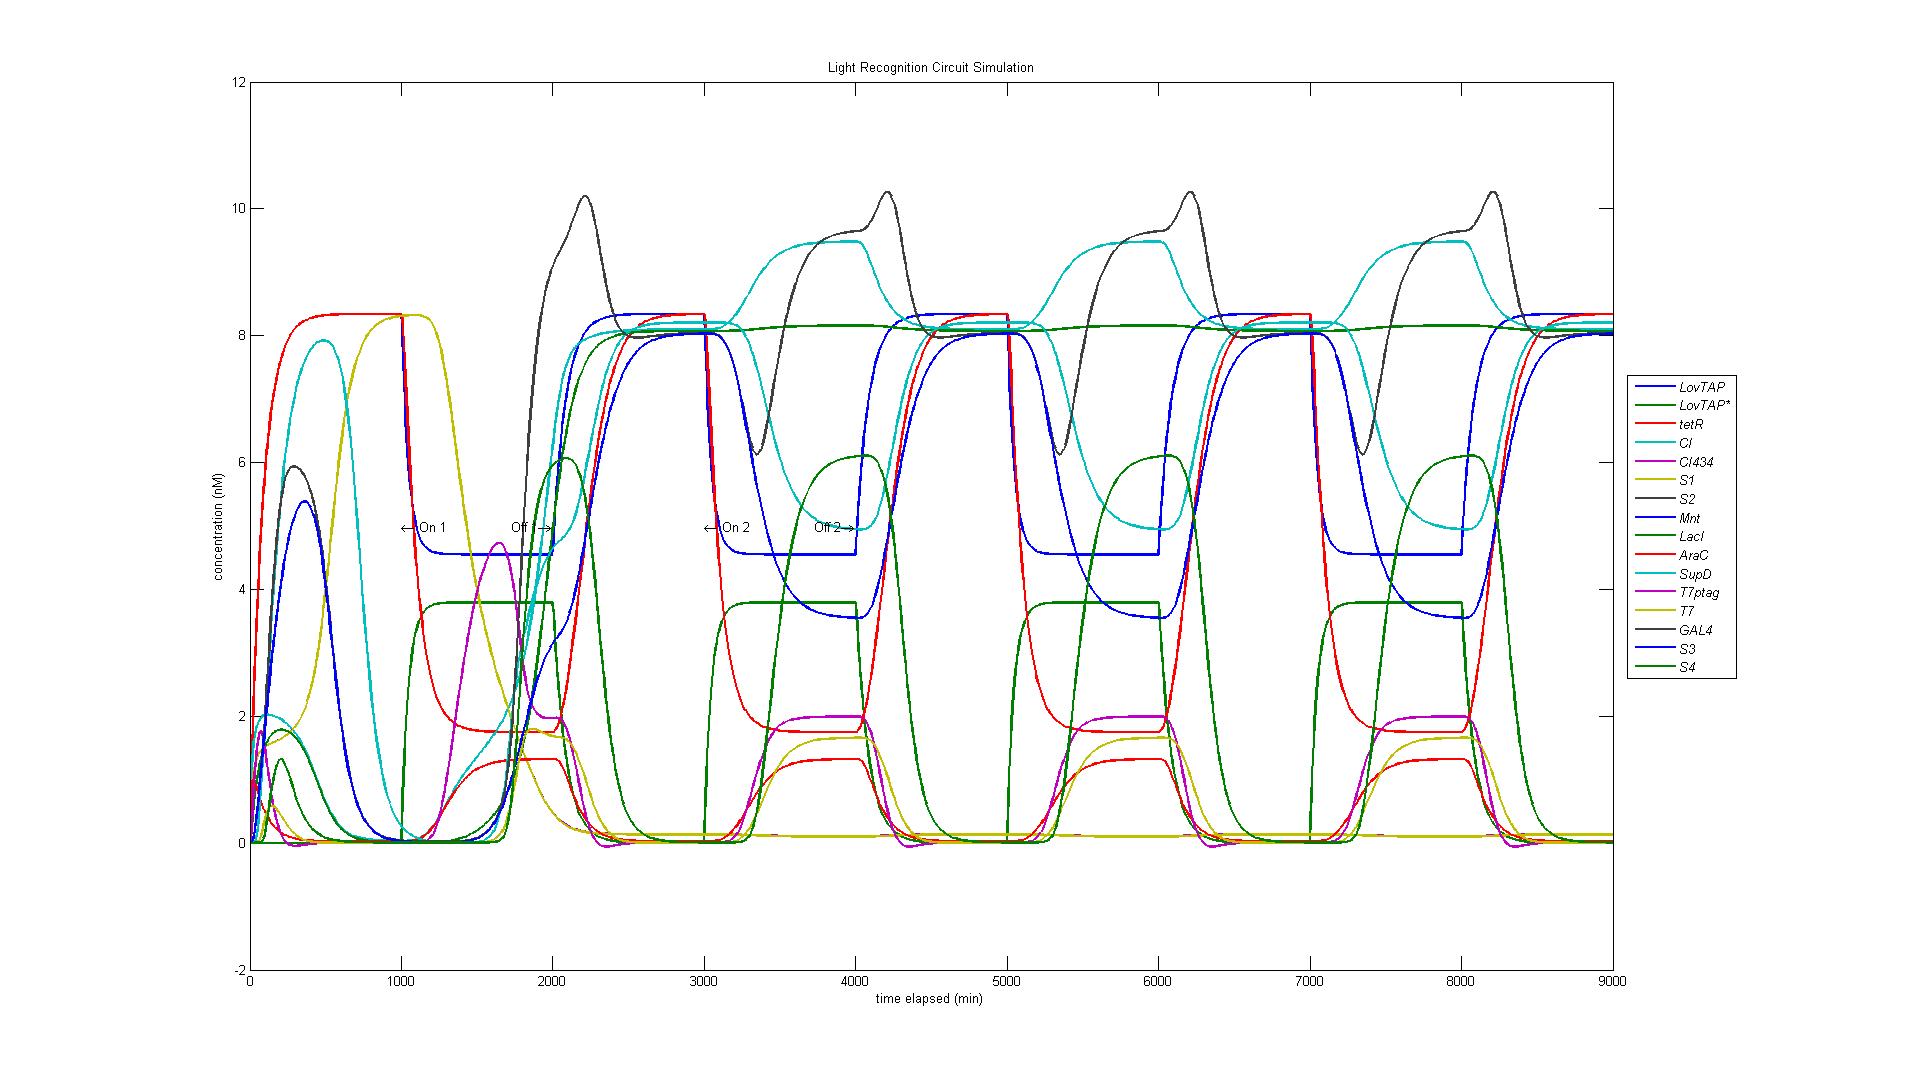
As our circuit is complicated and involved many transcription factors and reporting proteins (see above), results are separated into the modular parts of our circuit.
Results
LovTAP to LovTAP*
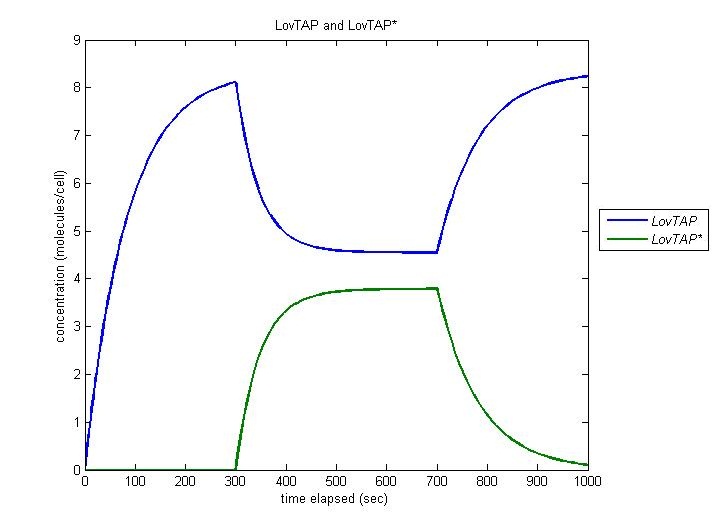
Our entire circuit depends on the conversion of LovTAP to LovTAP* by light. In this simulation, the cell is irradiated at t=300 and this irradiation is ceased at t=700. We observe function as desired, with the concentration of LovTAP as it converts to LovTAP*, and decreasing when the light is turned off.
LovTAP* to CI
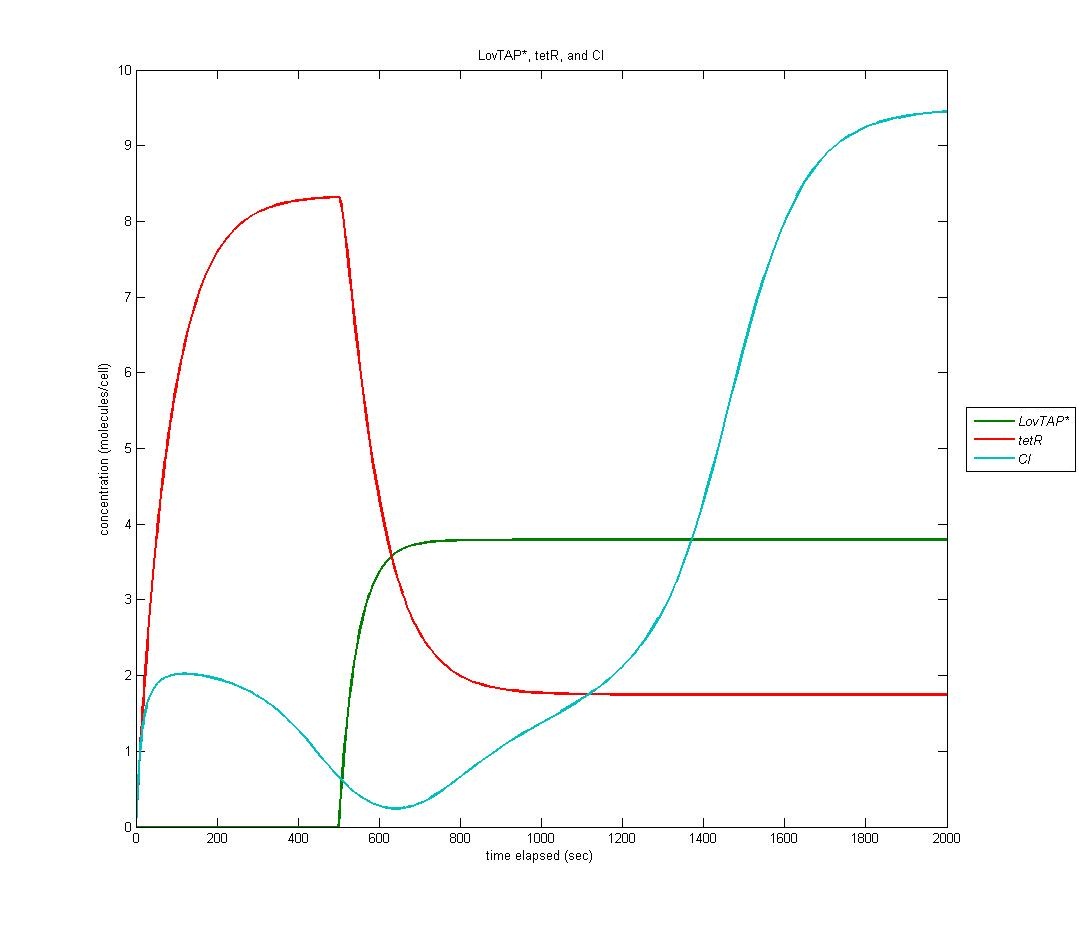
Because LovTAP* is a repressor and we desired light induced induction, we make use of an altered version of the double-repression system designed by EPF-Lausanne. Thus, when LovTAP* represses the TrpR promoter, tetR is no longer produced, allowing production of CI+AraC+Mnt. The graph below shows LovTAP* in green, tetR in red, and CI in cyan. As we can see, the increase in LovTAP* decreases tetR and CI then increases, as desired.
Caveats
This is where we talk about the potential problems with our model
Speculations
This is where we speculate about the future of the project purely based on the model.
 "
"


