Binding Site Design - September
08-09/09/2010
Oligo design for random assembly PCR (raPCR)
Using endogenous miRNAs for cell-identification, a detectable difference in miRNA-expression levels need to be present.
Therefore we sent isolated RNA from HeLa, HUH7 and HEK-293 cells either infected with AAV or non-infected to [http://www.febit.com febit] for microarray analysation of micro-RNA expression levels. The obtained results were delivered in an evaluated form, showing relative expression levels between the different cell lines and/or conditions.
For further experiments, the highest relative differences of two approaches were looked up:
- comparison in one cell line between control and AAV infected status
- comparison in one condition between different cell lines
1. comparison in one cell line between control and AAV infected status
table 1: relative miRNA expression differences, compared between AAV infected and non-infected cells
| Assay | miRNA | relative expression difference (log-scale)
|
| HUH Ctr vs HUH AAV | hsa-miR-520e | -4,68
|
| HUH Ctr vs HUH AAV | hsa-miR-126* | -3,77
|
| HUH Ctr vs HUH AAV | hsa-miR-502-5p | 3,79
|
| HUH Ctr vs HUH AAV | hsa-miR-1179 | 4,00
|
| HEK Ctr vs HEK AAV | hsa-miR-221 | -0,84
|
| HEK Ctr vs HEK AAV | hsa-miR-125a-5p | -0,64
|
| HEK Ctr vs HEK AAV | hsa-miR-3130-3p | 0,58
|
| HEK Ctr vs HEK AAV | hsa-miR-33bStar | 0,59
|
| HeLa Ctr vs HeLa AAV | hsa-miR-20a | -0,88
|
| HeLa Ctr vs HeLa AAV | hsa-miR-93 | -0,66
|
| HeLa Ctr vs HeLa AAV | hsa-miR-1228 | 0,84
|
| HeLa Ctr vs HeLa AAV | hsa-miR-574-5p | 0,92
|
Positive or negative log-values indicate upregulation or downregulation in AAV infected cells compared to non-infected cells of the same cell type, respectively.
2. comparison in one condition between different cell lines
Here are the most up- and downregulated miRNAs shown. One of those were picked for further experiments.
- Identify HUH cells from HeLa/HEK cells:
- hsa-miR-574-5p
| Assay | relative expression difference (log-scale)
|
| HUH Ctr vs HeLa Ctr | -1,00
|
| HUH Ctr vs HEK Ctr | -0,71
|
| HeLa Ctr vs HEK Ctr | 0,29
|
- hsa-miR-574-5p is downregulated in HeLa and HEK cells, compared to HUH. Comparison between HeLa and HEK shows a relatively small difference in expression level.
- hsa-miR-320b
| Assay | relative expression difference (log-scale)
|
| HUH Ctr vs HeLa Ctr | 1,03
|
| HUH Ctr vs HEK Ctr | 1,11
|
| HeLa Ctr vs HEK Ctr | 0,07
|
- hsa-miR-320b is upregulated in HeLa and HEK cells, compared to HUH. Comparison between HeLa and HEK shows a relatively small difference in expression level.
- As for hsa-miR-320b the expression level between HeLa and HEK cells is closer to each other (compared to hsa-miR-574-5p), hsa-miR-574-5p might be the better choice.
- Identify HeLa cells from HEK/HUH cells:
- hsa-miR-29a
| Assay | relative expression difference (log-scale)
|
| HUH AAV vs HeLa AAV | -1,19
|
| HeLa AAV vs HEK AAV | 1,3
|
| HUH AAV vs HEK AAV | 0,11
|
- hsa-miR-29a is downregulated in HUH and HEK cells, compared to HeLa. Comparison between HUHand HEK shows a relatively small difference in expression level.
- hsa-miR-4286
| Assay | relative expression difference (log-scale)
|
| HUH Ctr vs HeLa Ctr | 0,68
|
| HeLa Ctr vs HEK Ctr | -0,68
|
| HUH Ctr vs HEK Ctr | 0
|
- hsa-miR-4286 is upregulated in HUH and HEK cells, compared to HeLa. Comparison between HUH and HEK shows no difference in relative expression level.
- As there is no difference in the relative expression level detected for hsa-miR-4286, it is a promising choice for further experiments.
- Identify HEK cells from HeLa/HUH cells:
- hsa-miR-221
| Assay | relative expression difference (log-scale)
|
| HUH Ctr vs HEK Ctr | -1,13
|
| HeLa Ctr vs HEK Ctr | -1,3
|
| HUH Ctr vs HeLa Ctr | 0,17
|
- hsa-miR-221 is downregulated in HeLa and HUH cells, compared to HEK. Comparison between HeLa and HUH shows a relatively small difference in expression level.
- hsa-miR-125b
| Assay | relative expression difference (log-scale)
|
| HUH Ctr vs HEK Ctr | 1,22
|
| HeLa Ctr vs HEK Ctr | 1,27
|
| HUH Ctr vs HeLa Ctr | -0,05
|
- hsa-miR-125b is upregulated in HeLa and HUHcells, compared to HED. Comparison between HeLa and HUH shows a relatively small difference in expression level.
- As both miRNAs have similar relative expression levels in HUH and HeLa cells, hsa-miR-221 ist taken to test one downregulated sample
Beside this, it is known that hsa-mir-122 is expressed in liver uniquely, at least for humans. Additionally, mm-mir-375/376a are uniquely expressed in mouse livers. As we are heading for divergent prospective experiments, first we want to show that the principle of using endogenous miRNAs for tissue identification tasks is compatible with our constructs for luciferase measurements (compare to Synthetic miRNA-Kit) and our new measurement standard miMeasure.
As it is known !!!reference!!! that multiple miRNA binding sites in a row increase the knock-down efficiency of miRNAs, binding patterns may help to find the right threshold for specific tissue targeting.
Therefore we created a spacer sequence to seperate the single binding sites by rational design with a GC content of 50%. This spacer need to be as innert as possible, in terms of miRNA recognition, so the sequence was then tested for compatibility with other miRNAs. We found two 15bp-spacer, which make up a total 30bp-spacer, with low compatiblity to any miRNA given by the tools mentioned. Highest achieved mean free energy was higher than -30 kcal/mol (the higher, the less effective is the binding), whereas a perfect binding miRNA was, in our cases, always under -40 kcal/mol.
For our random assembly PCR approach, we created oligos using this spacer-sequence as annealing site. Therefore we split the spacer in two halfs, and placed a miRNA binding site in between:
- CACTGAATCCAACTG-miRNA binding site-GCATACATGGACTGC
Spacer sequence:
- SECOND HALFFIRST HALF
- GCATACATGGACTGCCACTGAATCCAACTG
Additionally we created Spacer sequences with 10 or 20 nucleotides between the two halves. If we have time, we could then analyse the effect of the spacer sequence, additionially on the binding site pattern.
Oligos were ordered corresponding to the Primer Table
13/09/2010
Restriction digest of psiCHECK-2 plasmid
This will be used as backbone for raPCR cloning. Enzymes: XhoI and NotI
Assay:
- 5 µL 10x NEBuffer 3
- 5 µL 10x BSA
- 5 µL plasmid (psiCHECK-2, ~370 ng/µL)
- 3 µL XhoI
- 1 µL NotI
- 18.6 µL H2O
Restriction digest was performed for approx. 5h
raPCR to create binding sites for different miRNAs
This random assembly PCR (raPCR) will be done to create binding site patterns for the miRNAs mentioned. In the first PCR step the oligos will basically anneal and constructs of different lengths will form. In the second step, the stop oligos are used as primers to amplify the previously formed constructs.
- first tries are: hsa-mir-122, hsa-mir122(ran9-12) and mm-mir-376a/375 (Oligos: ra001-003 and ra006)
stop-oligos: raPCR_AS13-stop_rev_NotI and raPCR_AS13-stop_fw_XhoI (ra017/018)
spacer: raPCR_AS13-spacer(0) and raPCR_AS13-spacer(10) (ra012/013)
Oligos were used in standard conc. (100µM)
| Oligo | mir-122 | mir-122(ran9-12) | mir-375/376a
|
| miR | 1 or 3 µL | 1 or 3 µL | 0.5 or 1.5 µL (each)
|
| spacer(0)or (10) | 1 µL | 1 µL | 1 µL
|
| stop | 0 or 0.5 µL each | 0 or 0.5 µL each | 0 or 0.5 µL each
|
Total: 12 reactions
each reaction was set up in 30 µL, using 2x Phusion Mastermix for 12 cycles
| Temp | Time |
|
| 95° | 05:00 |
|
| 95° | 00:30 | x 12 cycles
|
| 57° | 00:45
|
| 72° | 00:45
|
| 4° | forever |
|
- PCR purification: each PCR was purified using Qiagen PCR purification Kit and eluted in 32 µL
for the next PCR, three assay will tried:
- 5µL eluate + 1 µL of each stop oligo in 50µL total volume
- 5µL eluate + 2 µL of each stop oligo in 50µL total volume
- 20µL eluate + 1 µL of each stop oligo in 50µL total volume
stop-oligos: raPCR_AS13-stop_rev_NotI and raPCR_AS13-stop_fw_XhoI
In total there were 72 reactions. Each was run with 2x Phusion Mastermix, missing volume was filled with water.
| Temp | Time |
|
| 95° | 05:00 |
|
| 95° | 00:30 | x 25 cycles
|
| 65° | 00:45
|
| 72° | 00:50
|
| 72° | 05:00 |
|
| 4° | forever |
|
DNA was stored in fridge afterwards
14/09/2010
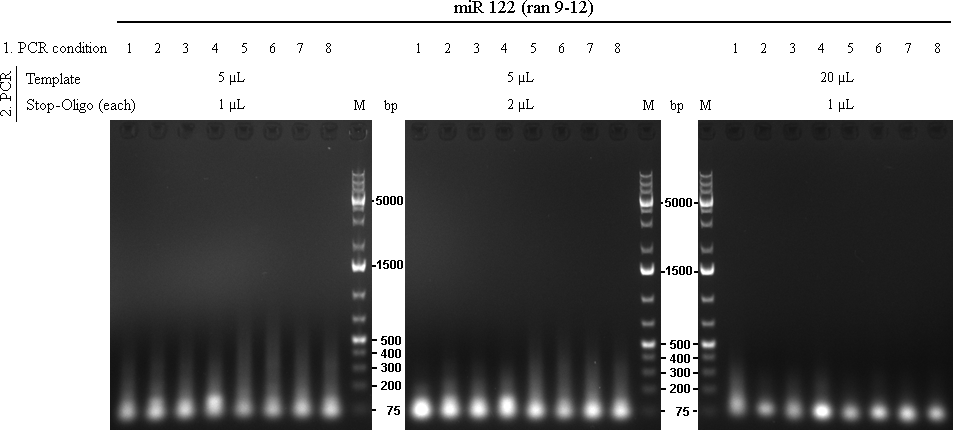
The 72 PCRs from 13/10/2010 were analysed on 1% agarose gel.

raPCR using a mixture of miRBS-375 and miRBS-376a oligos The initial 8 PCRs from the first raPCR were purified using Qiagen PCR Purification Kit, eluted in 32 µL and used as template for the second raPCR.

raPCR using miR-122 oligos The initial 8 PCRs from the first raPCR were purified using Qiagen PCR Purification Kit, eluted in 32 µL and used as template for the second raPCR.

raPCR using miR-122 (ran9-12) oligos The initial 8 PCRs from the first raPCR were purified using Qiagen PCR Purification Kit, eluted in 32 µL and used as template for the second raPCR.
table 1: conditions for 1st raPCR
| 1. ra PCR condition | Template-Oligo [µL] | Stop-Oligo [µL] | Spacer-Oligo (1µL) [bp]
|
| 1 | 1 | 0 | 0
|
| 2 | 1 | 0 | 10
|
| 3 | 1 | 10 | 0
|
| 4 | 1 | 10 | 10
|
| 5 | 3 | 0 | 0
|
| 6 | 3 | 0 | 10
|
| 7 | 3 | 10 | 0
|
| 8 | 3 | 10 | 10
|
As we are looking for multiple binding sites, lanes with longest smear, meaning more long binding sites, were choosen for preparative gel:
Over all assay, using 5 µL template and 1µL of each stop-oligo seem to give the best result.
Following lanes were cut out of the gel for further cloning steps:
- Spacer(0): lane 5
- Spacer(10): lane 6
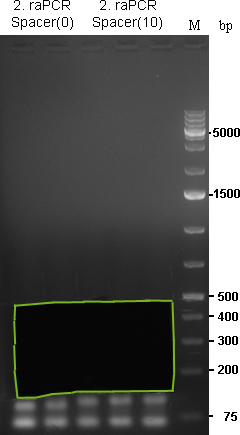
Samples for miR122 were applied to a preparative agarose gel (1.5%). Lanes were cut out from approx. 100 to 400bp and splitted at ~250bp. Therefore, we should have small binding site patterns (between 100 and 250bp) and larger binding site patterns (betweens 250 and 400bp) with either a shorter (Spacer(0)) or longer (Spacer(10)) spacer region.
 Preparative gel for 2. raPCR of miR-122 was cut out in the freamed region. |  Preparative gel for 2. raPCR of miR-122 (ran9-12) (1: Spacer(0), 2: Spacer(10)) and miR-275/376a (3: Spacer(0), 4: Spacer(10)) was cut out in the freamed region. |
As the gel volume was too much for dissolving in a single 2 mL tube, each part was splitted for dna extraction and brought together on the column. Gel extractions were done according to Qiagen Gel-extraction kit protocal and eluted in 30 µL water.
15/09/2010
Sample code:
- Spacer(0) - 100-250bp: 0S ("zero small")
- Spacer(0) - 250-400bp: 0L ("zero large")
- Spacer(10) - 100-250bp: 10S ("ten small")
- Spacer(10) - 250-400bp: 10L ("ten large")
- this System was used for each raPCR after gel purification
First row of cloning will be done with miR-122 samples. Others will follow.
Samples prepared: 122-0S,-0L,-10S,-10L
Gel extracted samples were digested with NotI/XhoI for cloning into psiCheck-2 vector:
5µL DNA (2µL for backbone) in a total volume of 30µL using 1µL XhoI and 0.6µL NotI enzyme, for 1.5 h at 37°C.
The digested DNA was then purified using Qiagen nucleotide removal kit and eluted in 30µL.
Subsequently, digested fragments were ligated over night at room temperature.
Ligation assay for Fermentas T4 ligase:
2µL Buffer
1µL Ligase
7µL water
1µL Backbone (6000bp, psiCHECK-2)
9µL purified restriction digest
16/09/2010
Transformation of ligations:
5µL ligation assay in 50µL TOP10 E.coli
25 min on ice
45sec heat shock on 42°C
1.5-2h shaking at 37°C
plated 200µL on Ampicillin-LB/Agar-Plates
after incubating ~8h, at 37°C, the plates were incubated overnight at room temperature
17/09/2010
Colonies were visible in reasonable numbers on every plate
Colony PCRs were performed to check for positive clones.
Primer for colony PCR were stop-oligos, used in the raPCR. The PCR was performed in a total volume of 20 µL.
One colony was dissolved in 20µL water. 5µL of this bacteria solution was used as PCR template. PCR conditions as recommended from Fermentas (see link above).
From each plate, 10 colonies were picked (40 in total).
Colony PCRs were then analysed on 1.5% agarose gel. Result: all negative
Troubleshooting....
Minipreps were prepared (5mL - LB-ampicillin) for each sample for text digestion (over night, shaking @37°C)
18/09/2010
Plasmid DNA was purified from over night cultures using Qiagen Plasmid Miniprep Kit according to the protocol. Elution was performed in 30 µL water.
Concentrations ranged from approx. 400 to 788 ng/µL.
Test digestion with NotI/XhoI was performed for 1h at @37°C and analysed on an 1.5% agarose gel. No insert was visible.
19/09/2010
Troubleshooting: Possible Problems
- we got the wrong backbone (given by Stefan M.) -> assure we have the right one
- backbone was not fully digested -> several test digestions
- insert was not fully digested -> can not be checked
- enzymes out of function? -> single digest of the vector can check that
- ligation did not work -> reaction was performed according to usual lab routine and protocol
- low transformation efficiency -> reaction was performed according to usual lab routine and protocol
- bacteria are not competent -> they work for other transformations
Testing steps:
- digestion of psiCHECK-2 given by Stefan M.
- test-digestion of psiCHECK-2 given by Stefan M. again and compare both
- repeat all steps
Over night digestion of backbone was performed at 37°C. 0.5 µg DNA was digested with 1 µL Enzyme in NEB Buffer 3 + BSA in a total volume of 30µL
20/09/2010
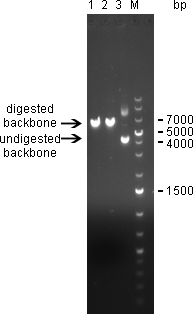
Digestion of psiCHECK-2 plasmid was analysed on 1% agarose gel:

Single digest of psiCHECK-2 Plasmid was digestet overnight @37°C with NotI/XhoI using NEB Buffer 3 + BSA in a total volume of 30µL. 1)Digest with NotI 2)Digest with XhoI 3)undigested plasmid
Here we can see that both enzymes cut the plasmid. The linearized vector (visible at 6 kpb) in general shows up as a higher band than its undigested version, which is here visible at 4 kbp. Where the undigested plasmid shows concatemers, those are not visible after digestion, which proofs again for succesful digestion.
The new digested plasmid-backbone was used for repeat of the ligation.
21/09/2010
- miR122 samples were ligated into psiCHECK2-plasmid
Ligation was performed for 4h @25°C (1µL NotI/XhoI-linearised psiCHECK2-plasmid + 4µL digested raPCR product) using Fermentas T4 Ligase.
Afterwards they were transformed into TOP10 E. coli and grown over night in LB-Ampicillin-medium
22/09/2010
Plasmid DNA was extracted from over night cultures using Qiagen Plasmid Miniprep Kit.
DNA was then analysed via test-digestion with NotI/XhoI Enzymes.
Test digestion was performed in 20 µL using 0.4µL Enzyme, supplied with NEB buffer 3 and BSA for 1h @ 37°C.
Test digestion was then analysed on a 2% agarose gel.
No sample showed any insert....
28/09/2010
miR-122 samples were sent for sequencing (by GATC)
1: 0S
2: 0L
3: 10S
4: 10L
- send 1.3, 1.5, 1.7, 3.8, 3.2 for sequencing
29/09/2010
- got sequencing results of 1.3, 1.5, 1.7, 2.8, 3.2.
- Spacer(0)
- 1.3 - 3 binding sites - all ok
- 1.5 - 2 binding sites - both ok
- 1.7 - 3 binding sites - all ok
- 2.8 - not ok
- Spacer(10)
- 3.7 - 2 binding sites - both ok
30/09/2010
- raPCRfrom above(1, 2, 3, 4)
- PCR purification ( nanodrop: c ~ 100ng/µl)
- digested: 2 x 1 µg DNA:
-
- gel purification (nanodrop: c ˜ 25ng/µl)
- Ligation (Quick Ligase and overnight ligation with T4 ligase) into pSB1C3
- Vector ~ 2000 bp
- Insert ~ 200 bp

 "
"


