|
|
Experiment Design
We designed different experimental set-ups with varying complexity to test RNA signal/switch pairs based on our concept.
Our initial idea to prove our concept of antitermination was to use fluorescent proteins as reporters. This approach gives the opportunity to measure the termination and antitermination efficiency of our designed BioBricks in vivo as well as in vitro, the latter using a translation kit based on E. coli lysate. Later on, we decided to develop an experiment, that relies only on transcription. In this set-up, we used a fluorescent dye, malachite green, that binds a specific RNA aptamer and thus makes it possible to detect transcription activity.
In vivo Measurements
In vivo measurements have the highest complexity compared to any other experimental set-up. Our system has to deal with several circumstances a cellular environment comes with, such as interaction with other RNAs, degradation by RNases or unspecific interactions. Nevertheless, the measurements are essential, as our switches should finally work inside cells to fulfill our vision of an intracellular logic network.
Read more
Design
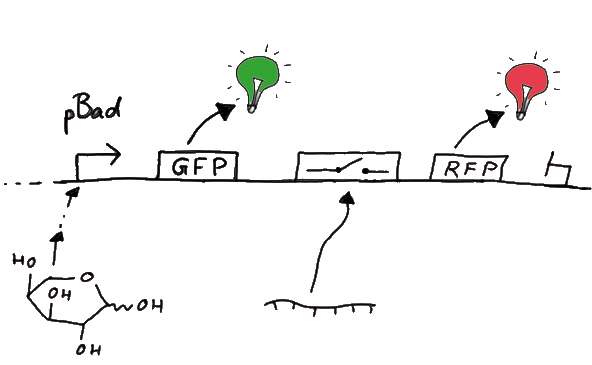
For the measurements in vivo we decided to use an expression cassette consisting of Green Fluorescent Protein (GFP) coding sequence upstream of the switch and another fluorescent protein coding sequence downstream of it. Both protein coding sequence carry the same ribosome binding site, therefore, the GFP fluorescence can be used as internal control in measurements. Since the spectra should not overlap and to avoid FRET as well as an pure overlap of the spectra, we settled on the usage of red fluorescent protein variants, namely mRFP1 in the first try. While the GFP fluorescence is used to normalize the measurements, the RFP fluorescence is used to detect termination/antitermination.
Upon binding of the signal, the stem loop of the switch would resolve leading to red fluorescence. The GFP fluorescence as internal control carries the advantage that errors in the measurement set can be detected easily. Lack of arabinose or promoter insensitivity can be recognized as well as problems with the fluorescence measurement itself. Plus, we have a way to normalize our measurements and compare different preparations in relation to each other.
Construction and Cloning
Our measuring plasmid is based on the BioBrick pSB1A10, A1, distribution 2010. Unfortunately after two months of cloning we had to recognize that the plasmid in use did not work, see also pSB1A10 Falsification. So after the first unsuccessful attempts we decided to reclone the system, substituing RFP to mCherry, a dsRED derivative with a spectrum in the far red, and adding arabinose inducible promoters in front of both fluorescent proteins.
To control the expression of the switch, the particular DNA sequence itself is under the control of an IPTG dependent promoter. In the future we want our networks to be able to respond to a variety of external signals like small metabolites, ions or whatever can be found in the parts registry. For a start we went with an established and well-working system like the lac-operon. ---> PLASMID MAP
So upon induction with arabinose a rise of GFP expression can be seen. To monitor changes in gene expression we put our E. coli cells in a fluorimeter and measured fluorescent. It worked quite nicely with living cells in a fluorimeter, the only thing to avoid is too much scattering: the cell density should not exceed an OD600 of ???. Continious stirring and a set temparature at 37°C allowed measuring over severall hours. Cell density was checked in between.
Measurement
For switch evaluation, IPTG was added to the cells after about two hours after arabinose induction (baseline). ??? Stimmt das?? A rise of RFP/mCherry emission should be visible in case of a working switch.
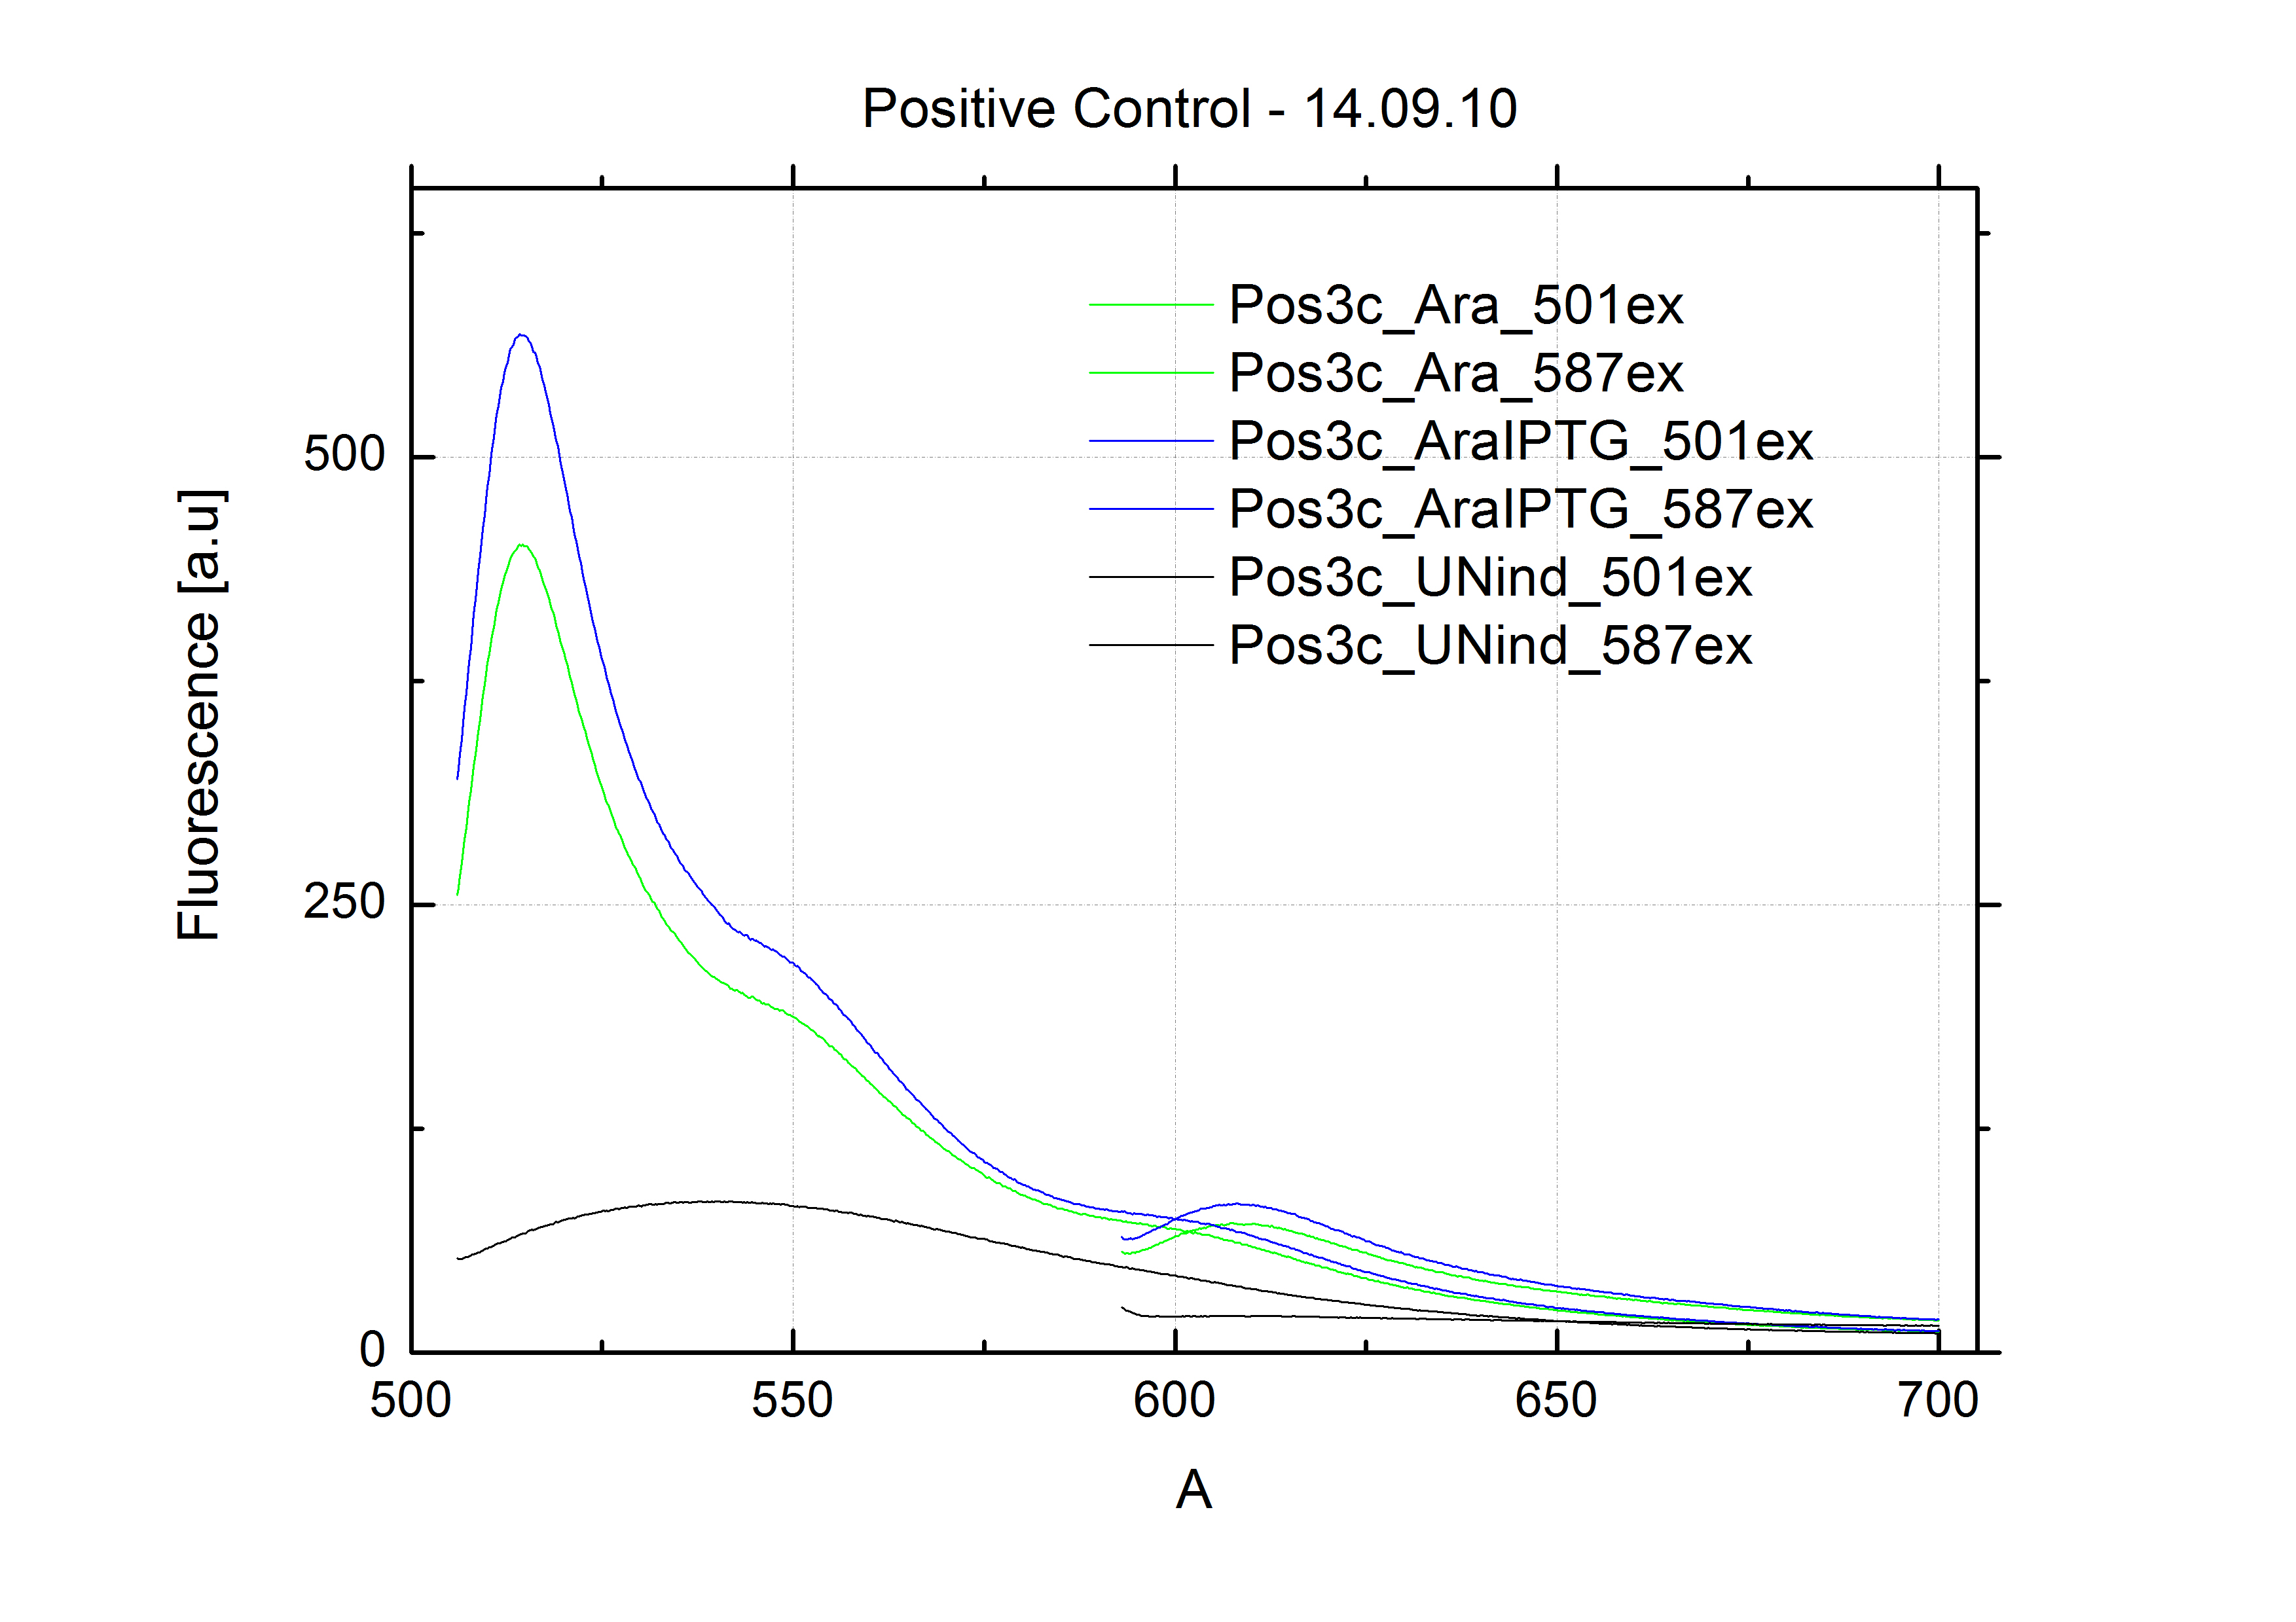
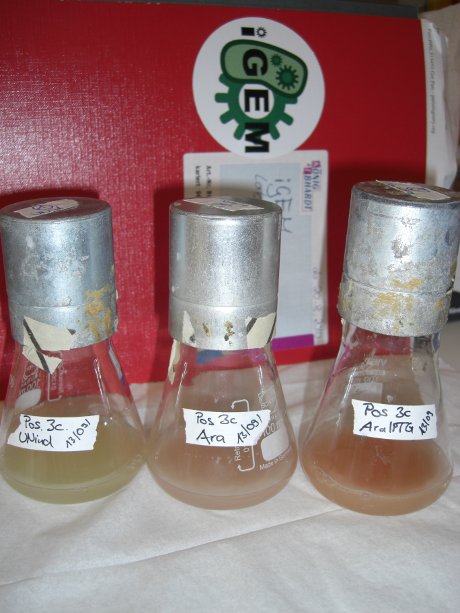
For evaluation of the measuring plasmid itself we incorporated a positive control in every measurement. A random sequence in between GFP and RFP/mCherry was chosen in a corresponding length. An increase in both GFP and mCherry was detectable in the positive control and in the same amount after quantum yield correction, proving that the measuring plasmid is working nicely.
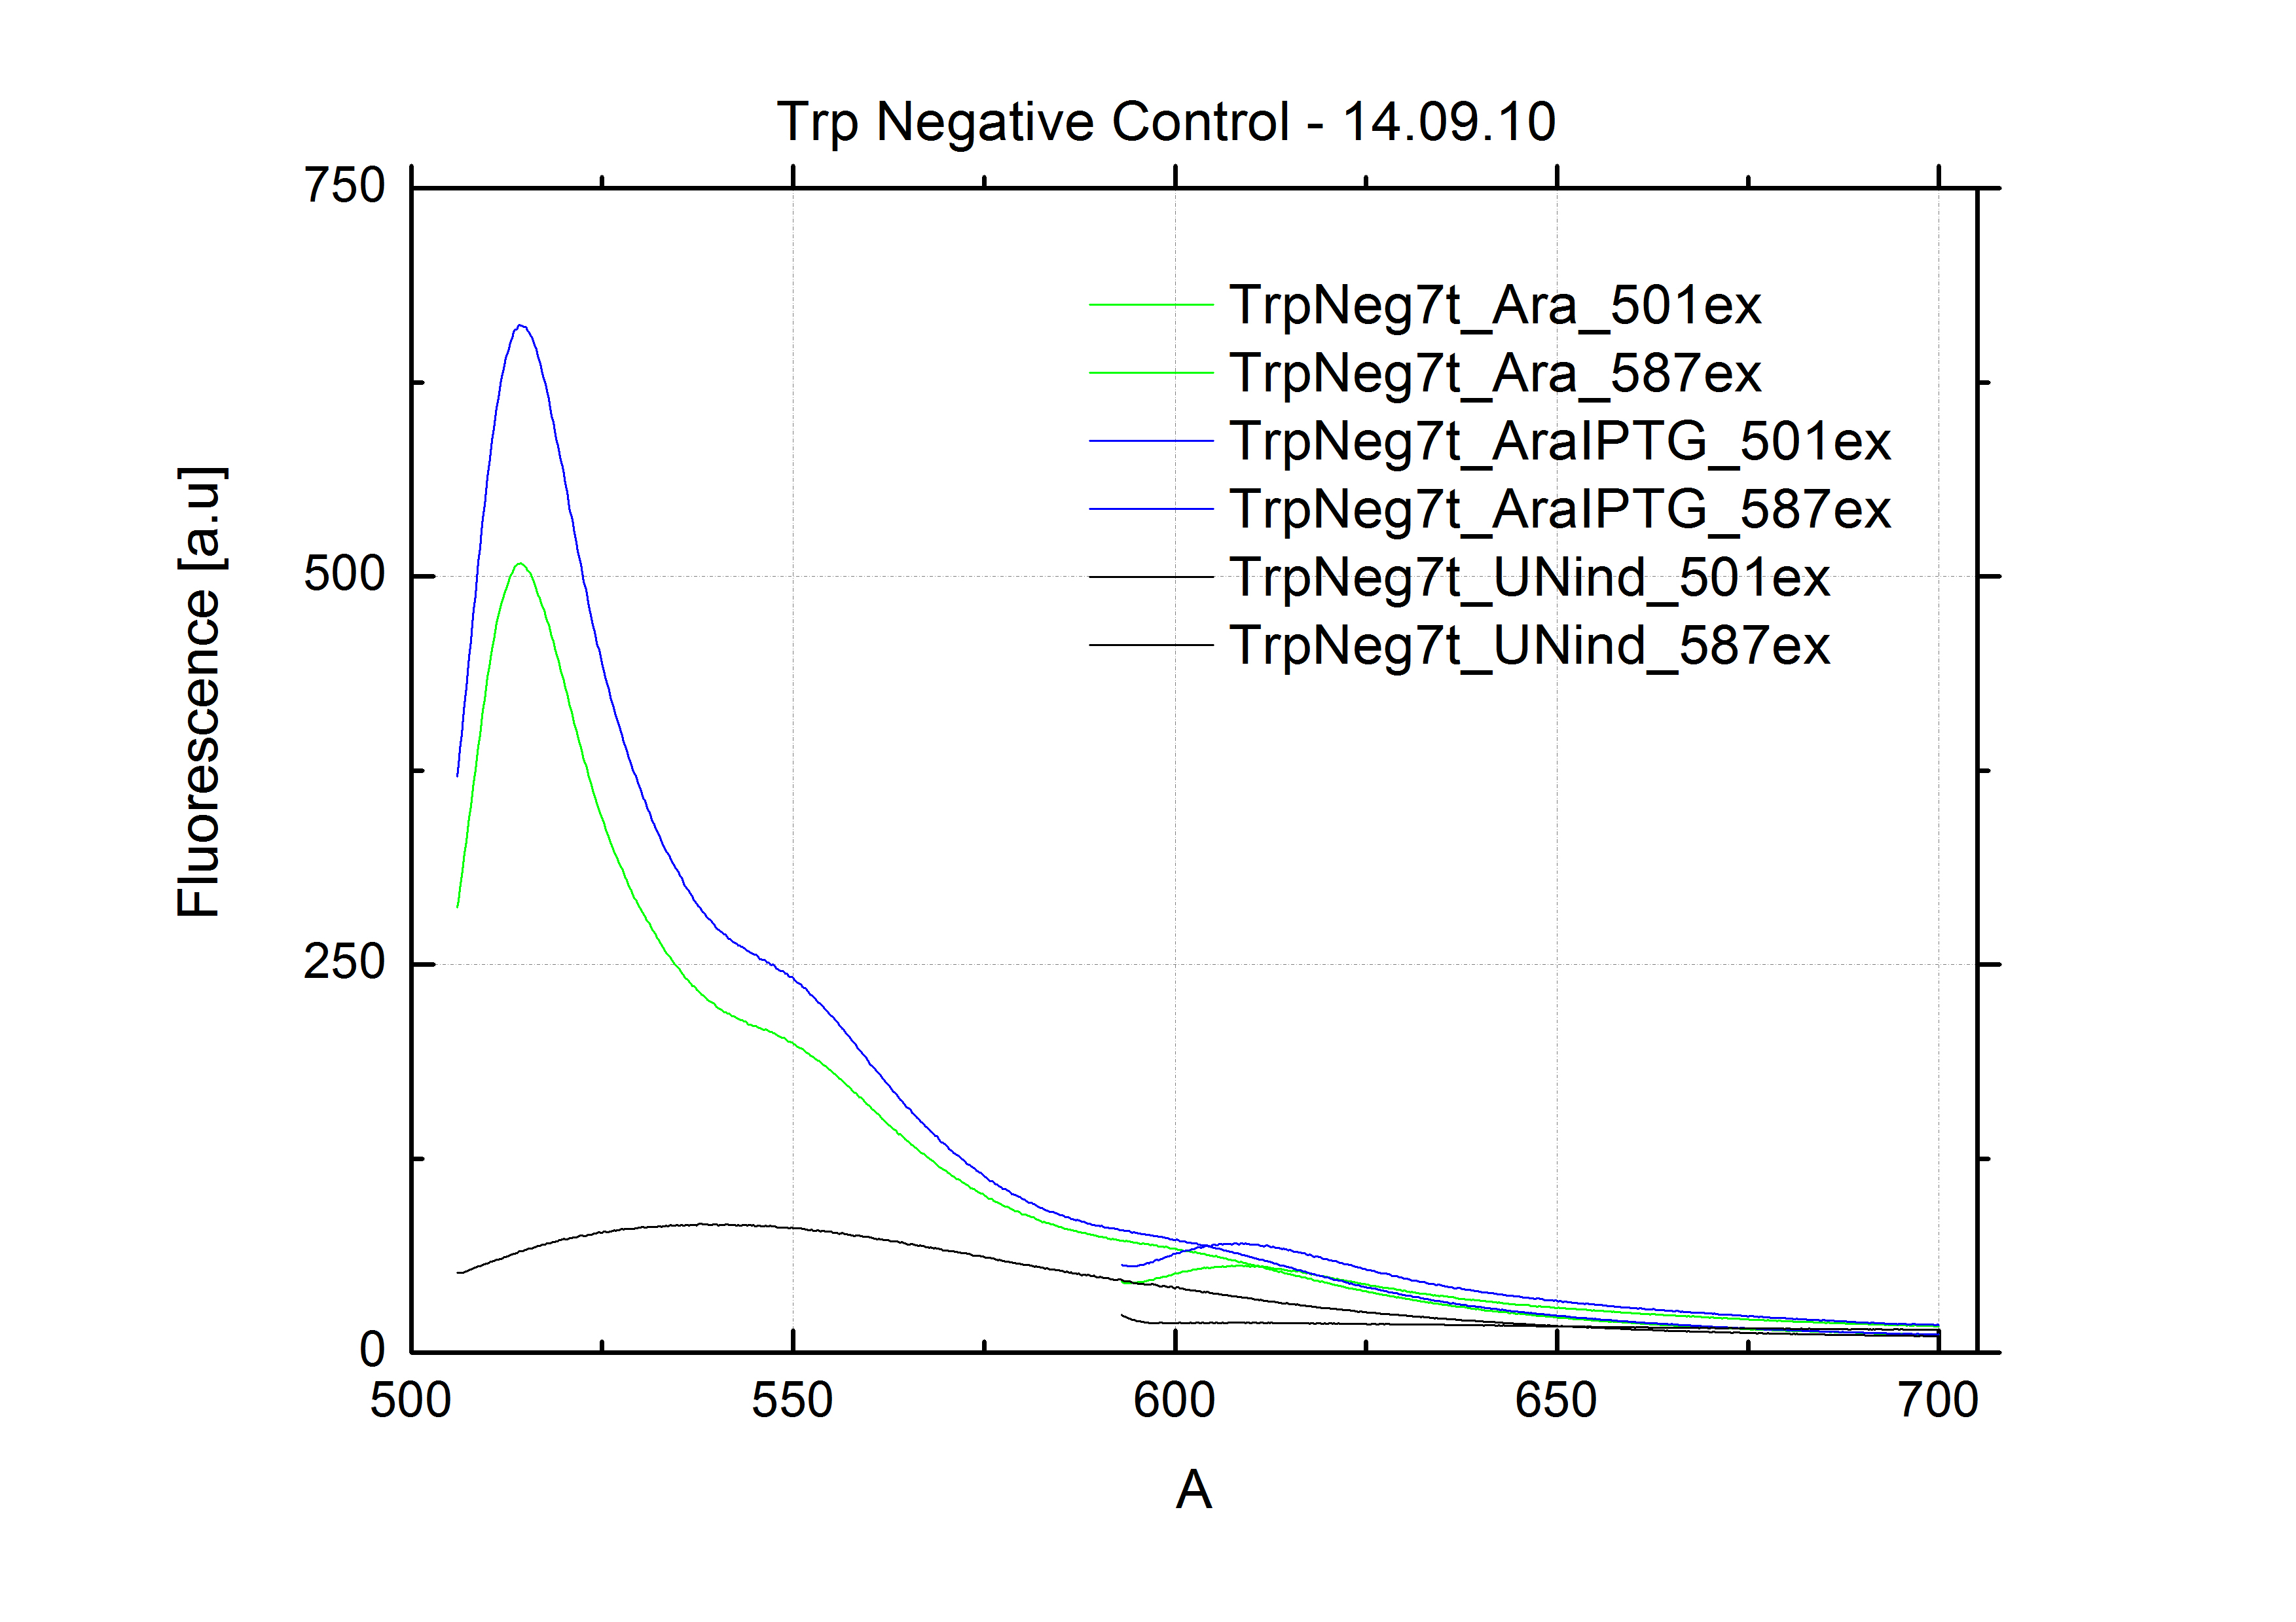
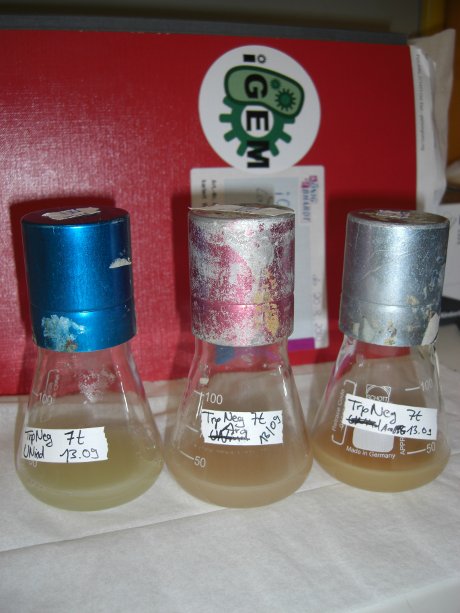
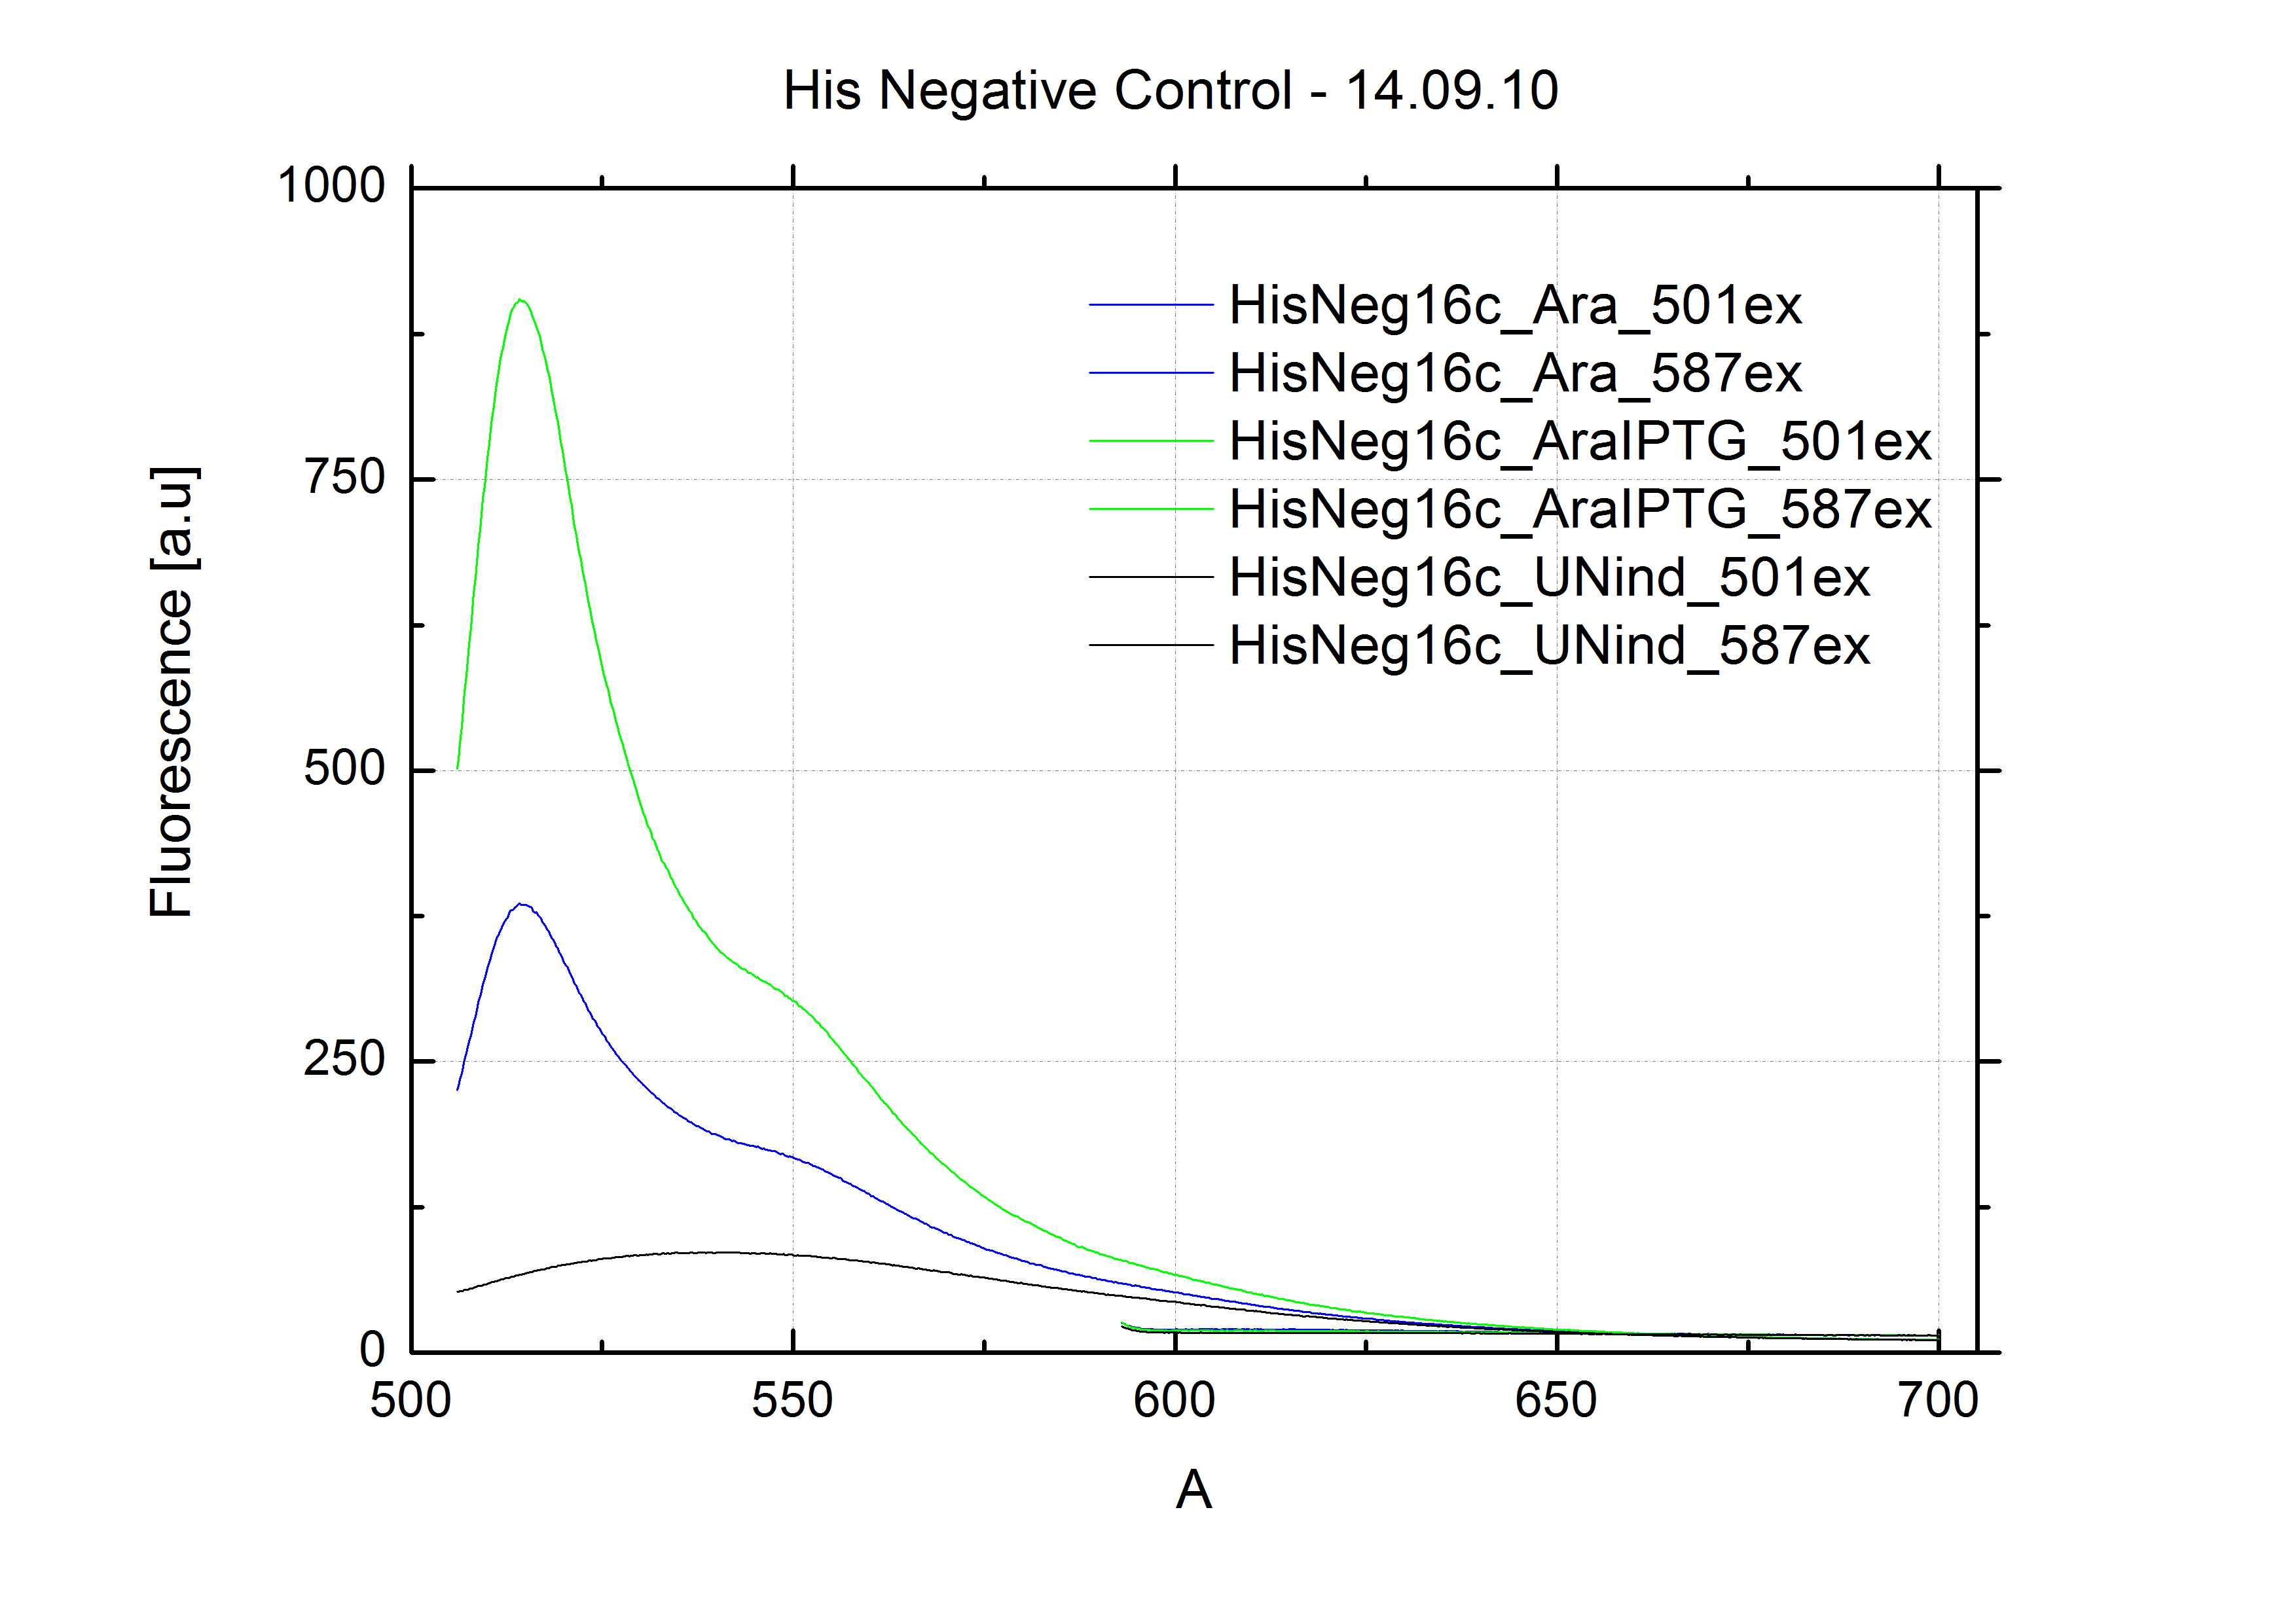
As a negative control we measured the same plasmids as for every switch but without a short RNA signal to open the terminator. Since our switches are effective terminators if no signal is bound, transcription can not occur and no RFP/mCherry is produced.
When measuring the termination of our BioBricks and the antitermination by their corresponding signal-RNA, we should be able to observe an increasing RFP emission compared to the GFP emission upon induced signal-RNA production in the cells/in the kit:
With these measurements, it should also be possible to observe differences in efficiency of termination as well as antitermination between our designed switches.
Close
In vitro Translation
In vitro measurements with E. coli lysate make the fluorescence signals independent of cell growth and physical or biological factors, e.g. cell density or growth stadium.
Read more
Design
In this assay we used the same constructs as engineered for the in vivo studies.
Measurements
We used the cell-free E. coli S30 extract system for circular DNA provided by promega[1], which is prepared by modifications of the Method Zubay et al.[2] described. The characterization of the kit can be obtained from the [http://partsregistry.org/Cell-free_chassis/Commercial_E._coli_S30 Parts Registry].
We perform our experiments at 37°C with an amount of approxim. 1 ug plasmid in a reaction volume of 50 uL. Measurements are carried out in a jasco fluorolog, where the fluorescent proteins RFP and GFP are excited and fluorescence is detected, so measurements are done more or less the same as in our in vivo studies. A general problem occuring in the experiments was the low capacity of the kit. The signal intensity is very low, which made it difficult to observe any signal intensity alterations.
Close
In vitro Transcription
An experiment, in which we detect In vitro transcription, offers an elegant way for a fast and easy prove of principle, since our switch is RNA-based and the whole mechanism takes place on trancriptional level. Most side effects occuring in a complex environment given in a cell or a cell lysate do not arise here.
Read more
If measureable effects with our basic concept can be seen in vitro, we can use the so gained data to optimize the system in vivo. Since we are working on a totally new principle of trancriptional control, we used this approach for easy variation of different variables like the length of the core unit and the switch to signal ratio.
To study the switches on the transcriptional level gives the advantage, that we would have less interferences and possible artefacts. Also, we are not sure how cellular mechanisms like degradation of RNases or interacting factors as well as molecular crowding influence our systems.
Working with in vitro systems also has the advantage that an input is not needed anymore and the output can also be generated easily. We used two readouts with two different transcription systems to check and investigate our devices: First, we used an malachitegreen-binding aptamer for an fluorescent output (which will be described in detail later) and second, we simply put our reaction educts on an denaturing acrylamide-gel to check for RNA varying in length. As for two different transcription systems we used on the one hand E. coli-RNA Polymerase (RPO) based transcription since the aim is to apply our system in vivo and on the other hand T7 based transcription which is well established through literature.
T7 RNA polymerase
The T7 RNA polymerase is known for satisfying RNA yields together with easy handling. In our approach we had PCR amplified, double stranded switches with an malachitegreen binding aptamer following after the switch (133 bp, see section below) and a single stranded signal with about 30 bp length.
For in vitro expression the T7 RNA Polymerase requires a double stranded promotor region at the beginning of the DNA template but is otherwise capable of handling single stranded DNA, so a sense strain corresponding to the T7 promoter region was added. Transcription is more effective with double stranded DNA as template. Since we ordered the signal sequences we tested we chose the cheaper way in the beginning by using single stranded signals with corresponding sense T7 pieces and switched to double stranded constructs after narrowing down the most promising switch/signal pairs.
E. coli RNA polymerase
In comparison to the T7 RNA Polymerase the E. coli RNA Polymerase requires slightly more sophisticated proceedings when it comes to the design of switches and handling of the enzyme. The biggest in our case was to store it properly since the only -80°C fridge was in another building.
E. coli RPO was ordered saturated with σ70-factor. The switch consists of an ???-promoter, the switch itself and a ???.
Denaturing Polyacrylamide gel electrophoresis
We also used Polyacrylamide gel electrophoresis (PAGE) for evaluation of termination efficiency of our basic units. Gels containing 15 % acrylamide and 6 M urea were used for separation of 90 (terminated by switch) and 133 bp (continous reading) RNAs.
Polyacrylamide gels seperate RNA and DNA according to their size in an electric field. Since the negative charge equals the size of nucelotides in the RNA/DNA, the number of base pairs can be compared between two samples often with one base pair resolution. Since RNA forms three-dimensional structures, the samples are preheated and run in 6 M urea. The polyacrylamide gel is stained in SybrGold afterwards which binds to both single and double stranded DNA and RNA.
Denaturing PAGE is a simple yet elegant way to check for transcription efficiency and termination rates. Since it is a very direct way and it provides a simple yet clear readout, we used it as another method beside the more sophisticated malachitegreen binding assay to evaluate and characterize our switch.
Malachite green assay
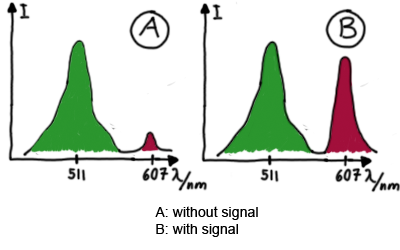
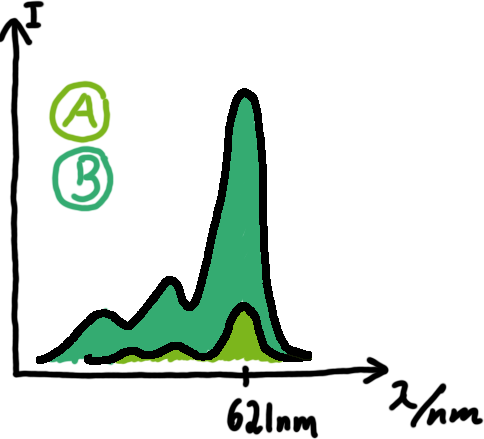 Emission spectra of malachite green; A: without signal-RNA, B: with signal-RNA Malachite-green is a dye with a negligible fluorescence in solution but undergoes a dramatic increase if bound by a RNA -aptamer. Upon binding to the aptamer, the fluorescence of malachite-green increases about 3000 times making it an exceptionel good marker. Since the binding is very specific, transcription in dependence of a signal can be monitored by measuring the fluorescence of malachite-green over time if the aptamer is located behind the switch. Transcription of the aptamer will only take place after anti-termination by a signal. An increase should be visible over time.
For the T7-based measurements we ordered single stranded signals for a first attempt and added matching single strands complementary to the T7 promoter region. The switch was amplified using PCR and consisted of the following elements: Primer-binding site - T7 promotor - switch - malachitegreen binding aptamer. Upon binding of a correct signal to the switch, the stem loop dissolves and transcription is possible.
OLD: A second possibility to measure parameters of our switches we came up with, was the idea to investigate our system on the transcriptional level only. Therefore, we decided to use malachite green as reporter. Malachite green in a fluorescent dye, whose emission increasing dramaticly (about 3000 times) upon binding of a specific RNA-aptamer. The RNA-aptamer
---concept to be described, as well as literature---
<ref>refs</ref>
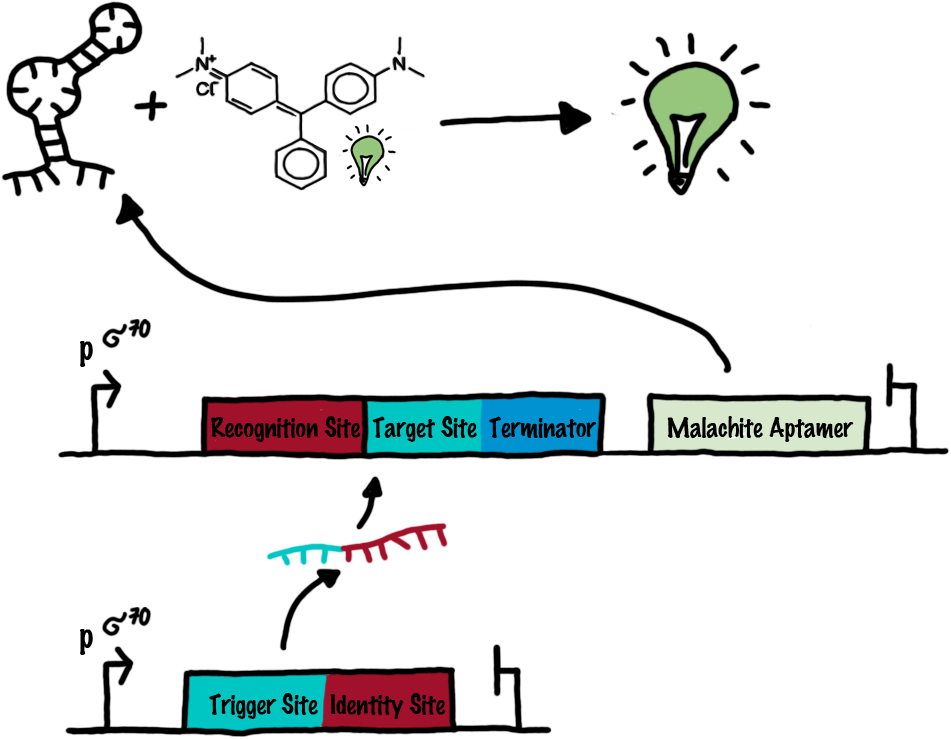
We made constructs comprising of a sigma(70)-binding promoter followed by a short nonsense sequence, the switches and the aptamer sequence.
Also we made constructs, where the transcription of the signal-RNA is under the control of a sigma(70) promoter. These two linear DNA-constructs, together with the e.coli RNA-polymerase and the right buffer conditions should represent an easy-to-handle measurement kit on the transcriptional level.
Close
References
[1] http://www.promega.com/catalog/catalogproducts.aspx?categoryname=productleaf_335&ckt=1
[2] Zubay, G. (1980) Meth. Enzymol. 65, 856–77, Zubay, G. (1973) Ann. Rev. Genet. 7, 267–87.
Experimental Results
In vivo Measurements
In vivo
In vitro Measurements
Read more
Protocols
Molecular Biology
PCR
Read more
a) Taq Polymerase 'Hot Start'
PCR Pippeting plan:
1 µl template
1 µl dNTP 10 µM
1 µl G1004 (Primer) 10 µM
1 µl G1005 (Primer) 10 µM
5 µl 10x Taq-buffer (500 mM KCl, 100 mM Tris-HCl (pH 8.3), 15 mM MgCl2)
0,2 µl Taq-Polymerase (add last) 5,000 U/ml
40.8 µl Water
Final volume 50µl
Processing: ( program saved as IGEMPCR )
- preheating of PCR chamber to 94 °C
--> insert sample
- 30 sat 94°C (according to IGEM protocols)
- 30 s at 56 °C
- 45s at 72°C
- 7 min at 72°C
- stay at 4°C
b) colony PCR
- Colony PCR
- pick colonies and resuspend them in 20 µl LB+Antibiotic (each)
- PCR of 2 µl of each sample, 2 µl as negative control (Program: ColonyPCR, modified), store remaining 18 µl for overnight cultures
- afterwards, mix 15 µl of each PCR product with 3 µl GLPn and load to Gel
- make overnight cultures of positive clones by adding the remaining 18 µl to 5 ml LB+AB
program:colonypcr
- preheating of PCR chamber to 94 °C
--> insert sample
- 5 min 30 sec at 94 °C
- loop 35x:
- 30 sat 94°C (according to IGEM protocols)
- 30 s at 58 °C
- 60s at 72°C
- 7 min at 72°C
- stay at 4°C
Close
Digestion
Read more
Ligation
In vivo Measurement
Read more
So haben wir in vivo gemessen
Close
In vitro Translation
Read more
So haben wir in vitro gemessen
Close
In vitro Transcription
Read more
So haben wir in vivo gemessen
Close
Lab Book
Explanations
In the following we present an overview regarding our work in the lab. For easier understanding we summarized the work of each week using colored boxes. To get more information about the work and results of a specific week, just click on the according week number. To get a better overview we used the following color code for the boxes:
| The red box represents general cloning steps that were required for our measurements. See the protocol section for further details.
|
| The blue box indicates in vivo measurements which are described here.
|
| The green box indicates in vitro measurements relying on in vitro transcription and malachite green measurements. Details can be found here.
|
| The yellow box represents measurements done with an in vitro translation kit and is described in more details here.
|
Chronological Lab Book
Week01
in vivo constructs
08.04.2010
Flo & Philipp
PCR
- samples:
- R0011_His
- R0011_Trp
- Control
- protocol: protocols
- templates: purified PCR products from 5.2.2010
- primer G1004/1005
- polymerase: Taq
- programm: igempcr
Purification of PCR products with QIAquick PCR purification Kit
- protocol followed. exceptions: DNA-binding/unbinding with 3min 6000rpm followed by 60sec full speed
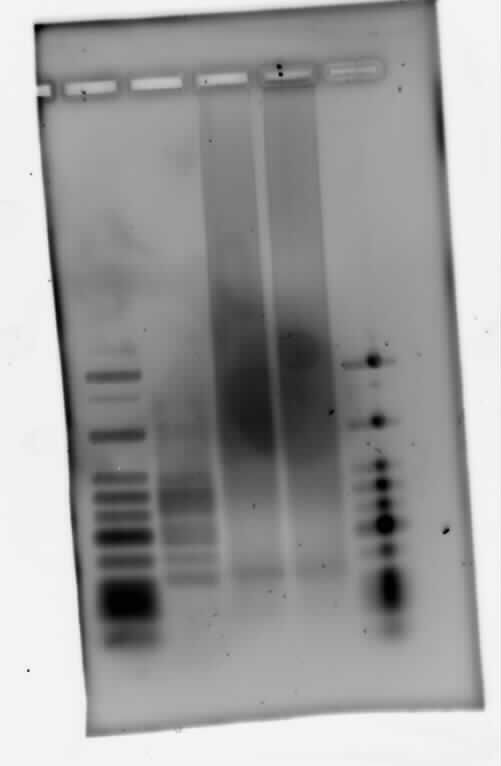
2% Agarose Gel
09.04.2010
Philipp & Flo
Gel of PCR products from 08.04.2010
- loaded: 10 uL sample+2 uL 6x GLD, 4/2 uL LMW standard
- 110 V, 90min
- stained with Sybrgold, 20min, 1:10.000 dilution in TAE
- Standard - Control - R0011_His - R0011_Trp - Standard(=low molecular weight (see Protocols#Lab_Protocols))
Close
Week02
in vivo constructs
15.04.2010
Philipp & Flo
[http://web.e14.physik.tu-muenchen.de/igem/index.php/Protocols#PCR PCR] of B0014 and R0011
16.04.2010
Philipp & Flo
- Concentrations measured with nanodrop:
| B0014
| 2.5 ng/uL
|
R0011
| 27.5 ng/uL
|
--> worked for R0011, not for B0014
- PCR of B0014
- Purification with the Zymo Kit, Elution in 20 uL H2O
- Concentration measured with nanodrop, 17.5 ng/uL --> worked
template
| restriction enzymes (biobrick assembly)
|
B0014 (from Christoph, verified PCR products, 21 ng/uL)
| EcoRI, PstI
|
R0011 (from PCR [15042010], 27.5 ng/uL
| SpeI
|
HisSig (1:100 dilution)
| XbaI
|
TrpSig (1:100 dilution)
| XbaI
|
| psB1K3 (with RFP insert, from HiWiPhilipp, 81 ng/uL)
| EcoRI, PstI
|
5 uL template used for each setup. protocol followed
- Gel for purification of the cleaved plasmid
- 2% Agarose in 1x TAE
- 120 V, 90 min
- stained with SybrGold
- digestion, digestion, 1 kb ladder
- Digestion worked (partly). band at 2000 bp (backbone) cut

- Purification of DNA from Gel
- Ligation of HisSig/TrpSig with R0011in 2 reactions
| used Volume
| approx. concentration*
|
HisSig
| 6 uL
| 7 ng/uL
|
TrpSig
| 6 uL
| 5 ng/uL
|
R0011
| 3 uL
| 6 ng/uL
|
* approximated from the amount used in the digestion before
Close
Week03
in vivo constructs
19.04.2010
- PCR of R0011-TrpSig and R0011-HisSig
- Purification with the Zymo Kit, Elution in 30 uL H2O
- Concentration measured with nanodrop: c(R0011-TrpSig)=20 ng/µL, c(R0011-HisSig)=12.5 ng/µl --> worked
- Gel for analysis of ligation and PCR
- 2% Agarose in 1x TAE
- 110 V, 90 min
- stained with SybrGold 1:10000 20 min
- pure R0011 PCR product used as control
LMW
| 4 µl
|
R0011-TrpSig
| 5 µL
|
R0011-HisSig
| 5 µL
|
R0011
| 5 µL
|
Samples seem to have run further than the buffer/dye-Front! But: Ligation Products show bands at shorter lengths than R0011 alone --> Ligation didn't work ?!?
- Ligation of HisSig/TrpSig with R0011in 2 reactions
| used Volume
| concentration
|
pSB1K3
| 5 uL
| 10 ng/µL (nanodrop)
|
B0014
| 3 uL
| 5 ng/µL approx.*
|
* approximated from the amount used in the digestion before
20.04.2010
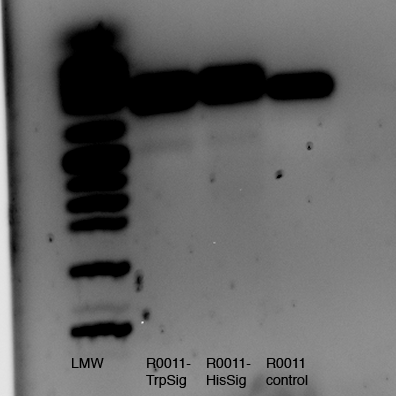
- Gel for analysis of ligation and PCR (repeat of yesterday's gel)
- 2% Agarose in 1x TAE
- 130 V, 75 min
- stained with SybrGold 1:10000 60 min
- pure R0011 PCR product used as control
- Excision and purification of marked bands at 200bp using QIA Kit, elution in 30 µl H2O
- PCR of excised and purified bands of R0011-TrpSig and R0011-HisSig
- complete samples (30 µl) used as templates
- Purification with the Zymo Kit, Elution in 30 uL H2O
- Concentrations of PCR-products: 0.5-1 ng/µl --> Gel excision or PCR didn't work
- Transformation (Woehlke-Lab)
- 8 µl of ligation product pSB1K3-B0014 to 50 µl XL-10 competent cells
- 200 µl plated on a Kanamycin-containing Plate
- remaining 800 µl stored @4°C in S1-lab
21.04.2010
- Gel for analysis of ligation and PCR (repeat of yesterday's gel)
- 2% Agarose in 1x TAE
- 110 V, 90 min
- stained with SybrGold 1:10000 80 min
- pure R0011 PCR product used as control
- Excision and purification of marked bands at 200bp using Zymo 5 Kit, elution in 20 µl H2O
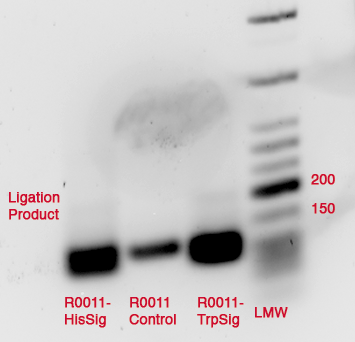
- PCR of excised and purified bands of R0011-TrpSig and R0011-HisSig
- complete samples (20 µl) used as templates
- Purification with the Zymo Kit, Elution in 25 uL H2O
- Concentrations of PCR-products:
- R0011-TrpSig: 22.5 ng/µl
- R0011-HisSig: 9.5 ng/µl
--> worked!!!!!
- Colony PCR
- 7Colonies picked and resuspended in 20 µl LB+Kana (each)
- PCR of 2 µl of each sample, 2 µl as negative control (Program: ColonyPCR, modified)
- 15 µl of each sample mixed with 3 µl GLPn and loaded to Gel
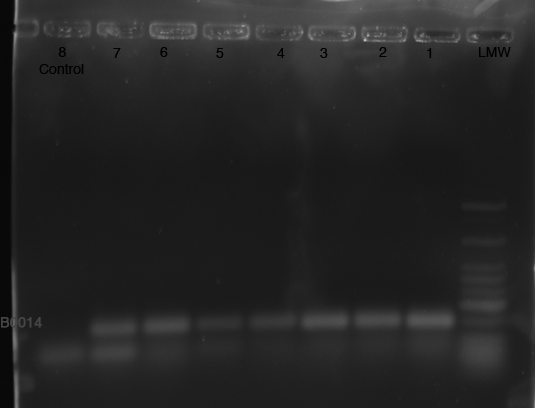
- Overnight cultures:
- remaining 18 µl of samples 1, 3, 6, and 7 added to 5 ml LB + kanamycin
- 37°C on Shaker
22.04.2010
- Gel for purification of PCR products R0011-TrpSig and R0011-HisSig (yesterday's result)
- 2% Agarose in 1x TAE
- 110 V, 90 min
- stained with SybrGold 1:10000 30 min
- pure R0011 PCR product used as control
- Excision and purification of marked bands at 200bp using Zymo 5 Kit, elution in 20 µl H2O

- Miniprep
- Result: about 4 µg Plasmid
23.04.2010
template
| template volume
| restriction enzymes
| Buffer
|
HisSig (1:100 dilution)
| 5 µl
| EcoRI, SpeI
| NEB4
|
TrpSig (1:100 dilution)
| 5 µl
| EcoRI, SpeI
| NEB4
|
| psB1K3-B0014 from Miniprep (No 7, 35 ng/µl)
| 5 µl
| EcoRI, XbaI
| NEB4
|
Incubated 90 min @ 37°C
- Gel for purification of the cleaved plasmid
- 2% Agarose in 1x TAE (leftover from yesterday)
- 140 V, 90 min
- stained with SybrGold 40 min
- 4 µl 1 kb ladder, 10 µl purified digestion + 2 µl GLPn, 10 µl purified digestion + 2 µl GLPn
- Digestion worked (partly). band at 2400 bp cut out

- Purification of DNA from Gel
- A260/A230 and A260/A280 values were strange (see labbook)
Close
Week04
in vivo constructs
26.04.2010
- Digestion of pSB1K3-B0014 with EcorI and XbaI
- 10 µl template (No1, 50 ng/µl)
- 5 µl BSA, 5 µl Buffer NEB#4
- 1 µl EcoRI, 1 µl XbaI
- 28 µl H2O
- 1.5 h @ 37°C
- Purification with Zymo5 Kit, elution in 20 µl H2O
- Ligation of Signals and PSB1K3-B0014
- 3 µl of each sample, end volume 20 µl
- Preparation of Measurement Plasmid from Folder, Transformation
- Plate 1022, Spots 1E, 1G, 2A: pSB1A10 with different Inserts, all inserts are Zinc-finger constructs with about 1,6 kb
- Transformation of XL10 with Ligation Products (8 µl each) and pSB1A10 (2 µl each)
- Preparation of Measurement Plasmid from Folder, Transformation
- Plate 1022, Spots 1E, 1G, 2A: pSB1A10 with different Inserts, all inserts are Zinc-finger constructs with about 1,6 kb
- growing over night cultures of remaining PSB1K3-B0014-transformed cells
27.04.2010
- Plenty of cultures on both HisSig and TrpSig Ligation plates, but nothing on pSB1A10 plates! --> repeat DNA extraction, ask Prof. Simmel for new Distribution
- Colony PCR
- 7Colonies picked and resuspended in 20 µl LB+Kana (each)
- PCR of 2 µl of each sample, 2 µl as negative control (Program: ColonyPCR, modified)
- 10 µl of each sample mixed with 2 µl GLPn and loaded to Gel

Many colonies with pSB1K3-B0014, not one with pSB1K3-Sig-B0014
- Miniprep of PSB1K3-B0014
- Samples I and II: 5 ml overnight cultures, centrifuged 10 min @ 3200 g, resuspended in 600 µl of the same culture
- Samples III and IV: 600 µl overnight cultures
- all samples mixed with 100 µl lysis buffer, Miniprep with Zyppy kit, each sample eluted in 50 µl H2O
- Concentration measured (Nanodrop, LP=1mm, Factor 10, 4 µl sample)
- cI=61.5 ng/µl
- cII=33.5 ng/µl
- cIII=103 ng/µl
- cIV=108 ng/µl
--> Better results for 600 µl cultures without centrifuging!!!
- Preparation of Measurement Plasmid from Folder, Transformation
- Plate 1022, Spots 1E, 1F, 1G, 1H, 2A: pSB1A10 with different Inserts, all inserts are Zinc-finger constructs with about 1,6 kb
28.04.2010
- No colonies on plates from Yesterday's transformations, but on the older plates (from monday) some colonies appeared
- 7 Colonies picked and resuspended in 20 µl LB0 (each)
- 1&2 from plate "1E", 3&4 from plate "1G", 5,6&7 from plate "2A", 8 LB0
- Colony PCR
- PCR of 2 µl of each sample, 2 µl as negative control (Program: ColonyPCR, modified)
- 15 µl of each sample mixed with 3 µl GLPn and loaded to Gel
- 1% Agarose in 1xTAE, 95 V, after 50 minutes changed to 110 V

- Digestion of pSB1K3-B0014 with EcorI and XbaI
- 10 µl template (No1, 50 ng/µl)
- 5 µl BSA, 5 µl Buffer NEB#4
- 1 µl EcoRI, 1 µl XbaI
- 28 µl H2O
- 1.5 h @ 37°C
- heat inactivation 5min @60°C
- Dephosphorylation of restricted vector
- Purification with Zymo5 Kit, elution in 20 µl H2O
- loaded on gel (with 4 µl GLPn) (Gel shown above)
- Gel excision with Zymo Kit
29.04.2010
- Digestion of pSB1K3-B0014 with EcorI and XbaI
- 10 µl template (NoIV, 108 ng/µl)
- 5 µl BSA, 5 µl Buffer NEB#4
- 1 µl EcoRI, 1 µl XbaI
- 28 µl H2O
- 1.5 h @ 37°C
- heat inactivation 5min @60°C
- Dephosphorylation of restricted vector
- Purification with Zymo5 Kit, elution in 20 µl H2O
- loaded on gel (with 4 µl GLPn)
File:X
- Gel excision with Zymo Kit
- Digestion of R0011 with SpeI
- 10 µl template (R0011, X ng/µl)
- 5 µl BSA, 5 µl Buffer NEB#4
- 1 µl SpeI
- 29 µl H2O
- 1.5 h @ 37°C
- Ligation
- 5 µl R0011 (S-digested) with 12 µl TrpSig or HisSig, respectively (X-digested)
- complete ligation (20 µl) loaded on Gel (with 4 µl GLPn)

- Gel excision with Zymo Kit, eluted in 42 µl H2O
- Transformation
- 50 µl XL-10 transformed with 2 µl of pSB1A10 prepared from IGem 2009 Distribution (13 µl left in pink Box @-20°C)
-
30.04.2010
PCR R0011-HisSig and R0011-TrpSig --> 13 ng/µl x 20 µl
Close
Week05
in vivo constructs
04.05.2010
- Digestion of pSB1K3-B0014 with EcorI and XbaI
- 10 µl template (NoIII, 103 ng/µl)
- 5 µl BSA, 5 µl Buffer NEB#4
- 1 µl EcoRI, 1 µl XbaI
- 28 µl H2O
- 1.5 h @ 37°C
- Purification with Zymo5 Kit, elution in 15 µl H2O
- loaded on gel (with 3 µl GLPn)

- Gel excision with Zymo Kit
- Digestion of R0011-HisSig and R0011-TrpSig with EcorI and SpeI
- 10 µl template (PCR-product)
- 5 µl BSA, 5 µl Buffer NEB#4
- 1 µl EcoRI, 1 µl SpeI
- 28 µl H2O
- 1.5 h @ 37°C
- Purification with Zymo5 Kit, elution in 20 µl H2O
- Ligation
- 4 µl R0011-Signal (E/S-digested) with 4 µl pSB1K3-B0014 (E/X-digested)
- 15 min @ RT, 20 min heat inactivation @ 65°C
- Overrnight liquid cultures of pSB1A10-RFP made from
--> each in 600 µl LB+Carbenicillin (=Ampicillin) @37°C
05.05.2010
- Miniprep of pSB1A10; 4 samples (1, 2; 3a; 3b)
- eluted in 50 µl H2O each
- Concentrations:
- c1=37,5 ng/µl
- c2=56,5 ng/µl
- c3a=46,5 ng/µl
- c3b=30 ng/µl
- Digestion of pSB1A10 with EcorI and PstI, 4 samples (1, 2; 3a; 3b)
- 15 µl template
- 5 µl BSA, 5 µl Buffer NEB#3
- 1 µl EcoRI, 1 µl PstI
- 23 µl H2O
- 1.5 h @ 37°C
- heat inactivation 5min @60°C
- Purification with Zymo5 Kit, elution in 15 µl H2O
- loaded on gel (with 3 µl GLPn)

Insert @ 1 kb as expected, but vector @ 2kb and not @ 5kb as expected!!!!
--> Wrong Plasmid! Comparison to the [http://partsregistry.org/cgi/assembly/plate_egel.cgi?id=615 Gel in the registry] shows: The Distribution contains the wrong plasmid!
- Digestion of HisTerm and TrpTerm with EcorI and PstI
- 5 µl template
- 5 µl BSA, 5 µl Buffer NEB#3
- 1 µl EcoRI, 1 µl PstI
- 33 µl H2O
- 1.5 h @ 37°C
- Clones picked: 7 from each Plate (pSB1K3-R0011-TrpSig-Boo14 and pSB1K3-R0011-HisSig-Boo14)
- Colony PCR
- PCR of 2 µl of each sample, 2 µl as negative control (Program: ColonyPCR)
- 15 µl of each sample mixed with 3 µl GLPn and loaded to Gel
- 2% Agarose in 1xTAE, 130 V, 90 min

06.05.2010
- Digestion of pSB1K3 with EcorI and XbaI
- 20 µl template (sample III, 103 ng/µl)
- 5 µl BSA, 5 µl Buffer NEB#3
- 1 µl EcoRI, 1 µl XbaI
- 18 µl H2O
- 1.5 h @ 37°C
- heat inactivation 5min @60°C
- loaded on gel (with 10 µl GLPn) in 4 lanes

- Gel excision with Zymo Kit (lanes 1&2) and with Qiaquick Kit (lanes 3&4)
- c1=4.5 ng/µl
- c2=3.5 ng/µl
- c3=2 ng/µl
- c1=7 ng/µl
- A260/A230 and A260/A280 values were strange (see labbook)
- Ligation
- 4 µl R0011-Signal (E/S-digested) with 10 µl pSB1K3-B0014 (E/X-digested, from 23.04.)
- 15 min @ RT, 20 min heat inactivation @ 65°C
07.05.2010
- Clones picked: 7 from each Plate (pSB1K3-R0011-TrpSig-Boo14 and pSB1K3-R0011-HisSig-Boo14)
8=======o
---Too damn stupid to do a PCR!!!---
8=======o
- replated picked clones on new plates, incubated at RT
Close
Week06
in vivo constructs
10.05.2010
- Colony PCR of picked clones from Fr 07.05.2010
- PCR of 2 µl of each sample, 2 µl as negative control (Program: ColonyPCR, modified)
- 15 µl of each sample mixed with 3 µl GLPn and loaded to Gel
- 2% Agarose in 1xTAE, 120 V, 110 min
- stained in SybrSafe 50 min

Interpretation:
Colonies contain an Insert with Prefix and Suffix, length is 200 bp. This is too short for the desired R0011-Signal-B0014 (245 or 247 bp) construct, but longer than B0014 (136 bp) which was the Insert in the digested vector.
Possible explanation: Ligation worked, but not with R0011-Signal-construct but with R0011 or Signal. Which?
| fragment
| length without Prefix/Suffix
| length with Prefix/Suffix
|
| R0011
| 55 bp
| 96 bp
|
| B0014
| 95 bp
| 136 bp
|
| TrpSig/HisSig
| 34 bp/32 bp
| 75 bp/73 bp
|
| TrpSig-B0014/HisSig-B0014
| 135 bp/ 133 bp
| 176 bp/ 174 bp
|
| R0011-TrpSig-B0014/R0011-HisSig-B0014
| 206 bp/ 204 bp
| 247 bp/ 245 bp
|
| R0011-B0014
| 156 bp
| 197 bp
|
| R0011-TrpSig/R0011-HisSig
| 95 bp/93 bp
| 136 bp/134 bp
|
Prefix: 20 bp; Suffix: 21 bp; X-S-scar: 6 bp
--> it looks as if R0011 is ligated to B0014, which makes the whole construct wothless. The R0011-HisSig control looks more like R0011 alone as well.
11.05.2010
- Ligation
- 4 µl Signal (E/S-digested; from ) with 5 µl pSB1K3-B0014 (E/X-digested; from)
- 15 min @ RT
12.05.2010
- Colony PCR of picked clones from Tu 12.05.2010
- PCR of 2 µl of each sample, 2 µl as negative control (Program: ColonyPCR, modified)
- 15 µl of each sample mixed with 3 µl GLPn and loaded to Gel
- 2% Agarose in 1xTAE, 120 V, 110 min
- stained in SybrSafe 60 min
File:TUM2010 100512beschriftet.png
| fragment
| length without Prefix/Suffix
| length with Prefix/Suffix
| length after PCR
|
| R0011
| 55 bp
| 96 bp
| 104 bp
|
| B0014
| 95 bp
| 136 bp
| 154 bp
|
| TrpSig/HisSig
| 34 bp/32 bp
| 75 bp/73 bp
| 93 bp/91 bp
|
| TrpSig-B0014/HisSig-B0014
| 135 bp/ 133 bp
| 176 bp/ 174 bp
| 194 bp/ 192 bp
|
R0011-TrpSig-B0014/
R0011-HisSig-B0014
| 206 bp/ 204 bp
| 247 bp/ 245 bp
| 265 bp/ 263 bp
|
| R0011-B0014
| 156 bp
| 197 bp
| 215 bp
|
| R0011-TrpSig/R0011-HisSig
| 95 bp/93 bp
| 136 bp/134 bp
| 154 bp/152 bp
|
Prefix: 20 bp/29 bp after PCR; Suffix: 21 bp/30 bp after PCR; X-S-scar: 6 bp
14.05.2010
- Digestion of pSB1K3 with EcorI and XbaI
- 10 µl template (sample III, 103 ng/µl)
- 2 µl BSA, 2 µl Buffer NEB#4
- 1 µl EcoRI, 1 µl XbaI
- 4 µl H2O
- 1 h @ 37°C
- loaded on gel (with 4 µl GLPn) in 1 lane
File:TUM2010 100514beschriftet.png
- Gel excision with Zymo Kit
- Digestion of HisSig and TrpSig with EcorI and SpeI
- 10 µl template ("1:100")
- 2 µl BSA, 2 µl Buffer NEB#3
- 1 µl EcoRI, 1 µl SpeI
- 4 µl H2O
- 1.5 h @ 37°C
- Purification with Zymo 5
- or heat inactivated (20 min @ 80°C)
- Transformation
- 50 µl XL-10 transformed with 10 µl of Ligation mix
- 50 µl untransformed cells plated on Kana-plate as control
Close
Week07
in vivo constructs
17.05.2010
- Plates from Friday:
- plenty colonies on control plate --> XL10 cells are impure!
- use DH5α from now on!!!!!
- Transformation
- 50 µl DH5α transformed with 10 µl of Friday's Ligation mix
- plated on Kana-Plates; Overnight @ 37°C
- DNA Isolation from BioBrick Distribution 2010
- 10 µl H2O added to Well 1A of plate 1 containing pSB1A10 with RFP-insert
- 2 µl used for Transformation of 50 µl DH5α-cells
- plated on Carbenicillin (=Amp-analogon)-plates, Overnight @ 37°C
18.05.2010
- Colony PCR of picked clones
- PCR of 2 µl of each sample, 2 µl as negative control (Program: ColonyPCR)
- 10 µl of each sample mixed with 10 µl Formamide loading buffer and loaded to Polyacrylamide Gel
Samples:
LMW|R0011|HisSig|TrpSig|HisSig E/S-Dig|TrpSig E/S-Dig|B0014|LMW2|Colony PCR His1|His2|Trp1|Trp2|control|HisTerm|TrpTerm|HisTerm E/P-Dig|TrpTerm E/P-Dig
- 5 µl of each samples mixed with 5 µl formamide loading dye and loaded to gel(except Ladder and colonyPCR)
- LMW: 3 µl LMW (Korbinian) + 3 µl Formamide loading Dye
- LMW2: 5 µl LMW Quickload (with GLP) + 10 µl Formamide loading Dye
- stained in SybrSafe
Important Mistake! See below Gel!

IMPORTANT MISTAKE: DENATURING GELS NOT USEFUL FOR dsDNA!!!
REPEAT WITH NATIVE GEL, IGNORE INTERPRETATION!!!
(*R0011 and B0014 look normal
- ColonyPCR: bands that look like B0014 in all clones (and in control???? strange!) --> Religation?
- Signals at the wrong size: should be about 75 bp, look like 200 bp!!!
- terminators completely strange: should be around 100 bp!
--> are all of our sequences just wrong???
What are we going to do? Order everything new?)
19.05.2010
- Gel from Korbinian
- 5 µl of each samples mixed with 5 µl formamide loading dye and loaded to gel(except Ladder and colonyPCR)
- LMW: 3 µl LMW (Korbinian) + 3 µl Formamide loading Dye
- colonyPCR: from Tuesday, 8 µl sample with 8 µl Formamide loading Dye
- stained in SybrSafe 20 min

- Colony PCR
- 4 colonies picked from each Plate (Ligations from yesterday; Signal-B0014)
- 15 µl of each Sample mixed with 3 µl GLPn and loaded to Gel:
- 3% Agarose in 1x TBE, 130 V
File:TUM2010 100519beschriftet.png600px
20.05.2010
- Digestion
- template
- 2 µl BSA
- 2 µl Buffer
- 1 µl of each enzyme
- water to reach 20 µl
Template
| Enzymes
| NEB Buffer #
|
HisTerm & TrpTerm (10 µl)
| EcoRI, PstI
| 3
|
HisSig & TrpSig (10 µl)
| EcoRI, SpeI
| 4
|
B0014 (5 µl)
| XbaI, PstI
| 3
|
pSB1A10_RFP (14 µl)
| EcoRI, PstI
| 3
|
pSB1K3_RFP (14 µl)
| EcoRI, PstI
| 3
|
pSB1K3_B0014 N° 4 (14 µl)
| EcoRI, XbaI
| 4
|
- incubated @37°C for 1.5 h
- digested inserts heat inactivated (20 min @ 80°C)
- digested plasmids loaded on gel (with 4 µl GLPn) in 1 lane
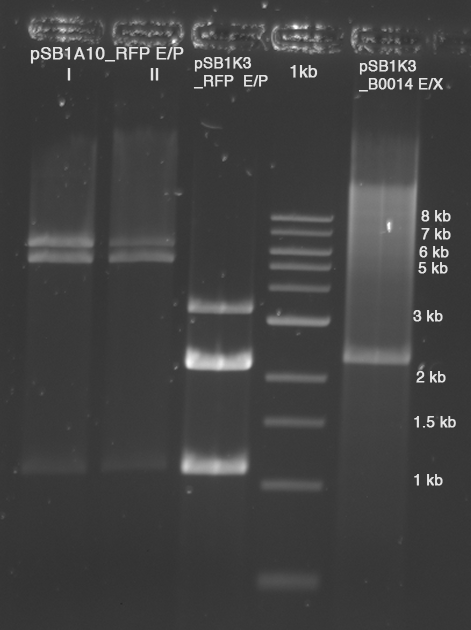
- Gel excision with Zymo Kit
- c(pSB1A10, I)=4.5 ng/µl
- c(pSB1A10, II)=1.5 ng/µl ?!?!?!
- c(pSB1K3 E/P)=7 ng/µl
- c(pSB1K3_B0014 E/X)=2.5 ng/µl
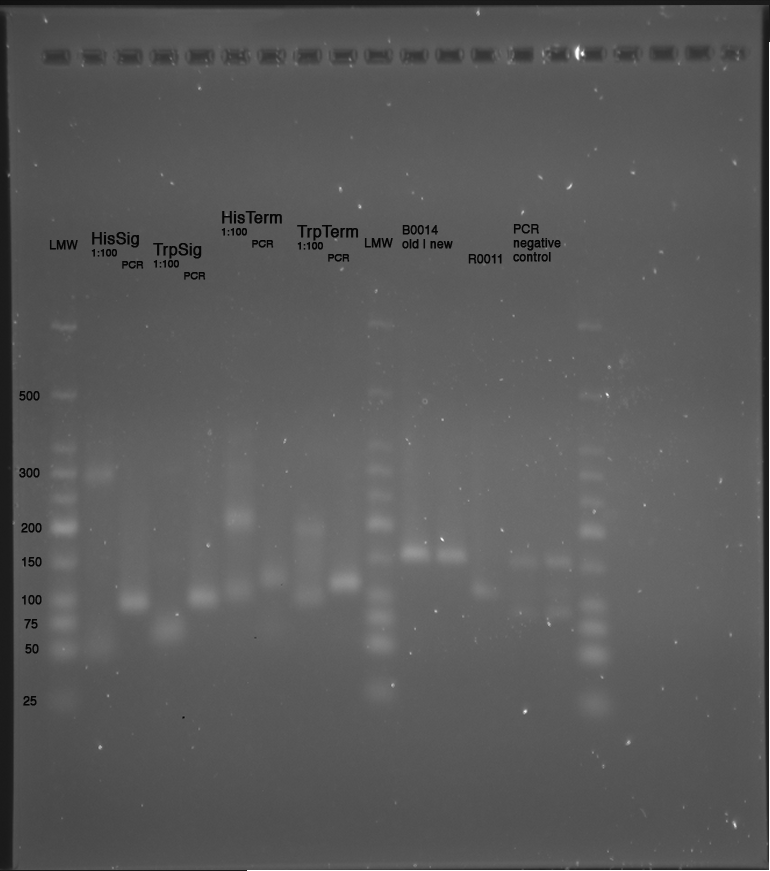
- Gel of PCR products
- 3% Agarose in 1x TBE; 2h @130 V
- Ligation
- templates
- 2 µl T4-buffer 10x
- 1 µl T4-Ligase
- Water to reach 20 µl
Vector
| Insert
|
psB1A10 (E/P; sample I) (10 µl)
| TrpTerm (E/P) (4 µl)
|
psB1A10 (E/P; sample I) (10 µl)
| HisTerm (E/P) (4 µl)
|
psB1K3_B0014 (E/X) (12 µl)
| HisSig (E/S) (2 µl)
|
psB1K3_B0014 (E/X) (12 µl)
| TrpSig (E/S) (2 µl)
|
psB1K3 (E/P) (8 µl)
| HisSig (E/S)(2 µl) + B0014 (X/P)(1.5 µl)
|
psB1K3 (E/P) (8 µl)
| TrpSig (E/S)(2 µl) + B0014 (X/P)(1.5 µl)
|
- Transformation
- 50 µl DH5a transformed with 10 µl of Ligation mix
- 50 µl DH5a transformed with 2 µl of pSB1K3_B0014
- 50 µl DH5a transformed with 2 µl of pSB1K3_RFP
- 50 µl DH5a transformed with 2 µl of pSB1A10_RFP
21.05.2010
- Colony PCR
- 4 colonies picked from each Plate (pSB1K3_HisSig_B0014, pSB1K3_TrpSig_B0014, pSB1K3_HisSig_B0014 double ligation, pSB1K3_TrpSig_B0014 double ligation)
- each clone resuspended in 20 µl LB0, 3 µl used as template for PCR
- 15 µl of each Sample mixed with 3 µl GLPn and loaded to Gel:
- 3% Agarose in 1x TBE, 130 V
-

Close
Week08
in vivo constructs
25.05.2010
- Colony PCR
- 4 colonies picked from each Plate
- pSB1K3_HisSig_B0014
- pSB1K3_TrpSig_B0014
- pSB1K3_HisSig_B0014 double ligation
- pSB1K3_TrpSig_B0014 double ligation
- pSB1A10_TrpTerm
- pSB1A10_HisTerm
- each clone resuspended in 20 µl LB0, 2 µl used as template for PCR
- 15 µl of each Sample mixed with 3 µl GLPn and loaded to Gel:
- 3% Agarose in 1x TBE, 220 V (double Gel, 35 cm)
- stained in SybrSafe


- overnight cultures made of
- HisSig 3, DL1, DL4
- TrpSig DL2, DL4
- HisTerm/TrpTerm 1,2,3
26.05.2010
- Miniprep of cultures set up 25.05.2010
- HisSig 3, DL1, DL4
- TrpSig DL2, DL4
- HisTerm/TrpTerm 1,2,3
- Restriction
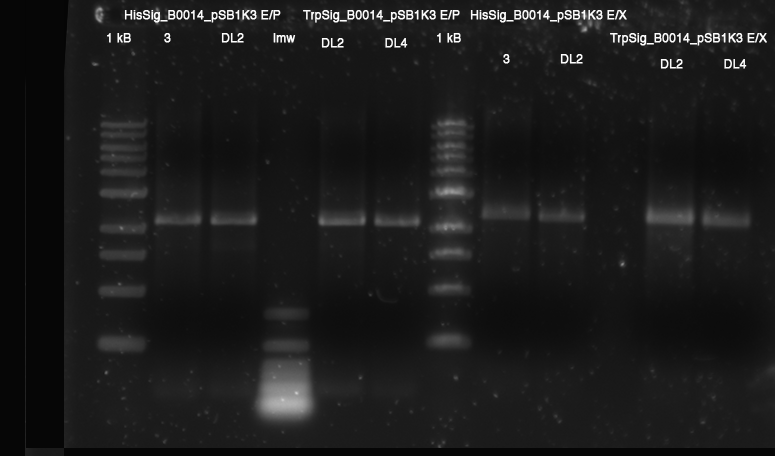
- analytical: E/P HisSig(3, DL2); TrpSig(DL2, DL4): 1.5 h 37 °C
- prep: E/X HisSig(3, DL2); TrpSig(DL2, DL4): 1.5 h 37 °C
- prep: E/S R0011: 1.5 h 37 °C, inactivation 20 min @ 80 °C
- total volume each 20 u, 10 uL template
- Gel: 1% Agarose, TAE - 1,5 h 110 V
- Ligation:
- HisSig_3 (E/X) with R0011 (E/S)
- HisSig_DL2 (E/X) with R0011 (E/S)
- TrpSig_DL2 (E/X) with R0011 (E/S)
- TrpSig_DL4 (E/X) with R0011 (E/S)
- batches
- total volume 20 uL
- 2 uL R0011 (E/S)
- 2 uL T4 buffer
- 1 uL T4 Ligase
- 15 uL vector
- PCR
- His and TrpSig
- His and TrpTerm
- R0011
- B0014
- 50 uL total volume
- 1 uL template
- 1 ul G1004
- 1 uLG1005
- 0.2 uL Taq
- 5 uL Taq standard buffer
- rest water
27.05.2010
- Colony PCR
- 3 colonies picked from each Plate
- pSB1K3_R0011_HisSig_B0014 (N° 3 from yesterday)
- pSB1K3_R0011_HisSig_B0014 (N° DL1 from yesterday)
- pSB1K3_R0011_TrpSig_B0014 (N° DL2 from yesterday)
- pSB1K3_R0011_TrpSig_B0014 (N° DL4 from yesterday)
- "N6"
- "N15"
- each clone resuspended in 20 µl LB0, 2 µl used as template for PCR
- 15 µl of each Sample mixed with 3 µl GLPn and loaded to Gel:
- 3% Agarose in 1x TBE, 220 V (double Gel, 35 cm)
- stained in SybrSafe
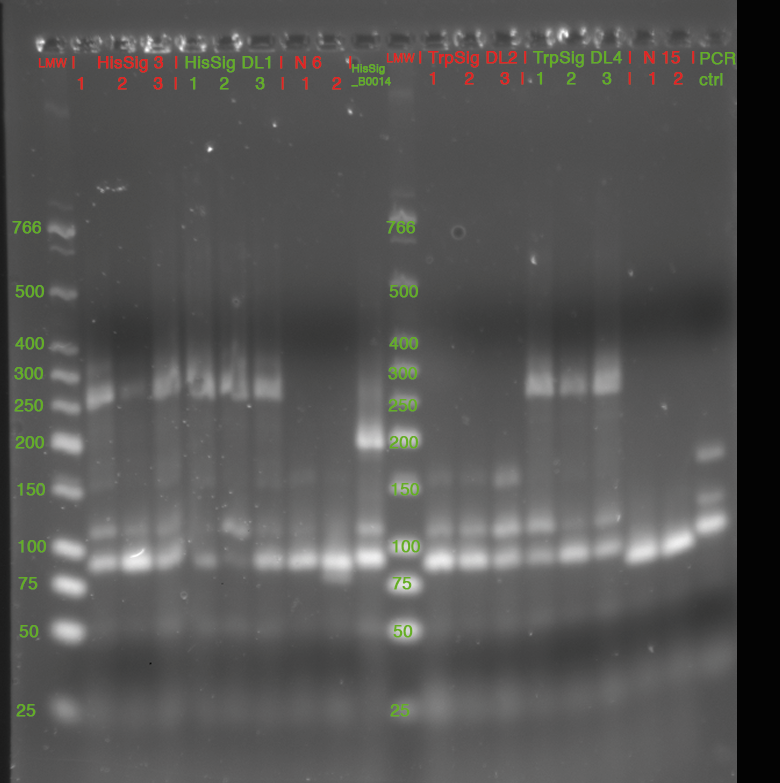
| fragment
| length without Prefix/Suffix
| length after PCR
|
| R0011
| 55 bp
| 104 bp
|
| B0014
| 95 bp
| 154 bp
|
| TrpSig/HisSig
| 34 bp/32 bp
| 93 bp/91 bp
|
| TrpSig-B0014/HisSig-B0014
| 135 bp/ 133 bp
| 194 bp/ 192 bp
|
R0011-TrpSig-B0014/
R0011-HisSig-B0014
| 206 bp/ 204 bp
| 265 bp/ 263 bp
|
|
|
|
|
| I712074 ("N6")
| 46 bp
| 105 bp
|
| I719005 ("N15")
| 23 bp
| 82 bp
|
Prefix: 29 bp after PCR; Suffix: 30 bp after PCR; X-S-scar: 6 bp
- overnight cultures made of
- HisSig 3_1, DL1_3
- TrpSig DL4_1, DL4_3
- N15 1&2
- HisTerm/TrpTerm (picked colonies from yesterdays plates #2 each)
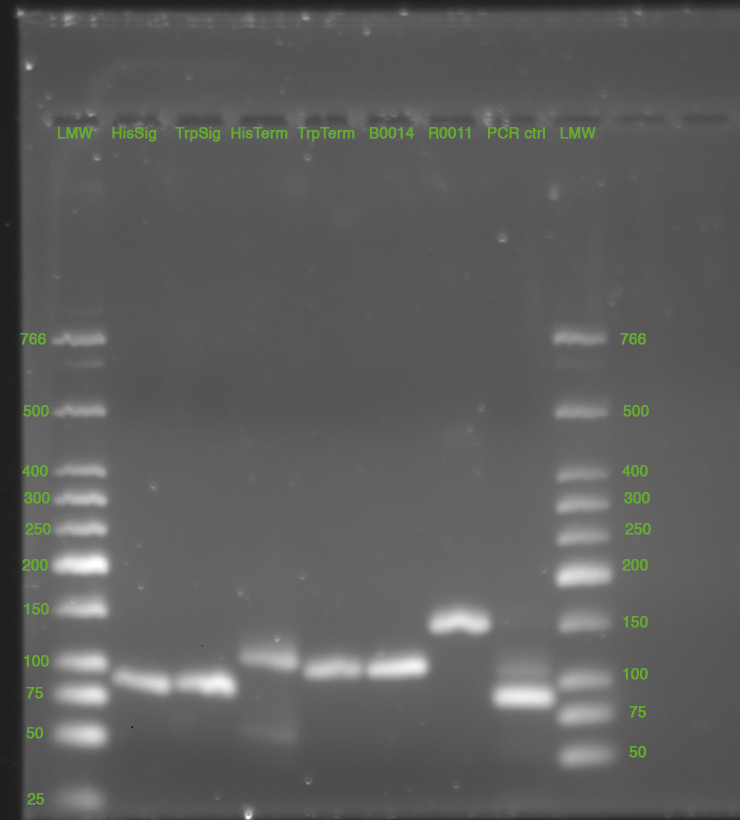
- Purification of yesterday's PCR
- elution in 50 µl H2O
- c(HisSig)=5.5 ng/µl
- c(TrpSig)=10 ng/µl
- c(HisTerm)=6.5 ng/µl
- c(TrpTerm)=6.5 ng/µl
- c(R0011)=13 ng/µl
- c(B0014)=12.5 ng/µl
- 5 µl loaded on gel with 1 µl GLPn; 3% Agarose in 1x TBE, 220 V (double Gel, 35 cm)
28.05.2010
- Miniprep of cultures from 27.05.2010, Elution in 50 uL nuclease free water
- (1)HisSig 3_1
- (2)HisSig DL1_3
- (3)TrpSig DL4_1
- (4)TrpSig DL4_3
- (7)HisTerm#1
- (8)HisTerm#2 (7 ml culture)
- (9)TrpTerm#1
- (10)TrpTerm#2 (7ml culture)
- (5)N15-1 (=BBa_I719005)
- (6)N15-2 (=BBa_I719005)
sample
| DNA concentration (ng/uL)
|
HisSig 3_1
| 6
|
HisSig DL1_3
| 11
|
TrpSig DL4_1
| 16
|
TrpSig DL4_3
| 21.5
|
HisTerm#1
| 27
|
HisTerm#2
| 66
|
TrpTerm#1
| 34
|
TrpTerm#2
| 29.5
|
N15-1 (=BBa_I719005)
| 19.5
|
N15-2 (=BBa_I719005)
| 18.5
|
- analytical digest (E/P)
- of all samples. total volume 20 uL, 5 uL template used for Term-constructs, 10 uL teplate for all others
- Agarose Gel
- 3% broad range agarose in TBE. Run in TBE, 140 V, 1.50 h
- stained with SybrGold, 45 min
- signals look fine
- terminators also (without pre/suffix 97/104 bp)
- T7 promoter without pre/suffix has a length of 23 bp + cut pre/szffix ca at 60 bp -->buffer?

Close
Week09
in vivo constructs
31.05.2010
- Digestions
- 15N-1 (BBa_I719005, 19.5 ng/uL) with S/P
- HisSig/TrpSig (6.5/10 ng/uL) with X/P
- 2 h 37 °C
- heat inactivation of insert-digestions
- Gel: 1% Agarose in 1x TAE
- 1 h 25 min, 115 V
- stained with SybrGold, 40 min

- Band at ~2100b cut und purified using the zymo kit
- ligation
- HisSig (4 uL of digest) with purified plasmid (with BBa_I719005)
- TrpSig (2 uL of digest) with purified plasmid -=-
- reason: concentration of His Sig before digest was 1/2 of TrpSig
- of DH5a with Ligation batches, HisSig1-3, HisSig3-1, TrpSig DL4-1, TrpSig 4-3
01.06.2010
- of Ligations transformed into DH5a yesterday
- 4 Colonies of each Ligation
- Gel: 3% broad range Agarose in 1xTBE
- 1.5 h 140 V
- stained with SybrGold

- calculation for the expected size of the fragments
| part
| size (bp)
|
| HisSig
| 32
|
| TrpSig
| 34
|
| T7 promoter
| 23
|
| prefix
| 20
|
| suffix
| 21
|
| X/S scar
| 6
|
- in PCR we get additional bp due to the primers - +9 at pre/suffix=+18 bp
- overall size of the fragments expected to come out of the PCR: T7_HisSig: 120 bp, T7_TrpSig: 122 bp
- 5 ml cultures of pSB1K3_R0011_HisSig_B0014 (1_3 & 3_1) and pSB1K3_R0011_TrpSig_B0014 (DL4_1 & DL4_3)
- 1 ml cultures of each colony monitored in Colony PCR
02.06.2010
- Miniprep of yesterdays cultures using Zymokit, elution by nuclease-free water
- Concentration determination
- analytic digestion
- results on gel:
JobNr. Barcode Last change Date/Time Last message / Files 6549287 AE2739 02.06.2010 / 13:51:12 HisSig 1-3-forward G1004
We just received your order. Many thanks.
6549288 AE2738 02.06.2010 / 13:51:12 HisSig 3-1-forward G1004
We just received your order. Many thanks.
6549289 AE2737 02.06.2010 / 13:51:12 TrpSig DL4-1-forward G1004
We just received your order. Many thanks.
6549290 AE2736 02.06.2010 / 13:51:12 TrpSig DL4-3-forward G1004
We just received your order. Many thanks.
6549291 AE2735 02.06.2010 / 13:51:12 HisTerm-forward G1004
We just received your order. Many thanks.
6549292 AE2734 02.06.2010 / 13:51:12 TrpTerm-forward G1004
We just received your order. Many thanks.
- Gel 3% broad range agarose in 1x TBE
-

Close
Week10
in vivo constructs
07.06.2010
- Sequenbcing results from GATC
- HisSig DL1-3 is ok
- HisSig 3-1 is ok
- TrpSig DL4-1 is ok
- TrpSig DL4-3 is ok
- TrpTerm + HisTerm bad runs... --> new sequencing order with Primer 100 bp upstream (within GFP)
- Files can be found stored in our GATC account
- Sequencing@GATC: both Term-constructs with primer pGFP-FP provided by GATC
- Restrictions
- psB1A10_TrpTerm/HisTerm with Nsi1, Aat2
- pSB1K3_R0011_HisSig/TrpSig_B0014 with Pst1, Aat2
- T7 bb with Spe1, Pst1
- PCRProducts: HisSig/TrpSig with Pst1, Xba1, 2 h @37°C
- all plasmid digests done sequential as enzymes do not have 100% activity in the same buffer, each reaction 1.5 h@37°C
- psB1A10_TrpTerm/HisTerm and T7 bb dephosphorylated the last 30 min
liquid culture (10 ml) of pSB1K3_R0011_HisSig/TrpSig_B0014
08.06.2010
- Sequencing results from GATC: His/TrpTerm with pGFP-FP primer
- HisTerm worked
- TrpTerm worked
- checked with blast2seq
- 8 colonies from each plate of T7His, T7Trp, MonsterHis, MonsterTrp as ligations resulted in many colonies
- for all colony PCR reactions


Interpretation/Info: The R0011_Sig_B0014 construct was cut with PstI, but not ligated into a PstI site but instead into the NsiI site --> even if sticky end are compatible, the bases in the 3` direction are different --> primer lags 7 bp compared to standard procedure --> we didn´t expect to find the signal construct by colony PCR --> control digestion tomorrow
- T7-Signal constructs seem to have worked, expected size was 23 bp (T7)+ 32 (HisSig)/34 (TrpSig) bp + 30+29 (PCRPre+Suf)=114/116 bp
09.06.2010
- Miniprep of 4 Monster_His, 4 Monster_Trp, 3 T7_His and 3 T7_Trp cultures
- Analytical digestion of plasmids mentioned above
- gel of Monster_Plasmid digestion
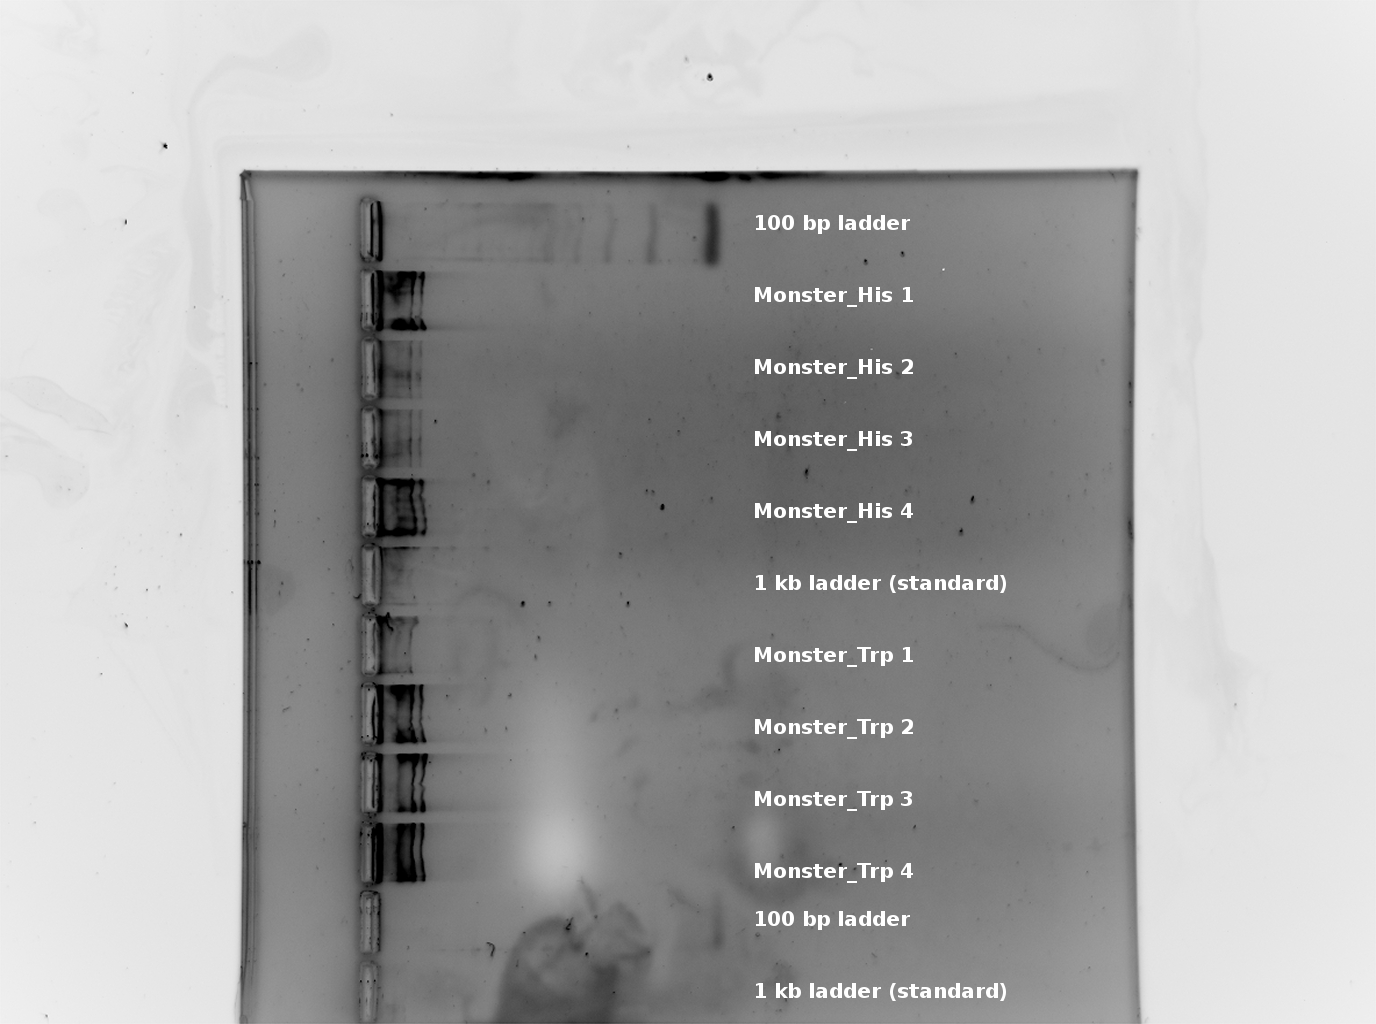
gel didn´t work at all --> even after > 2h, bands were not separated correctly, even the 1kb ladder was "stacked" in the gel-pockets, the 100 bp ladder should show EQUAL distances between the lines [http://www.neb.com/nebecomm/productfiles/778/images/N3231_fig1_v1_000034.gif see here], it looks like the gel was "more dense" at the pockets---> no idea what happened --> repeat Monster-digestion tomorrow?
- gel of T7_Plasmid digestion
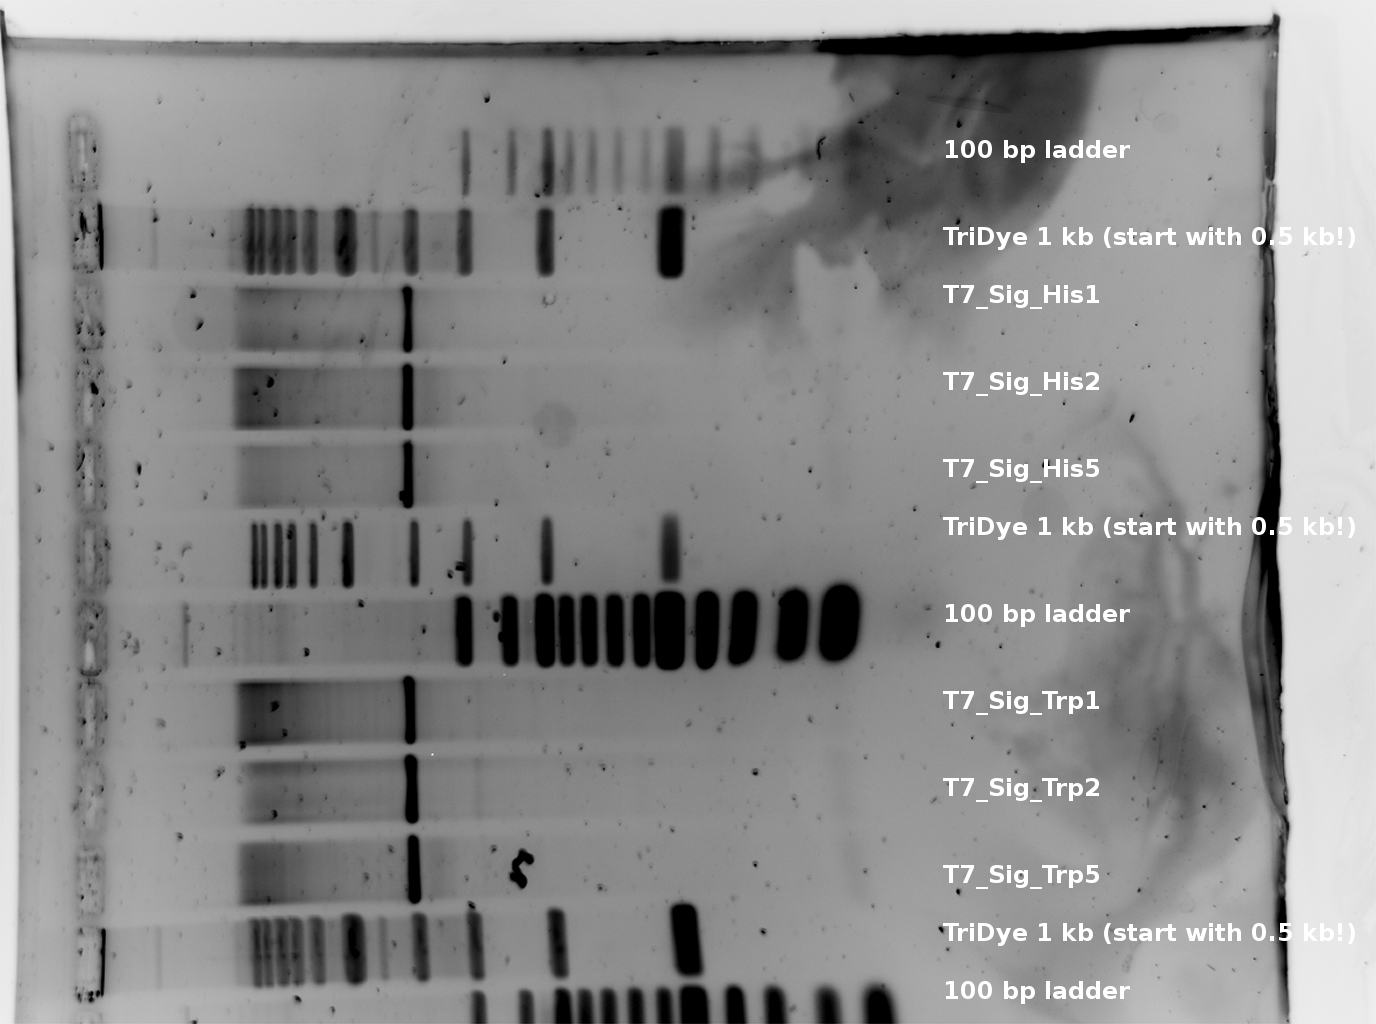
T7_Trp E + S digestion 107 bp and T7_His 105 bp --> worked for all picked colonies. (regard that there is an excess of plasmid DNA-basepairs of factor >30 --> thats why the inserts are much weaker than the plasmid signals.
occured trouble:
- Ladders and loading dye´s empty --> i used those of eike, BUT: eikes 1 kb ladder is different --> compare [http://www.neb.com/nebecomm/products/productN3272.asp here] and his loading dye was much more diluted, even if there was also 6x Sac GLP written on it -> i hope this won´t cause any trouble
10.06.2010
- Promega E.coli S30 in vitro transcription/translation kit
- Spe1, Aat2 from NEB, 500 U each
- of Ligation colonies from MonsterHis/trp 1-3 and T7His/Trp 1,2,5/1,2,3
- 2h digestion
- Monster: 6 uL DNA template with Aat2/Spe1 in Buffer 4/Bsa
- T7-Signal: 6 uL DNA template with E/P in Buffer 3
- used standards: lmw, 2-log click here
- Gel1: 1% Agarose in 1xTBE for Digestions of Monsterplasmid
- run in big chamber @ 200 V for 1 h 20 min

- Gel2: 3% Agarose (broad range) in 1xTBE for Digestions of T7-Signal
- run in small chamber @140 V for 1 h 35 min

- Conclusions:
- all T7-Signal ligations loaded on the gel worked
- monsterplasmid didn't work? bands at 800 bp, 900 bp, 1.3 kbp, 2.2 kbp, 3 kbp, we SHOULD expect to see our Insert, wich is Prefix+R0011_Signal_B0014_small Suffix, which should run around 300-400 bp...
11.06.2010
- Gel: large 1% Agarose in TAE. Load: The rest of N/A cut Messplasmids from 07.06.2010. Run @220 V for 3.5 h
- fragments expected are 5087 and 176. original size of plasmid is 5263. This is a Try to differ between 5087 and 5263 bp

- Band @ 5000 bp of Trp_Term purified, obviously digestion was 100%. Bad point is that HisTerm includes an Nsi1 cleavage site...
Close
Week11
in vivo constructs Promega Kit
14.06.2010
- 10 uL pSB1A10_TrpTerm Aat2/Nsi1 0.5 ng/uL
- 1 uL R0011_TrpSig_B0014 Aat2/Psb1 11 ng/uL
- 2 uL T4 ligase buffer
- 1 uL T4 Ligase
- 6 uL H2O
- 10 min RT
- Transformation of DH5a with
- Ligation
- T7His#1
- T7Trp#1
- pSB1K3_R0011_TrpSig_B0014
- pSB1K3_R0011_HisSig_B0014
- pSB1A10_TrpTerm
- pSB1A10_HisTerm
15.06.2010
- Over night cultures
- Aliquots of the Promega in vitro expressions kit from e. coli s30 extract:
- 40 uL with aa mix including all aa.
16.06.2010
Fluoresence measurements using in vitro kit
- in vitro kit sample
- adding psBA1A10 Trp_Term --> constant over time, no significant changes compared to kit alone --> high efficiency of AraC
- adding L-(+)Arabinose (final concentration 2%) --> after approx. 10 min significant GFP production --> measuring for xxx min --> RFP is slightly increased (to proof if correlated to GFP peak --> crossdetection)
- adding psB1K3 R0011_TrpSig_B0014
Cell culture
5 ml culture for
- psBA1A10 Trp_Term/HisTerm
- psB1K3 R0011_TrpSig/Hissig_B0014
17.06.2010
Cloning
Digestion of Trp-Sig with E/P and psB1A10 Trp_Term with E/P
- Gel purification of psB1A10 Trp_Term E/P cut
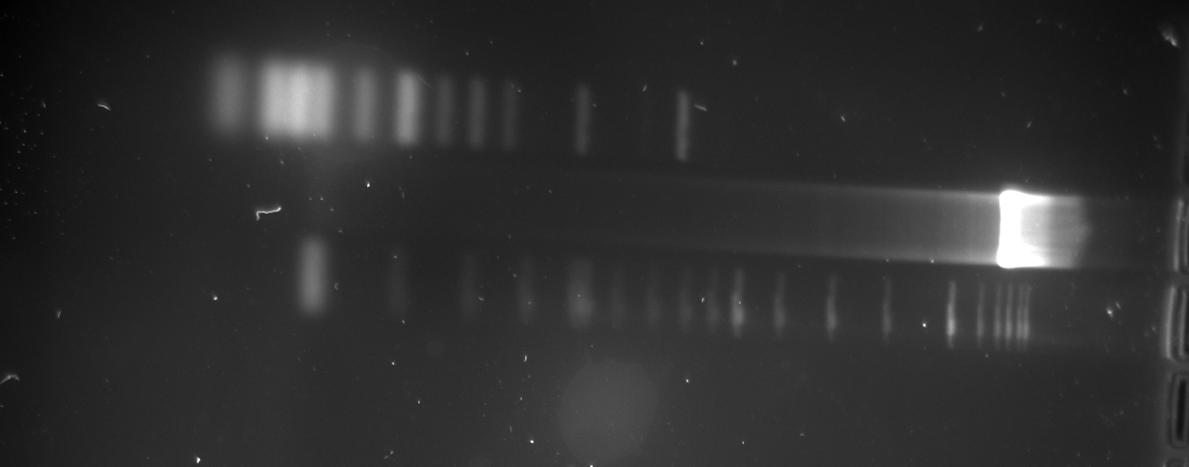
- Heat inactivation of Trp-Sig E/P cut
- Ligation for 10 min @ RT and Transformation in DH5-a cells
18.06.2010
cloning
- Transformation (about 20 colonies) --> picking 5 colonies
- colony PCR
- Gel
2 % broad range agarose, 1 h 120 V 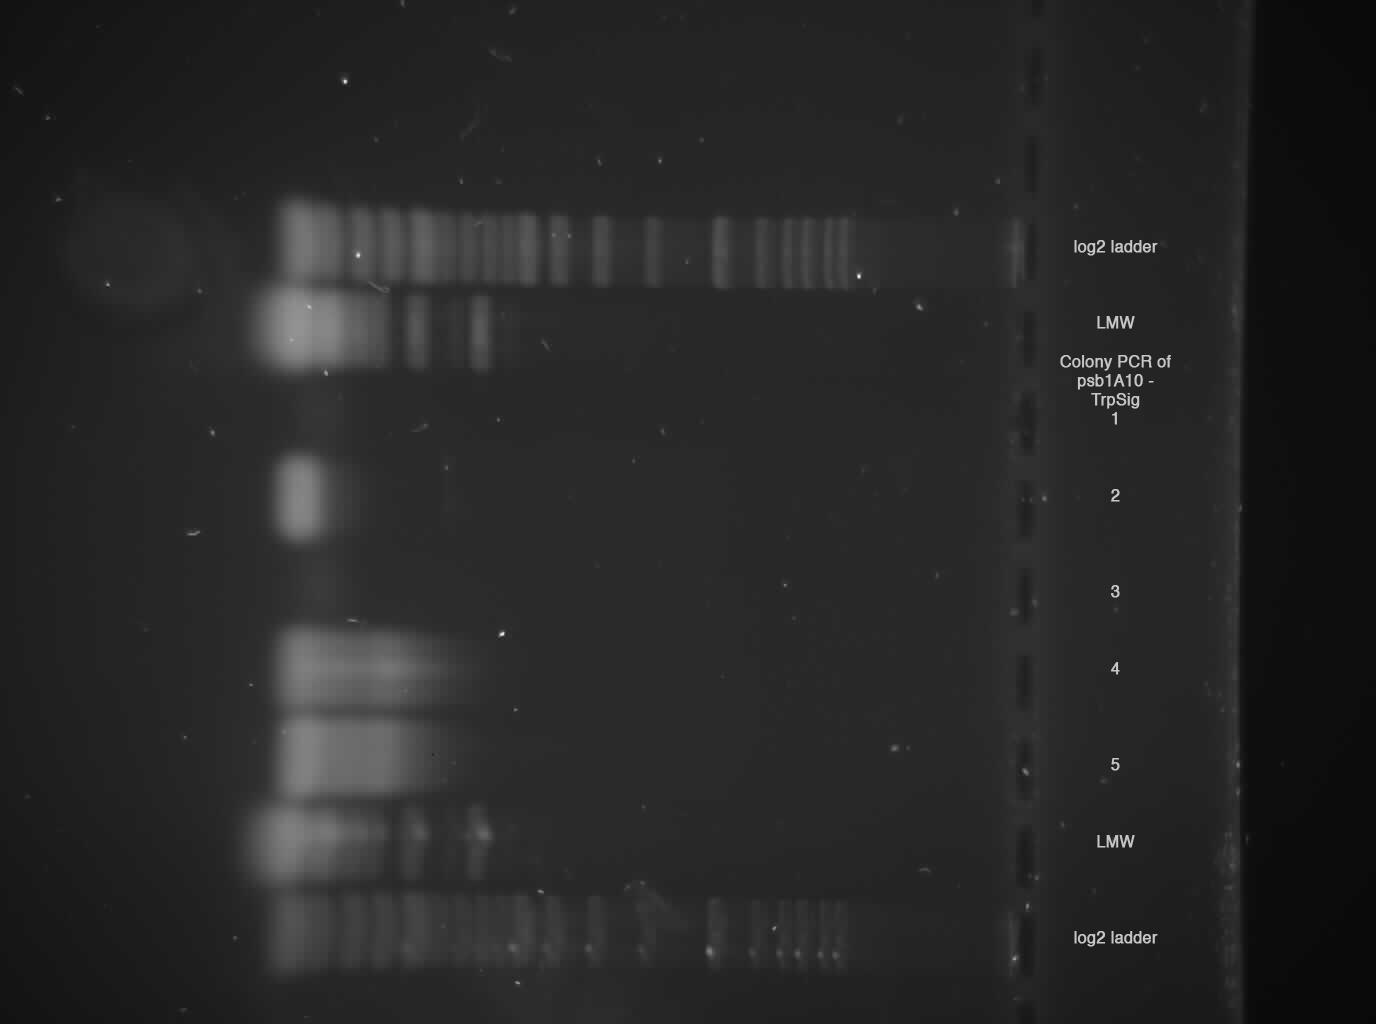 Sample 2, 4, 5 shows probably Trp-Signal + Pre/Suffix --> send sample 2 for sequencing!
- control digestion of all 10 picked psB1A10-TrpSig in 1% broad range agarose, > 3 h, 120 V
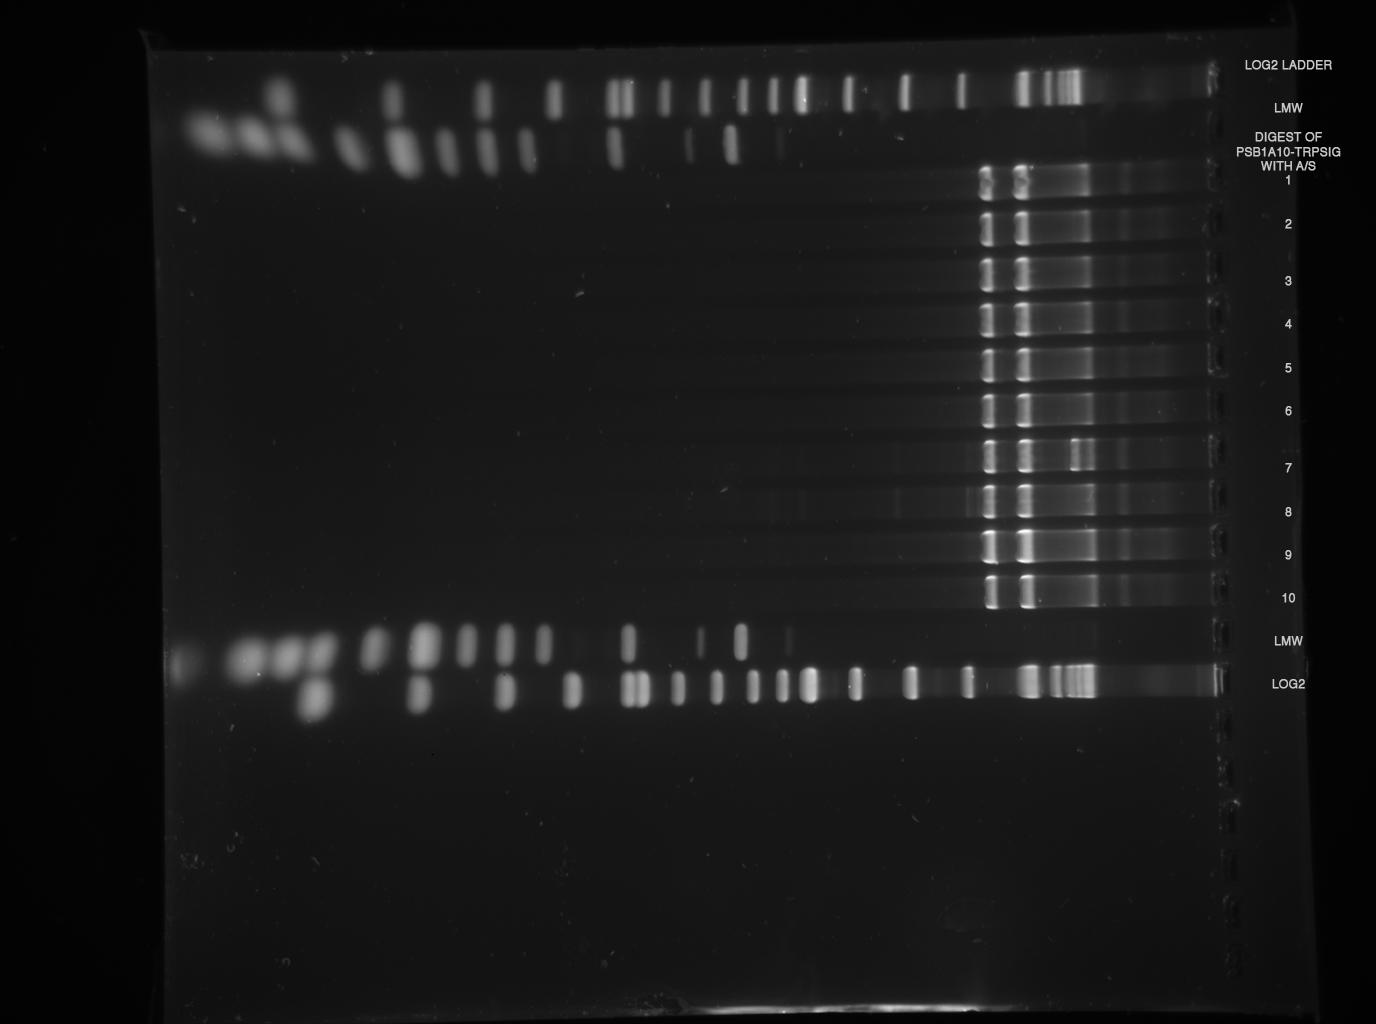 --> digestions worked, but again, no insert can be found, despite gel was at maximum resolution ( 3h 120 V, see LMW)
in vitro measurements
f$%&&§ s%§$! Again, nothing worked! Although we saw an increasing "GFP signal" comparable to 16.06.10, taking spectra suggested we DON'T see significant GFP-production! We used new water for preparing the samples, cleaned cuvettes with "new water", used other DNA-samples etc. Somehow, it seems as if we don't express GFP (we compared Christoph's results! We should see a really significant spectrum!
Next steps:
- Try in vivo measurements, just using psb1A10_xTerm without Signal (thus just measuring plasmid) to proof if kit or measuring plasmid causes this problem!
Close
Week12
in vivo constructs First steps Promega Kit
22.06.2010
Transformation
- psb1A10_HisTerm/TrpTerm into BL21 (DE3) RIL
- psb1A10_Monster-Trp No. 7, 8, 10 (Positiv control) into DH5-a
Liquid culture
- psb1A10_TrpSig (Positiv control) No. 2
23.06.2010
- pSBN1A10_TrpSig - 40 uL, 12.5 ng/uL -->very low amount of DNA...
- culture is slightly red? -> strange because there cannot be any rfp-insert with constitutive promoter as the construct was built up from pSB1A10_TrpTerm (digested) and TrpSignal (PCR product)
- with MonsterTrp, #7,8,10 (Carbamp)
- 50 ml cultures of BL21 (DE3) RIL
- pSB1A10_HisTerm
- pSB1A10_TrpTerm
0.2%
24.06.2010
- MonsterTrp #7,8,10
- positive Control
- concentrations are too low for sequencing --> again we have to set uop 5 ml cultures for tomorrow
25.06.2010
Plasmid purification and sequencing
- Monster_Trp 7, 8, 10 and psB1A1ß_TrpSig plasmids are isolated (concentrations up to 110 ng/ul) and sent for sequencing
- psB1A1ß_TrpSig liquid culture was completely pink! still not clear what happend (wrong labeling of digested psB1A10_Trpterm?) --> wait for sequencing details
Fluorescence Measurements
- Induction by putting Arabinose directly into cuvettes with cells IS NOT WORKING at all! Expression of GFP increases, but marginally. probably, despite stirring, oxygen is lacking?
- Induction on shaker work perfectly --> both Trp and His showed strong GFP-signals, BUT: Probably, too high OD results in not exciting all GFP within the sample (incident beam is already scatterd enormously on the edge of the cuvette --> only small volume is excited correctly). For instance, a sample showing OD of 0.7 shows a signal of 30 a.u., diluted to OD 0.35 signal falls only to 19 a.u.! Thus dilution did not result in a linear decrease of flourescence! a.u. !!! We diluted down to OD 0.1; the result: OD´s smaller than 0.4 show linear change of fluorescence signal --> using OD´s up to 0.4 results in meaningful measurements!!!
Close
Week13
Cloning Measurements Measurements Measurements
28.06.2010
- psB1A10_TrpSig (Positivkontrol worked: Trp-Sig is inside, directly in front of RFP (without the promotor of the measurement plasmid insert [http://partsregistry.org/Part:BBa_J04450 BBa_J04450], so it seems like everything worked. Furthermore, i performed a promotor prediction with the following tool [http://linux1.softberry.com/berry.phtml?topic=bprom&group=programs&subgroup=gfindb bacteria promotor prediction tool] to proof if our Trp-Sig in combination with the flanking regions is not forming a promotor,by mischance. According to this, there are two promotors, BUT:
one in and after the suffix (so it should be in each of our constructs), but the tools says theres is no known sigma-factor for this promotor! the second one is within the RFP and there is a sigma-factor for this one ( rpoD16). So i don´t see a explanation, why our colonies were pink in contrast to the other "Messplasmids".
None of the Monsterplasmids contains the signal construct. Probably, the problem is there is no selection methods which allowed us to distinguish uncut plasmids.... --> we should discuss at our next meeting, one possiblity would be connecting our construct to a resistance marker. I summed up all sequences in this document: File:25.06.-sequenzierung.doc
- Induction in cuvette and measuring fluorescence at the same time IS NOT WORKING! (probably cells are not growing and expressing very well, maybe lacking oxygen despite stirring. Bleaching is more unlikely)
In vivo, measuring plasmid (at least GFP) works! we optimized the paramters for fluorescence measurment! We tried different OD´s and found out that only measurments below OD 0.4 result in meaningful measurements.
as a result, in vitro expression did somehow not work, reasons are unclear, maybe too low DNA-concentrations.
positvie control psB1A10_TrpSig was pink again, we have to wait the results from GATC
29.06.2010
Close
Week14
in vivo constructs Invitrogen Kit
01.07.2010
- using Invitrogen kit
- measuring kinetics for 3 h @ 37°C
- 40 uL + 5 uL pSB1A10_TrpSig (126 ng/uL) + 0.5 uL 100x L-Arabinose (=0.2%) + 4.5 uL H2O
- observations: gfp signal grows, after 30 min it crashes. rfp grows
- emission spectra for gfp and rfp result in no spectrum
- looks strange, a problem might be evaporation of liquid and hence scattering of light which produces artefacts
- pSB1A10_TrpSig (DH5a), 5 ml for miniprep
- pSB1A10 XS (DH5a), 5 ml for miniprep
02.07.2010
- pSB1A10_XS: 30 uL 10 ng/uL
- pSB1A10_TrpSig: 30 uL 10 ng/uL
- BL21 with pSB1A10_XS (positive control without insert and no without any bio brick site left)
Close
Week15
Testing psB1A10
05.07.2010
- 250 ml of DH5a pSB1A10_XS
- 20 ml BL21 pSB1A10_XS
- in vitro transcription measurement planned
- check In_vitro_Measurements
06.07.2010
- BL21 psB1A10_XS - positive control (to check the measurement plasmid...)
- GFP, RFP Fluorescence
- induced with 0.2% arabinose in (1), uninduced (2)
- at OD 0.15: GFP/RFP emissions spectra /100706/spectra/gfp10 and rfp10
- 2.5 h kinetic measurement GFP/RFP /100706/kinetics/
- OD 0.7 (1) and 0.64 (2) after 2.5 h --> GFP/RFP emissions spectra /100706/spectra/gfp11,rfp11,gfp21,rfp21
- in addition for 4 h a culture at OD 0.8 induced (with 0.2% Arab), spectra taken afterwards at 1:15 dilution (OD 0.39) gpf_ku and rfp_ku
- observation: measurement plasmid is totale verarsche. RFP is not expressed at all, or this protein is not rfp. whatever.
Close
Week16
The Era of Exams
No Lab work this week, everybody is busy studying for their exams...
Close
Week17
The Era of Exams
No Lab work this week, everybody is busy studying for their exams...
Close
Week18
The Era of Exams
No Lab work this week, everybody is busy studying for their exams...
Close
Week19
The Era of Exams
No Lab work this week, everybody is busy studying for their exams...
Close
Week20
Construction of new Measurement Plasmid
09.08.2010
- overnight cultures inoculated from Glycerolstock J06702(mCherry generator) in pSB1A2 from Christoph.
10.08.2010
- MiniPrep of pSB1A2-mCherry using ZymoKit
- Digestion
- pSB1A2-mCherry E/P
- pSB1A2-mCherry X/P
- pSB1A10-HisTerm S/P
- pSB1A10-TrpTerm S/P
- pSB1A10-HisTerm E/P
- Purified with agarose gel (1%)
- Gel Doc broken => no picture
- Description: mCherry cut was ok, Plasmid was cut at least once (linear DNA), generally contaminated with genomic DNA
- Ligation
- 50ng Plasmid and 34ng Insert
- ca. 30min @ RT
- Transformation of DH5a cells with ligation samples
(=> no colonies the next day)
- overnight cultures
- pSB1A2-mCherry from Christoph`s stock
- pSB1A10-HisTerm from earlier plate
- pSB1A10-TrpTerm from earlier plate
(=> pSB1A10-TrpTerm and pSB1A10-HisTerm did not grow until next day)
11.08.2010
- MiniPrep of pSB1A2-mCherry using ZymoKit
- analytic gel of Mini preps and ligation of the previous day
- preps still hold genomic DNA
- mCherry Plasmid runs at ca. 2400bp
- Digestion
- pSB1A2-mCherry E/P
- pSB1A2-mCherry X/P
- Purified with agarose gel (1%)
- Gel Doc broken => no picture
- Description: mCherry cut was ok, stil contaminated with genomic DNA
- Ligation
- Plasmid (from previous day) and mCherry-Insert
- ca. 30min @ RT
- Transformation of DH5a cells with
- ligation samples (=> no colonies the next day)
- pSB1A10-HisTerm
- pSB1A10-TrpTerm
- overnight cultures
- pSB1A2-mCherry from Christoph`s stock
12.08.2010
- MiniPrep of pSB1A2-mCherry using ZymoKit
- analytic gel of Mini preps and ligation of the previous day
- preps still hold genomic DNA
- mCherry Plasmid runs at ca. 2400bp
- Gel (1%)
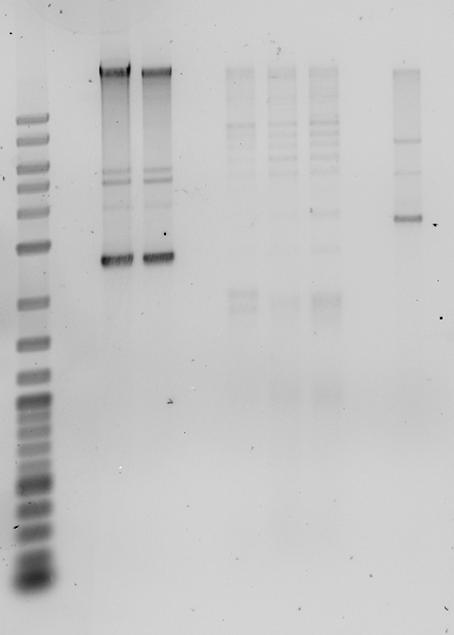
- Digestion
- pSB1A2-mCherry X/P
- pSB1A10-HisTerm S/P
- pSB1A10-TrpTerm S/P
- Purified with agarose gel (1%)
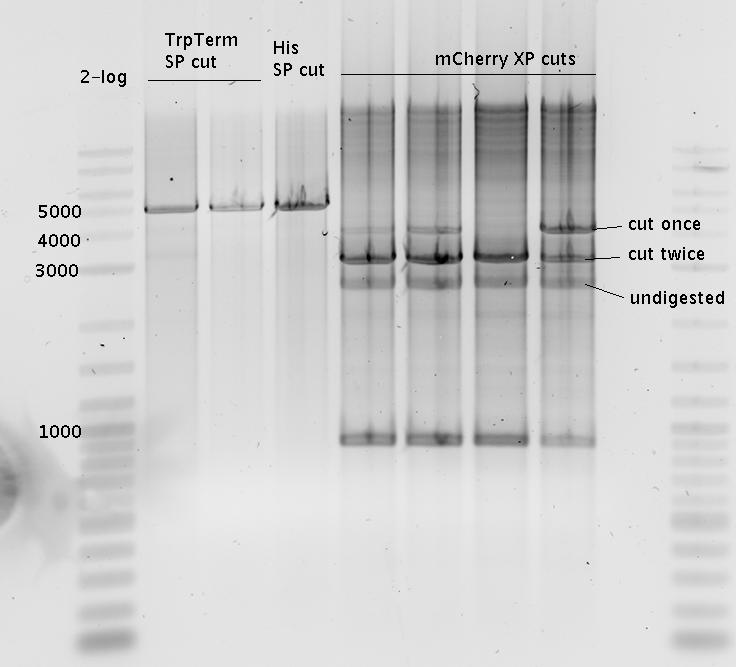
- Ligation
- Plasmid and mCherry-Insert
- ca. 30min @ RT
- Transformation of DH5a cells with
- ligation samples (=> no colonies the next day)
- pSB1A10-HisTerm
- pSB1A10-TrpTerm
- overnight cultures
- pSB1A2-mCherry from Christoph`s stock
- pSB1A10-HisTerm
- pSB1A10-TrpTerm
Caution: ran out of gas => not steril?
13.08.2010
- MiniPrep using ZymoKit
- pSB1A2-mCherry
- pSB1A10-HisTerm
- pSB1A10-TrpTerm
- analytic gel of Mini preps and ligation of the previous day
- low concentration
- Gel (1%)
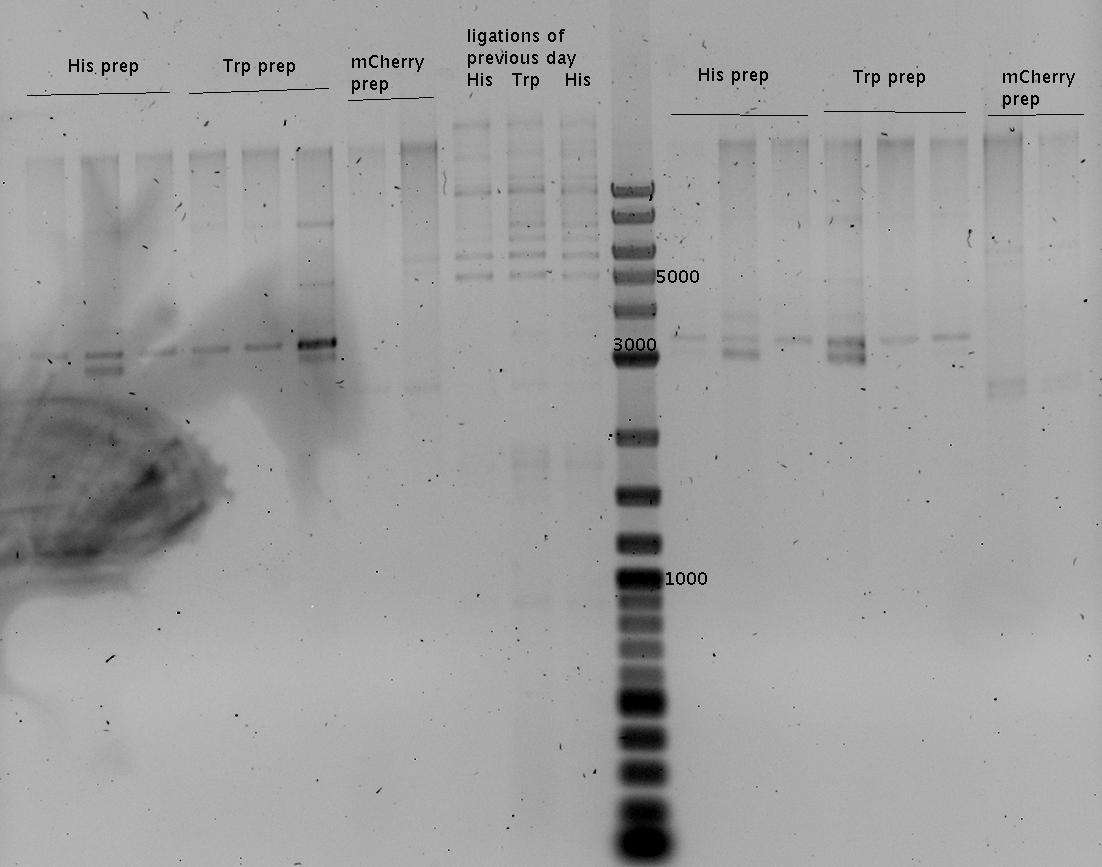
Close
Week21
Construction of new Measurement Plasmid
16.08.2010
- Concentrating MiniPrep-Samples using ZymoKit
- pSB1A2-mCherry
- pSB1A10-HisTerm
- pSB1A10-TrpTerm
- Digestion
- pSB1A2-mCherry E/P
- pSB1A2-mCherry X/P
- Purified with agarose gel (1%)
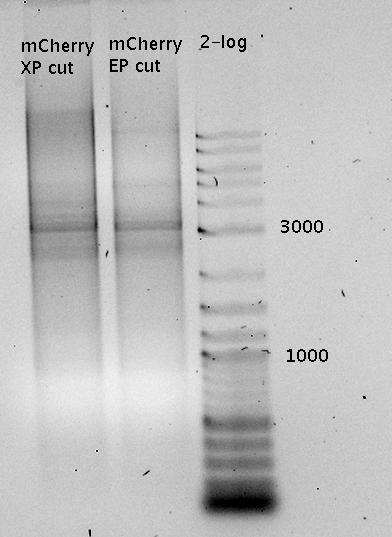 => no mCherry band!!!
- Purification using Zymo Concentrator Kit
- pSB1A10-HisTerm S/P
- pSB1A10-TrpTerm S/P
- Ligation
- Plasmid (from earlier date) and mCherry-Insert (from 11.08)
- ca. 30min @ RT
- used new ligase and new ligase buffer
- Transformation of DH5a cells with
- ligation samples (=> colonies found the next day)
- pSB1A10-HisTerm
- pSB1A10-TrpTerm
- pSB1A10-RFP (BioBrick Standard)
- overnight cultures
- pSB1A2-mCherry from Christoph`s stock
- pSB1A10-HisTerm
- pSB1A10-TrpTerm
17.08.2010
- MiniPrep using ZymoKit
- pSB1A2-mCherry
- pSB1A10-HisTerm
- pSB1A10-TrpTerm
- Digestion
- pSB1A2-mCherry X/P
- pSB1A10-HisTerm S/P
- pSB1A10-TrpTerm S/P
- => heating block went up to 50°C
- Purified "digestion" samples with ZymoKit => stored for next day
- Picked 12 colonies from previous day's ligation
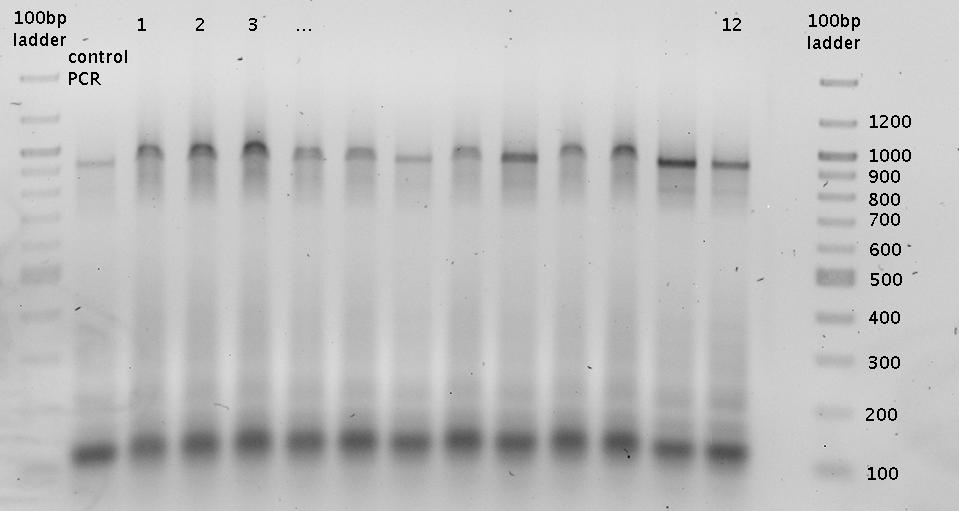
- => Colony PCR => Gel (2%)
- Purified with agarose gel (1%)
- Gel Doc broken => no picture
- Description: mCherry cut was ok, stil contaminated with genomic DNA
- Ligation
- Plasmid (from previous day) and mCherry-Insert
- ca. 30min @ RT
- Transformation of DH5a cells with
- ligation samples (=> no colonies the next day)
- pSB1A10-HisTerm
- pSB1A10-TrpTerm
- overnight cultures
- pSB1A10-RFP (plate from previous day)
- pSB1A2-mCherry
- pSB1A10-HisTerm
- pSB1A10-TrpTerm
PROBLEM:
mCherry has a SgrA1-cleavage site! These constructs cannot be used. Starting all over, cloning the linker sequence first...
18.08.2010
- MiniPrep using ZymoKit
- pSB1A2-mCherry
- pSB1A10-HisTerm
- pSB1A10-TrpTerm
- pSB1A10-RFP
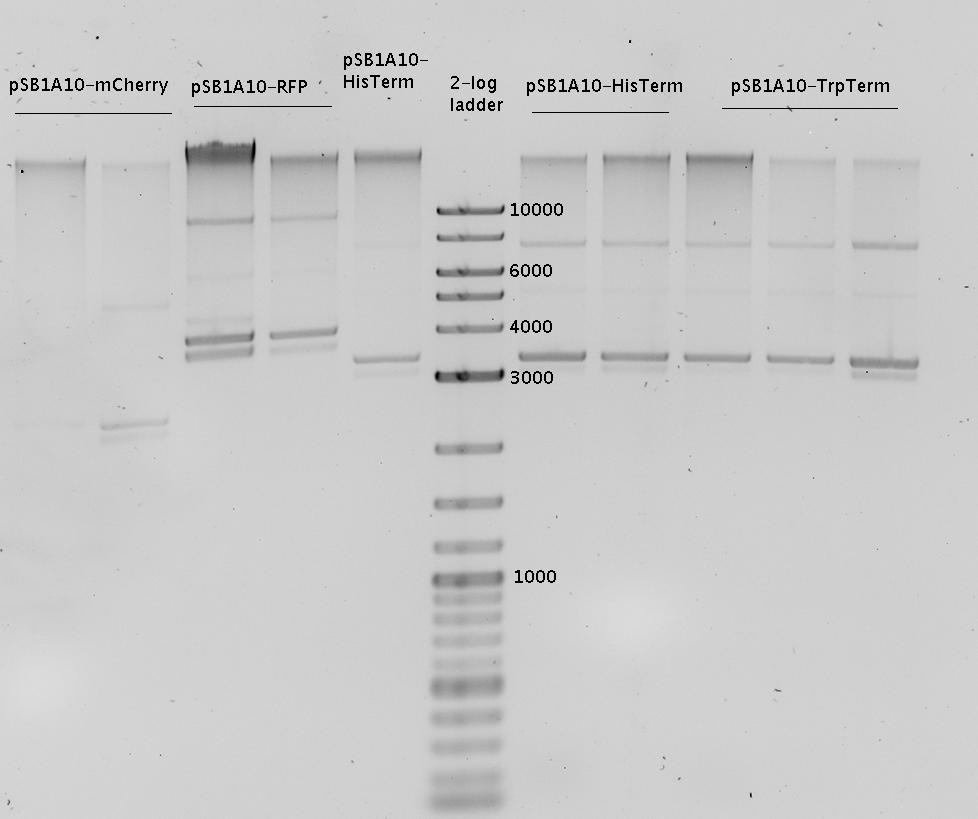
- Analytical agarose gel (1%):
- Digestion
- pSB1A10-HisTerm SgrAI/PstI
- pSB1A10-TrpTerm SgrAI/PstI
- pSB1A10-RFP SgrAI/PstI
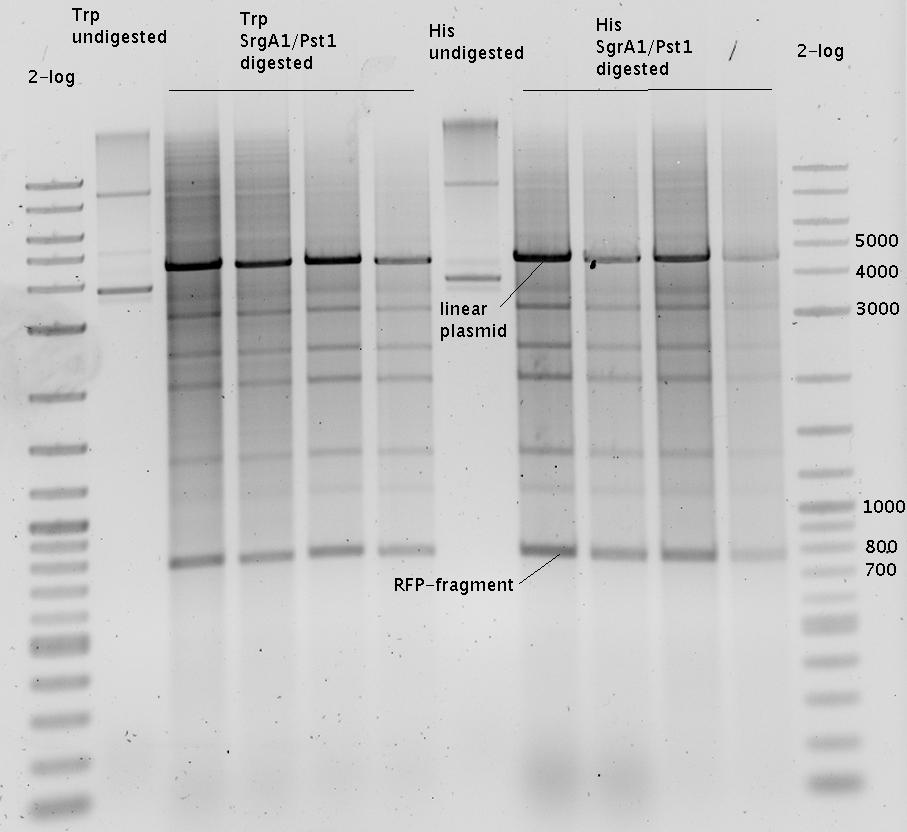
- =>RFP has a SrgAI cleaving site. Discarded RFP digestion.
- preparativ agarose gel (1%):
- Soubilization of SrgAI-PstI Linker
- Ligation
- Plasmid His-Term(Trp-Term) and Linker
- ca. 30min @ RT
- Transformation of DH5a cells with
- overnight cultures
- pSB1A2-mCherry
- pSB1A10-TrpTerm
19.08.2010
- MiniPrep using ZymoKit
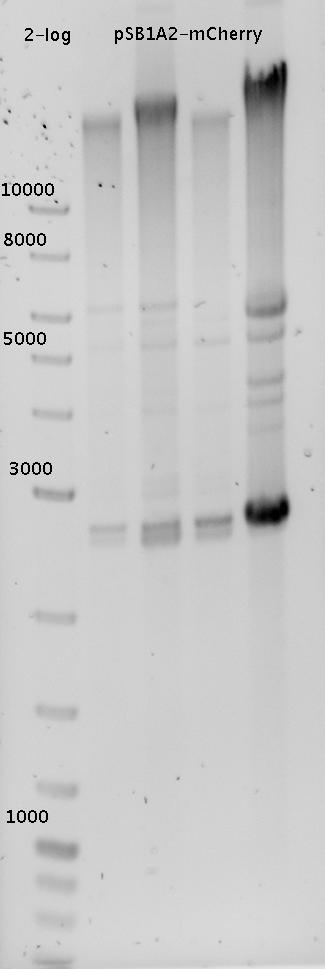
- analytic agarose gel (1%) from various mCherry Preps
- Picked 6 colonies from pSB1A10-HisTerm-linker and pSB1A10-TrpTerm-linker each (previous day's ligation)
- => Colony PCR => Gel (1.5%)
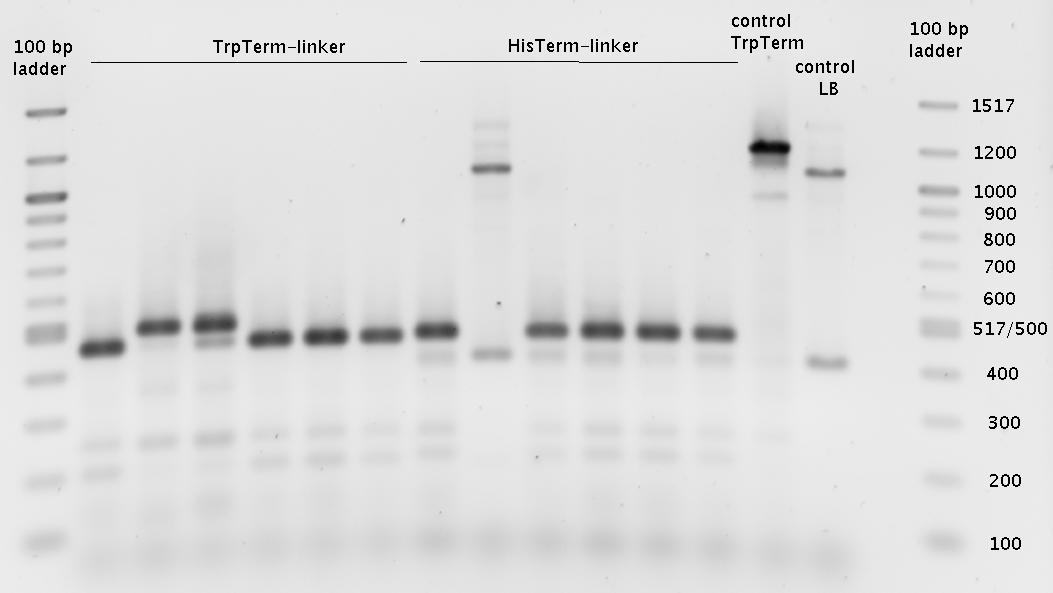
- overnight cultures (600µl)
- pSB1A2-mCherry
- pSB1A2-R0011
- pSB1A10-HisTerm-linker (#7, 11, 12)
- pSB1A10-TrpTerm-linker (#1, 2, 4)
20.08.2010
- MiniPrep using ZymoKit
- pSB1A2-mCherry
- pSB1A2-R0011
- pSB1A10-TrpLinker (picked Colonies)
- pSB1A10-HisLinker (picked Colonies)
- analytical Digestion
- pSB1A10-HisLinker SgrAI /EcoRI
- pSB1A10-HisLinker NsiI
- pSB1A10-TrpLinker SgrAI /EcoRI
- analytical agarose gel (1.5%)
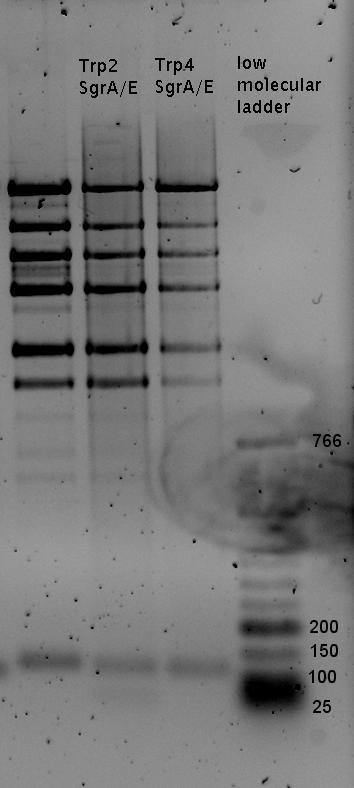
- preparativ Digestions
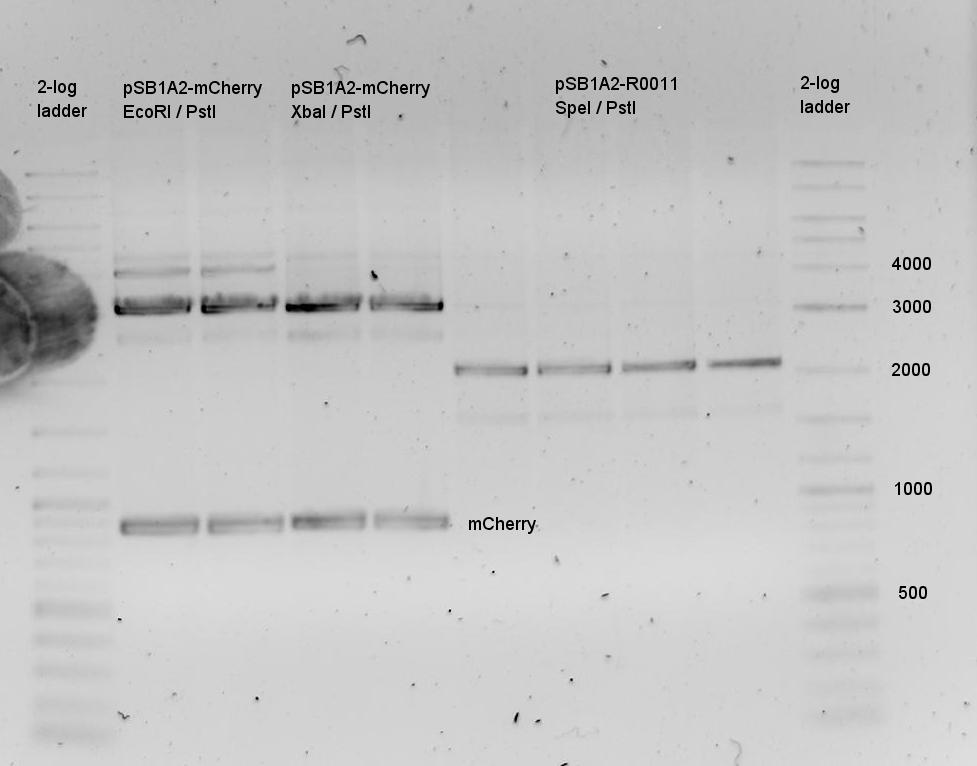
- pSB1A2-mCherry EcoRI /PstI
- pSB1A2-mCherry XbaI /PstI
- pSB1A2-R0011 SpeI /PstI
- pSB1A10-HisLinker SpeI /PstI
- pSB1A10-HisLinker EcoRI /PstI
- pSB1A10-TrpLinker SpeI /PstI
- pSB1A10-TrpLinker EcoRI /PstI
- PCR_BB1006 XbaI /PstI
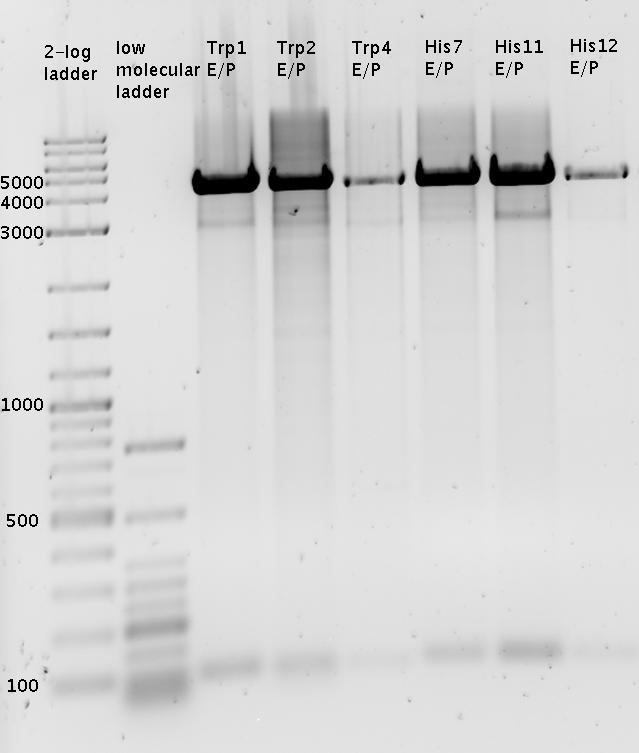
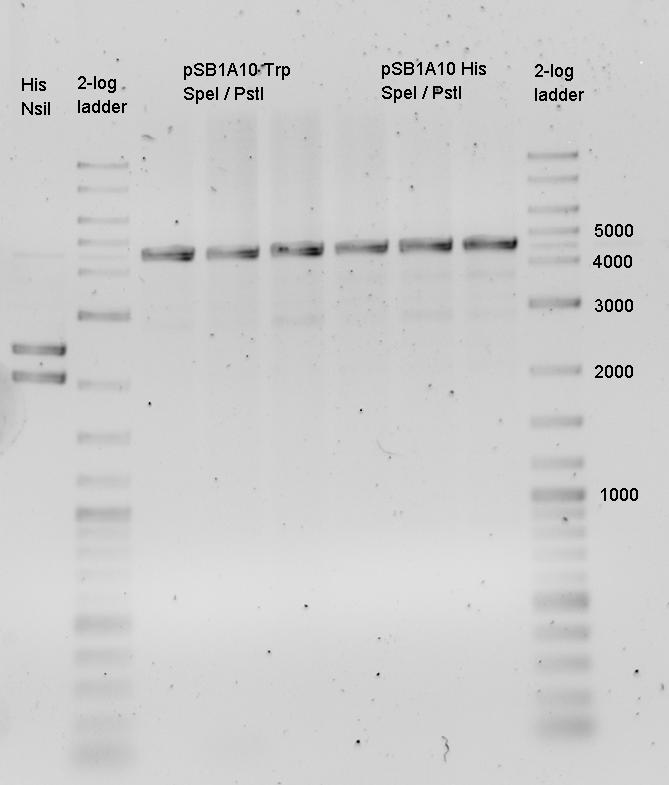
Close
Week22
Construction of new Measurement Plasmid
23.08.2010
- Ligation
- pSB1A10-HisLinker SpeI /PstI + mCherry XbaI /PstI
- pSB1A10-HisLinker EcoRI /PstI + mCherry EcoRI /PstI
- pSB1A10-TrpLinker SpeI /PstI + mCherry XbaI /PstI
- pSB1A10-TrpLinker EcoRI /PstI + mCherry EcoRI /PstI
- pSB1A2-R0011 SpeI /PstI + PCR_BB1006 XbaI /PstI
- Transformation of DH5a cells
24.08.2010
- Picked 2 colonies per plate (previous day's ligation)
- R0011_B1006Sig
- Trp1_mCherry
- Trp2_mCherry
- His7_mCherry
- His11_mCherry
- pSB1A10_mCherry
- Colony PCR of picked colonies with prefix/suffix primers
- analytical agarose gel 1 (1.5%)
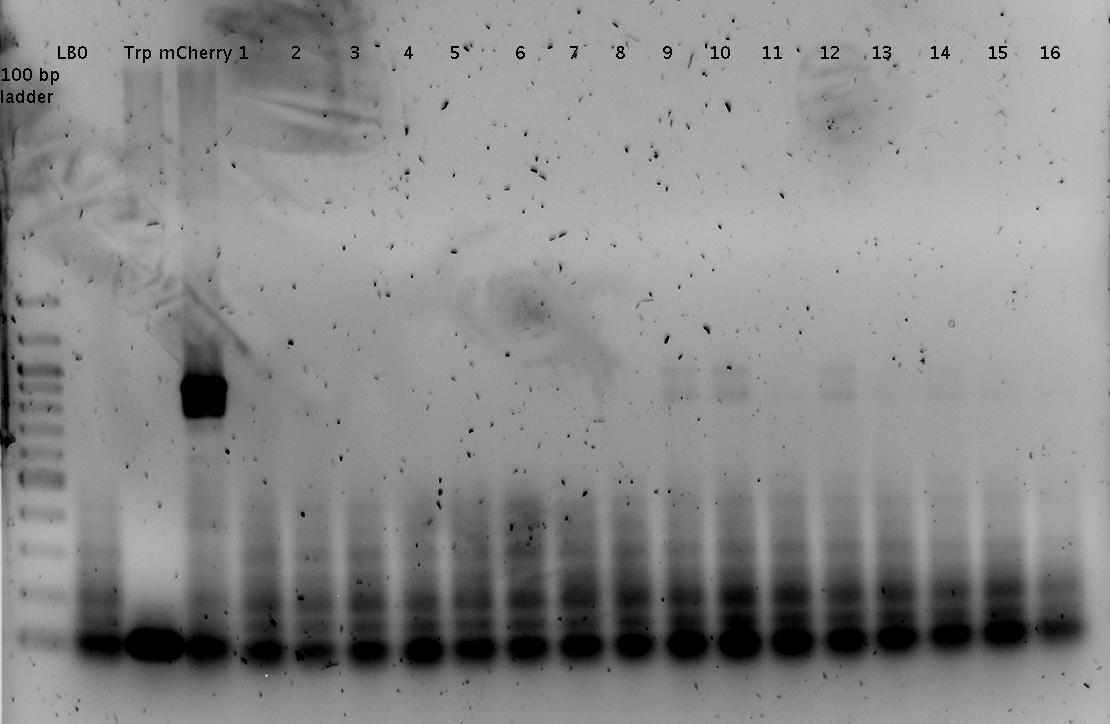
- analytical agarose gel 1 (1.5%)
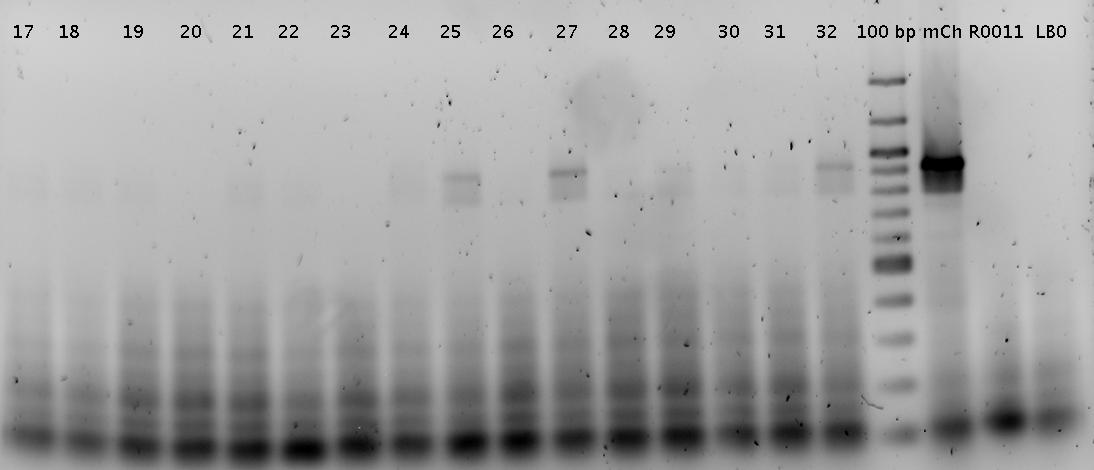
Trp=R0011, R0011= Trp :)
Faint bands at the correct length can be guessed.
- overnight cultures (5 ml)
- pSB1A10_TrpTerm_mCherry_linker
- pSB1A10_HisTerm_mCherry_linker
- pSB1A10_mCherry_linker
25.08.2010
- Miniprep using Zymo Miniprep-Classic Kit:
- pSB1A10_TrpTerm_mCherry_linker
- pSB1A10_HisTerm_mCherry_linker
- pSB1A10_mCherry_linker
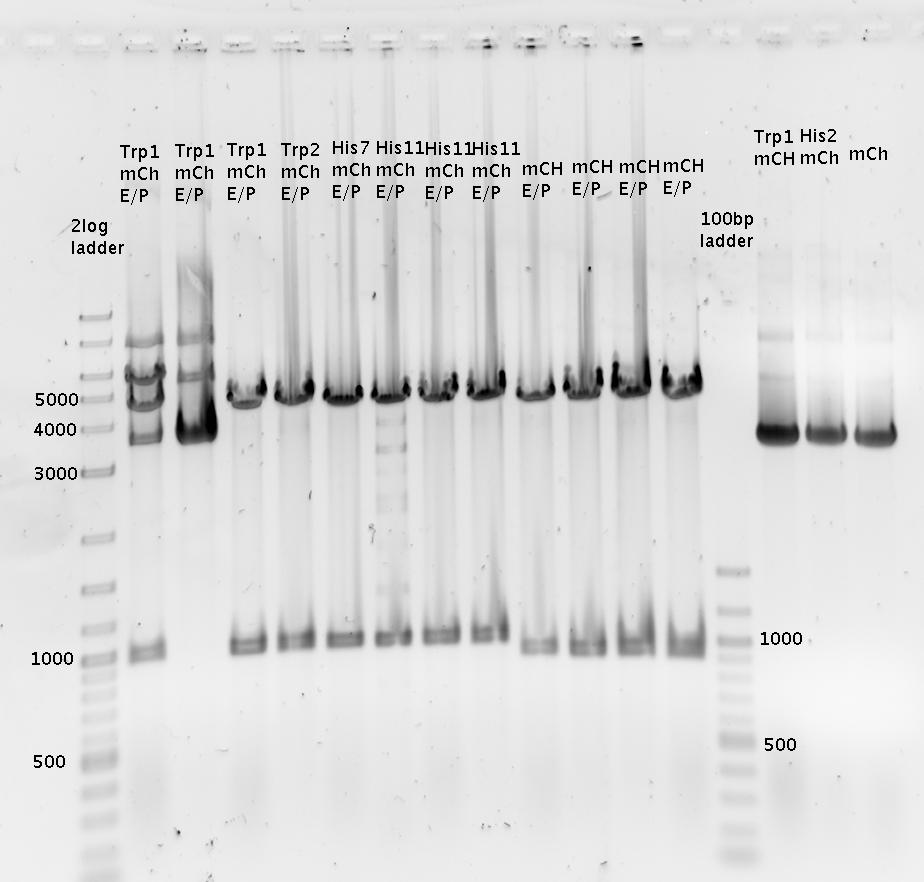
- analytical digestions
- pSB1A10_TrpTerm_mCherry_linker EcoRI /PstI
- pSB1A10_HisTerm_mCherry_linker EcoRI /PstI
- pSB1A10_mCherry_linker EcoRI /PstI
- analytical agarose gel 1 (1.0%)
- Picked 2 colonies per plate (day before yesterday's ligation)
- R0011_B1006Sig
- Trp1_mCherry
- Trp2_mCherry
- His7_mCherry
- His11_mCherry
- pSB1A10_mCherry
- Colony PCR of picked colonies with prefix/suffix primers
- analytical agarose gel 1 (1.5%)
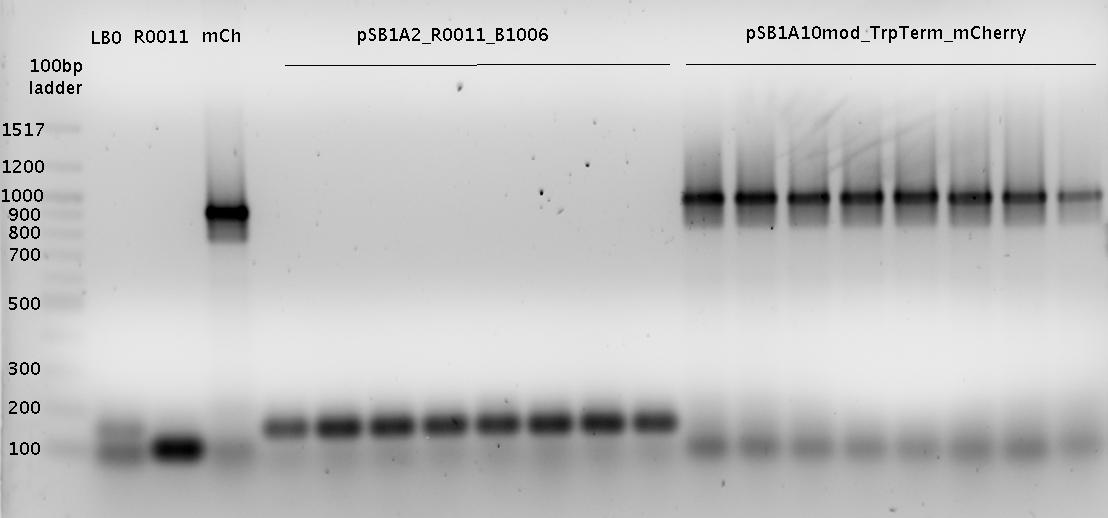
- analytical agarose gel 1 (1.5%)
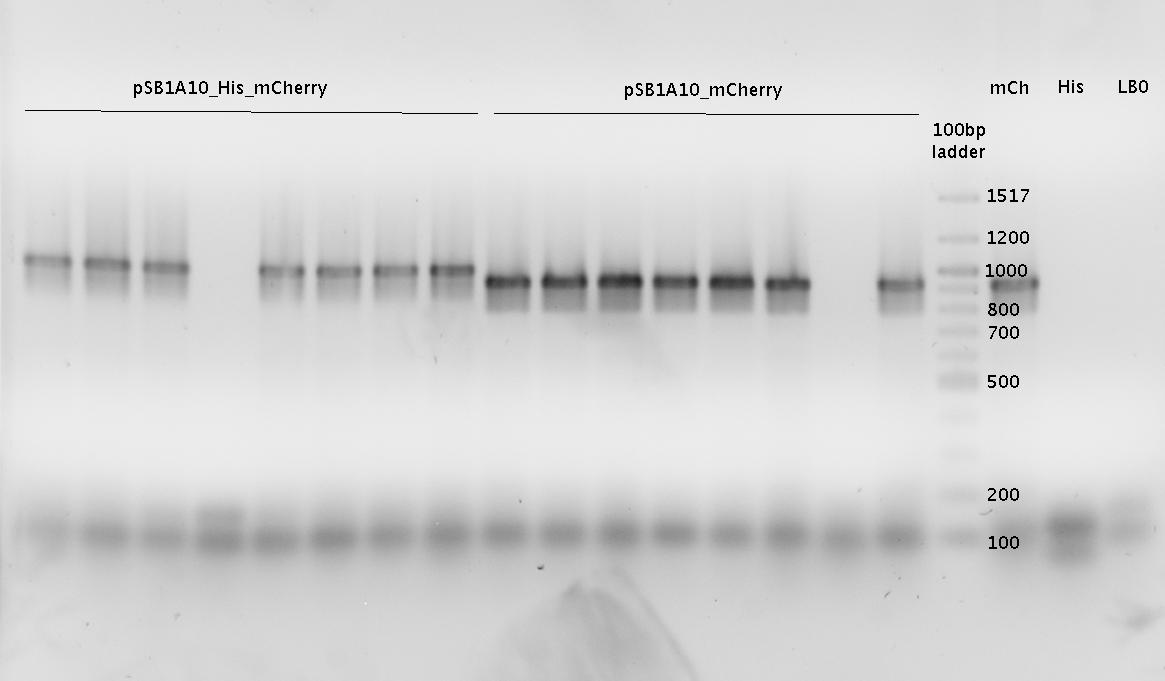
- overnight cultures (5 ml)
- pSB1A10_TrpTerm_mCherry_linker
- pSB1A10_HisTerm_mCherry_linker
- pSB1A10_mCherry_linker
26.08.2010
- Miniprep using Zymo Miniprep-Classic Kit:
- pSB1A10_TrpTerm_mCherry_linker
- pSB1A10_HisTerm_mCherry_linker
- pSB1A10_mCherry_linker
- pSB1A2_R0011_B1006
- PCR
- Trp-Signal (R0011_Sig_B0014)
- His-Signal (R0011_Sig_B0014)
- Terminator B0014
- analytical digestions
- pSB1A10_mCherry_linker EcoRI /PstI
- preparative digestion
- pSB1A10_TrpTerm_mCherry_linker SpeI/PstI
- pSB1A10_HisTerm_mCherry_linker SpeI/PstI
- pSB1A2_R0011_B1006 SpeI/PstI
- PCR Trp-Sig XbaI/PstI
- PCR His-Sig XbaI/PstI
- B0014 XbaI/PstI
- preparative agarose gel 1 (1.0%)
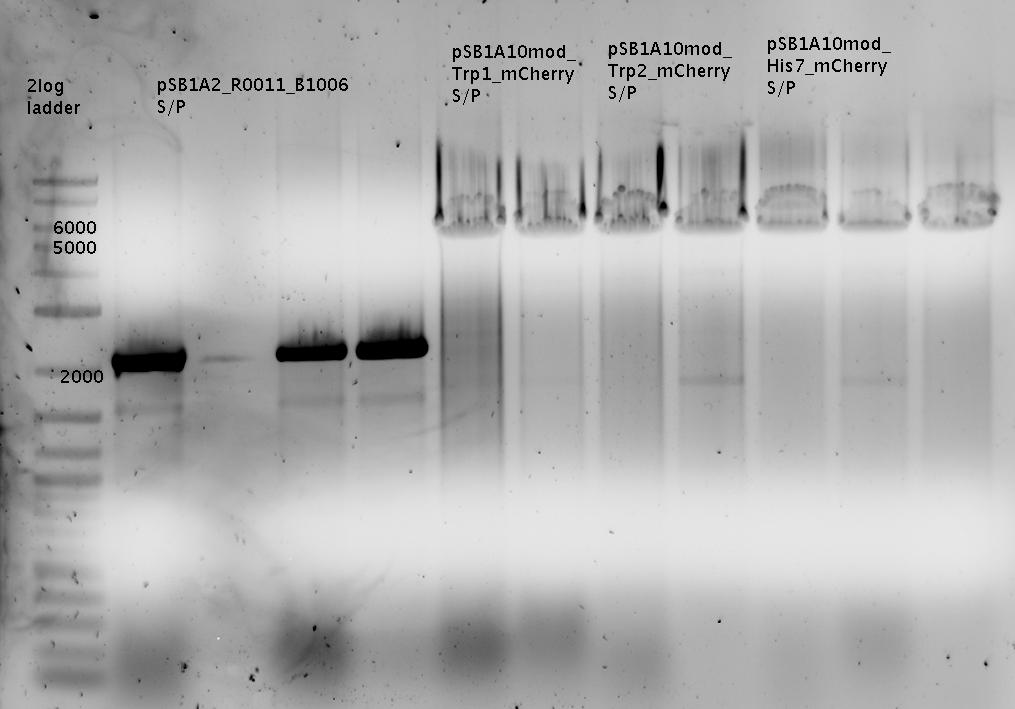 last lane: pSB1A10_His11_mCherry SpeI/PstI
- analytical agarose gel (1.0 %)
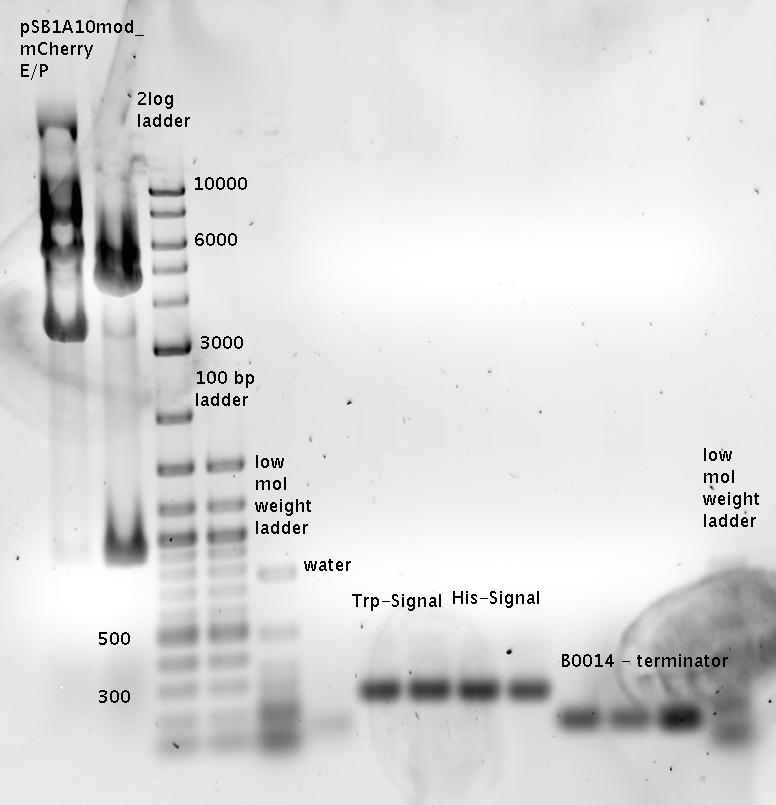
- Ligations
- pSB1A10_TrpTerm_mCherry_linker + Trp-Signal (R0011_Sig_B0014)
- pSB1A10_HisTerm_mCherry_linker + His-Signal (R0011_Sig_B0014)
- pSB1A2_R0011_B1006 + Terminator B0014
- Transformation of Ligation product in DH5alpha cells
- Transformation of pSB1A10_mCherry_linker in BL21
27.08.2010
for sequencing
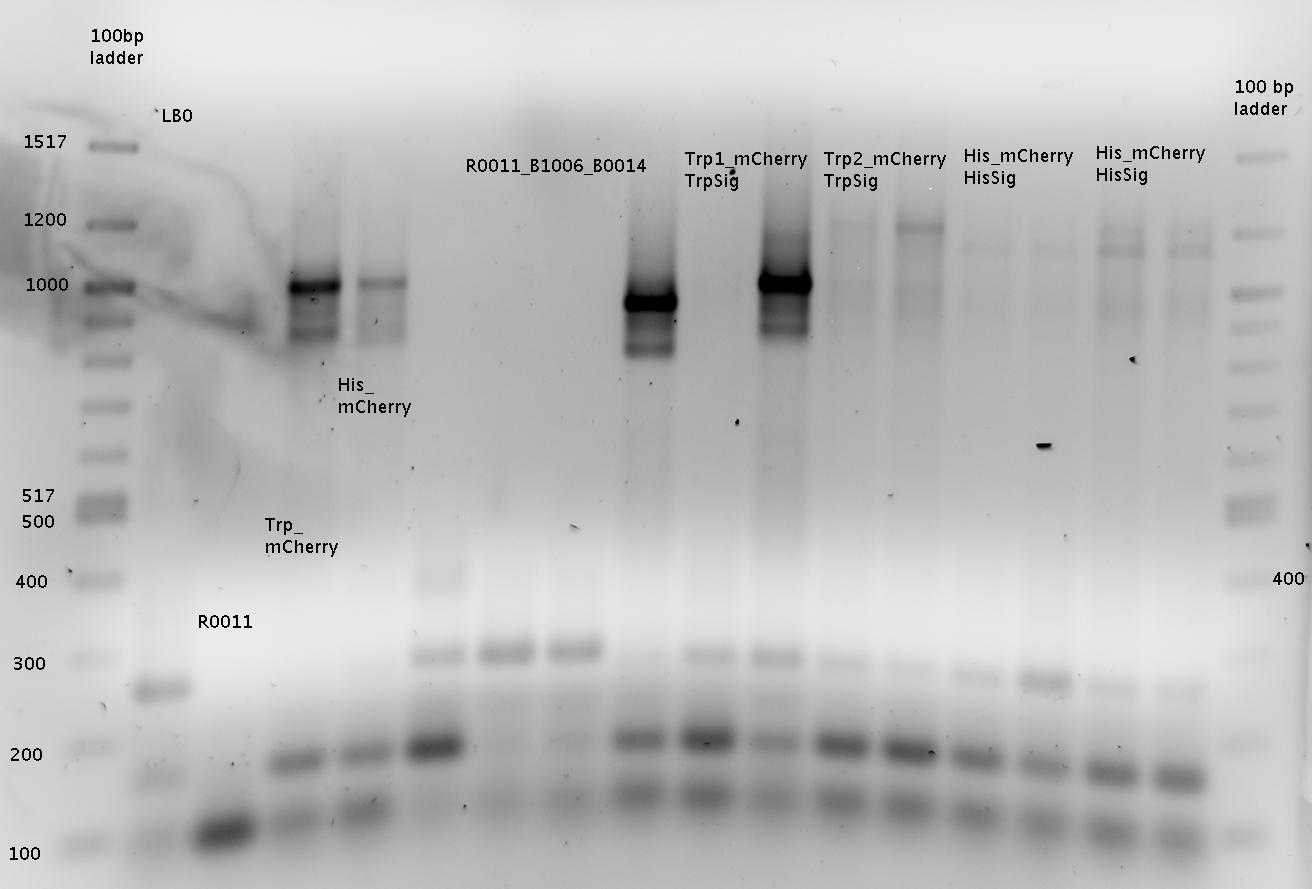 R0011=R0011_B1006!!!
- Sequencing
- pSB1A2_R0011_B1006 4b with primer Biobrick VR
- pSB1A10mod_mCherry 27b with primer GFP_FP and Biobrick VR
- pSB1A10mod_mCherry 32a with primer GFP_FP and Biobrick VR
Close
Week23
Construction of new Measurement Plasmid Testing new Measurement Plasmid
30.08.2010
- Colony PCR
- picked two colonies per plate from 26.08' ligation
- Program: colonypcr, modified elongation time: 1.15 instead of 1.00
- analytical agarose gel (1.5%)
Gel 1:
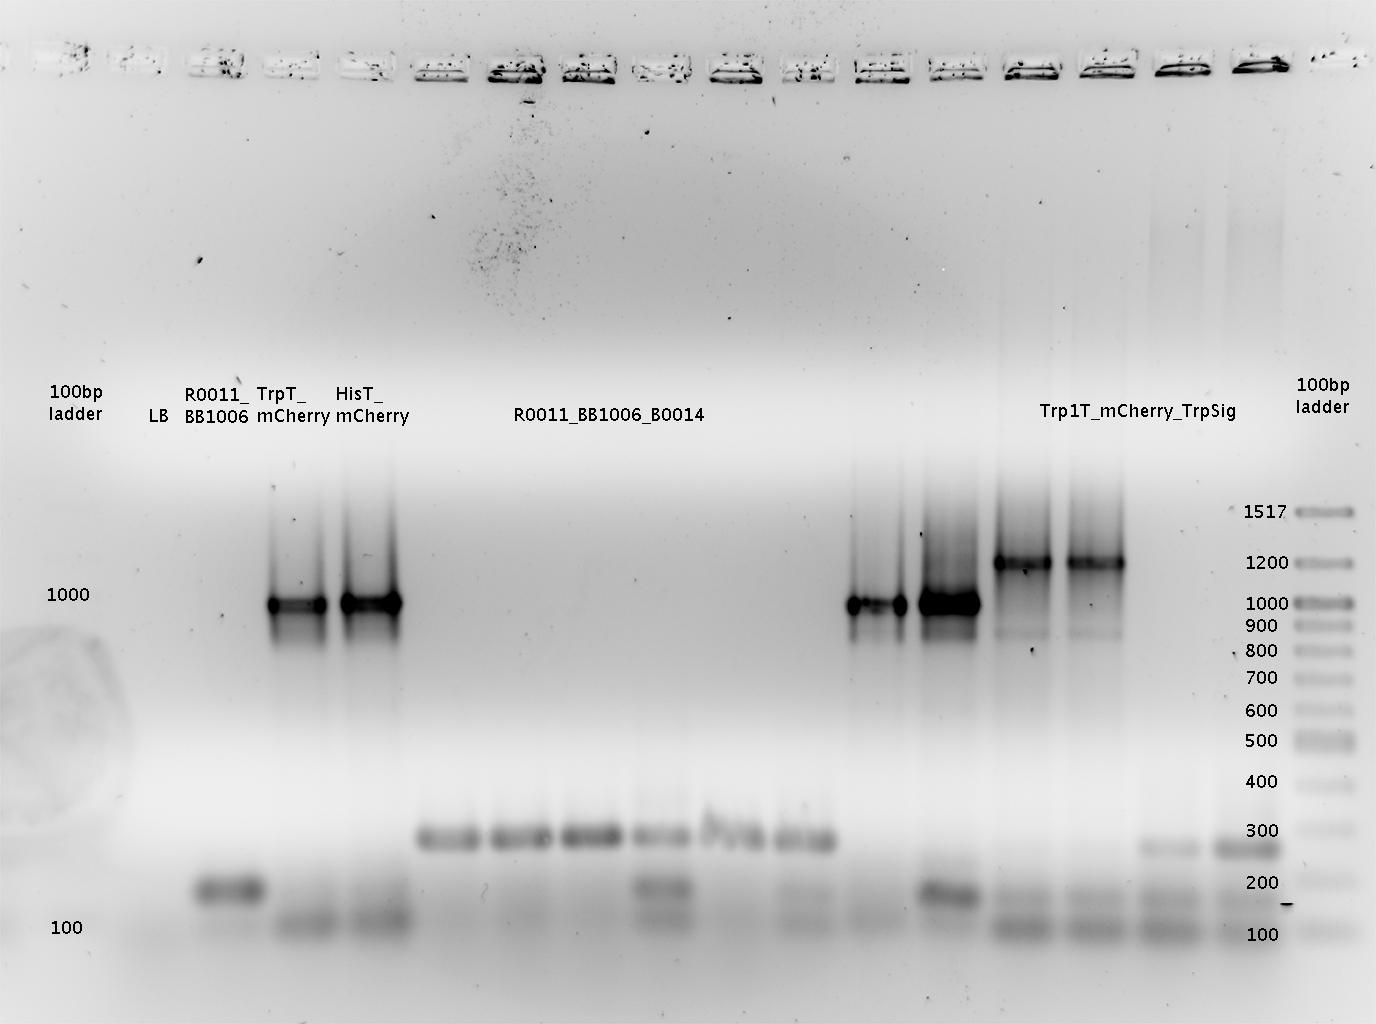
=> samples named "1x" to "8x" for pSB1A2-R0011-BB1006Sig-B0014 colonies
=> samples named "9x" to "12x" for pSB1A10mod-TrpTerm-mCherry-TrpSig colonies
Gel 2:
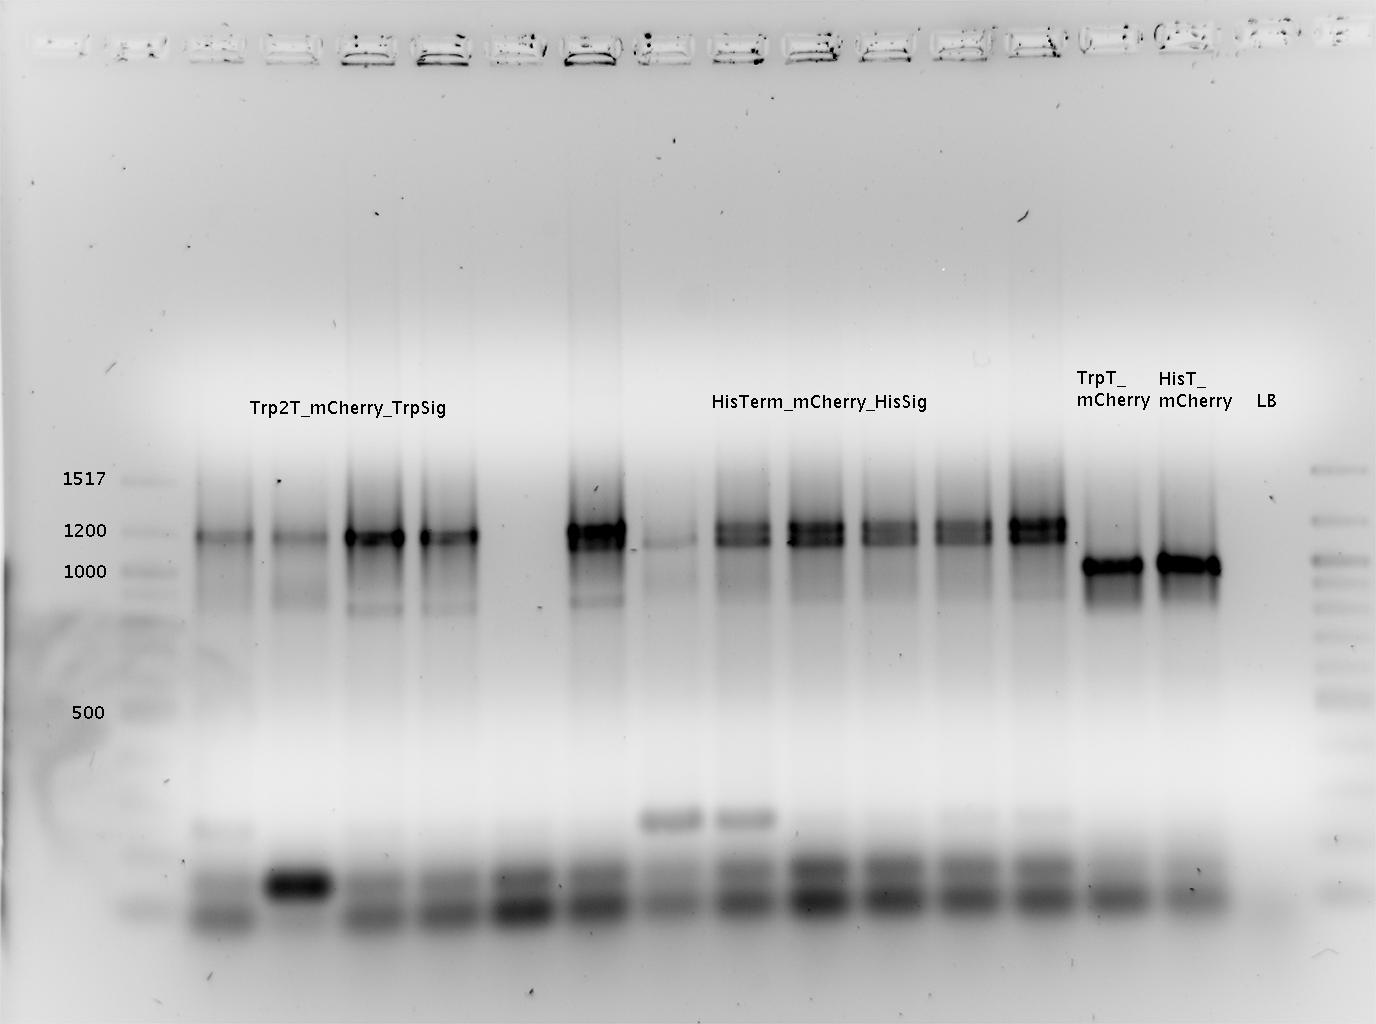
=> samples named "13x" to "16x" for pSB1A10mod-TrpTerm-mCherry-TrpSig colonies
=> samples named "17x" to "24x" for pSB1A10mod-HisTerm-mCherry-HisSig colonies
Interpretation for Gel1 and Gel2:
Ligation worked for the samples 1x-6x (pSB1A2-R0011-BB1006Sig-B0014), 9x-16x (pSB1A10mod-TrpTerm-mCherry-TrpSig), 18x-24x (pSB1A10mod-HisTerm-mCherry-HisSig)
- over night cultures:
- pSB1A10mod_HisTerm_mCherry_HisSignal
- pSB1A10mod_TrpTerm_mCherry_TrpSignal
- PSB1A2_R0011_BB1006_B0014
- Received sequencing results from GATC. All Sequences are okay:
- pSB1A10mod_mCherry (27b) and (32a)
- pSB1A2_R0011_BB1006 (4b)
31.08.2010
- Fluorescence measurement (positive control experiment):
- Settings: GFP-Excitation: 501nm; mCherry-Excitation: 587nm;
- endpoint measurements of:
- Timepoints of measurement: 3h after induction and 9h after induction (1,5h and 7h for 15x-smaple)
- Samples:
- pSB1A10mod-mCherry (27b) in BL21 cells, induced with ca. 0.4% L-Arabinose
- pSB1A10mod-mCherry (27b) in BL21 cells, not induced
- kinetic measurement of induced (0.4% L-Arabinose) BL21 cells carrying pSB1A10mod-mCherry (27b)
- Results:
- NO mCherry signal detected at all: The GFP signal shows a nice and strong increase; the RFP channel did not change at all.
- GFP signal looks perfect: strong if induced, neglectable if not!
- => System seems not capable of serving as a testing system for our switches!
- Glycerol stocks
- in DH5a cells:
- pSB1A10mod-TrpTerm-mCherry-TrpSig (9x)
- pSB1A10mod-TrpTerm-mCherry-TrpSig (15x)
- pSB1A10mod-TrpTerm-mCherry-TrpSig (10x) (sequence verified)
- pSB1A10mod-HisTerm-mCherry-HisSig (15x)
- pSB1A10mod-HisTerm-mCherry-HisSig (18x)
- pSB1A10mod-HisTerm-mCherry-HisSig (23x) (sequence verified)
- pSB1A10mod-mCherry (32a) (sequence verified)
- pSB1A10mod-mCherry (27b) (sequence verified)
- pSB1A2mod R0011-BB1006Sig-B0014 (2x) (sequence verified)
- pSB1A2mod R0011-BB1006Sig-B0014 (3x)
- pSB1A2mod R0011-BB1006Sig (4b) (sequence verified)
- in BL21 cells:
- pSB1A10mod-mCherry (27b) (sequence verified)
- "x" refers to Colony-PCR of 30.08.2010
- 5ml Over night cultures
- pSB1A10mod-TrpTerm-mCherry-TrpSig (9x, 15x, 10x)
- pSB1A10mod-HisTerm-mCherry-HisSig (18x, 23x, 15x)
- pSB1A2mod R0011-BB1006Sig-B0014 (2x, 3x)
01.09.2010
- MiniPrep using Zymo classical kit. Samples:
- pSB1A10mod-TrpTerm-mCherry-TrpSig (9x, 15x, 10x)
- pSB1A10mod-HisTerm-mCherry-HisSig (18x, 23x, 15x)
- pSB1A2mod R0011-BB1006Sig-B0014 (2x, 3x)
- Fluorescence measurement (positive control experiment):
- endpoint measurements:
- Timepoints of measurement: 3h after induction and 9h after induction (1,5h and 7h for 15x-smaple)
- Settings: GFP-Excitation: 501nm; mCherry-Excitation: 587nm; RFP-Excitation: 584nm
- Samples:
- pSB1A10mod-mCherry (32a) in DH5a cells, induced with ca. 0.4% L-Arabinose
- pSB1A10mod-mCherry (32a) in DH5a cells, not induced
- pSB1A10mod-mCherry (32a) in BL21 DE3 cells, induced with ca. 0.4% L-Arabinose
- pSB1A10mod-mCherry (32a) in BL21 DE3 cells, not induced
- pSB1A10-RFP, in DH5a cells, induced with ca. 0.4% L-Arabinose
- pSB1A10-RFP, in DH5a cells, not induced
- pSB1A10mod-TrpTerm-mCherry-TrpSig (15x), in DH5a cells, induced with ca. 0.4% L-Arabinose
- pSB1A10mod-TrpTerm-mCherry-TrpSig (15x), in DH5a cells, not induced
- Results:
- Very strong RFP signal in pSB1A10-RFP, induced and not induced
- For the first time we saw a weak but easily-detectable mCherry signal in positive control samples (pSB1A10mod-mCherry) 3 hours after induction! There was hardly no difference between the uninduced and the induced control samples for mCherry. The GFP signals was strong for induced control experiments and very weak for not induced samples! The pSB1A10mod-TrpTerm-mCherry-TrpSig sample also showd a small mCHerry signal.
- After 9 hours the mCherry signals were generally reduced, whereas the GFP signals were still high in all induced samples and low in all uninduced samples.
- => Although we saw mCherry for the first time (!), the signal is to weak not reproducable! As a consequence the system can not be used to serve as a measure for our switches! Furthermore the settings of the fluorometer are ok, since we saw strong RFP signal.
02.09.2010
Starting the cloning of pBAD (BioBrick I13453) downstream of GFP
- Amplifing the Arabinose-inducable promotor pBAD
- Resuspending the BioBrick I13453 with 10µl in well 1F in the 2010 Distribution
- PCR using 1µl template (programm "igempcr")
- Purified using DNA Concentrator (ZymoKit)
- Digestion (EcoRI and SpeI) of PCR product and heat inactivation (20min @ 80°C)
- Digestion of the target vectors using EcoRI and XbaI
- Samples:
- pSB1A10mod-TrpTerm-mCherry-TrpSig (9x, 10x)
- pSB1A10mod-HisTerm-mCherry-HisSig (23x, 24x)
- pSB1A10mod-mCherry (32a, 27b)
- pSB1A10mod-TrpTerm-mCherry (10b, 13b)
- pSB1A10mod-HisTerm-mCherry (18b, 24b)
- Purified using 1% agarose gel:
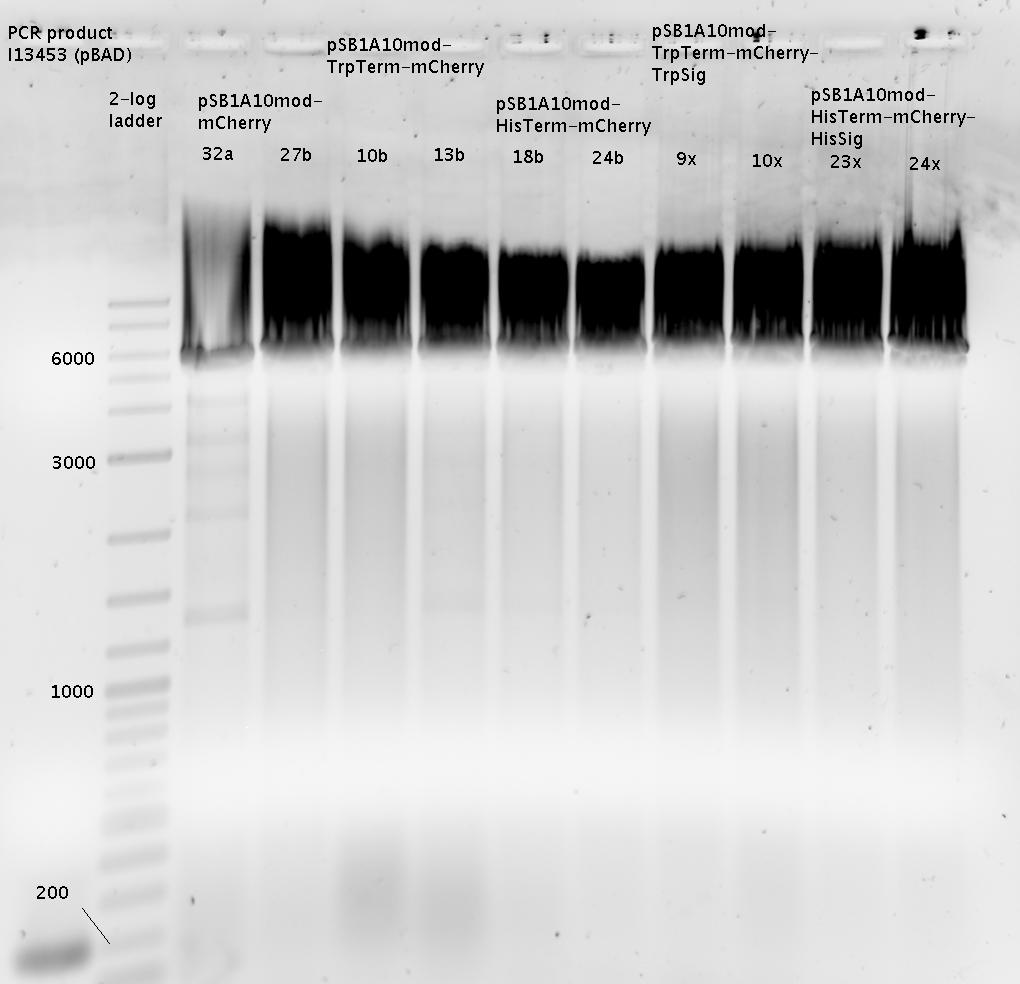
- => Interpretation: Gel is overloaded! However digestion seemed to work since the bands show correct masses.
- Extraction of bands at ca. 6000bp
- 10 µl ligation of 50ng of each digested vector with 8ng insert
- Transformation of DH5a cells using 8µl ligation sample
03.09.2010
- Colony PCR
- picked two colonies per plate from 02.09' ligation
- Note: no PCR because Thermocycler was occupied
Close
Week24
in vivo constructs Testing HisTrp
06.09.2010
- Colony PCR
- using colonies picked on 03.09.
- analytical agarose gel (1.5%)
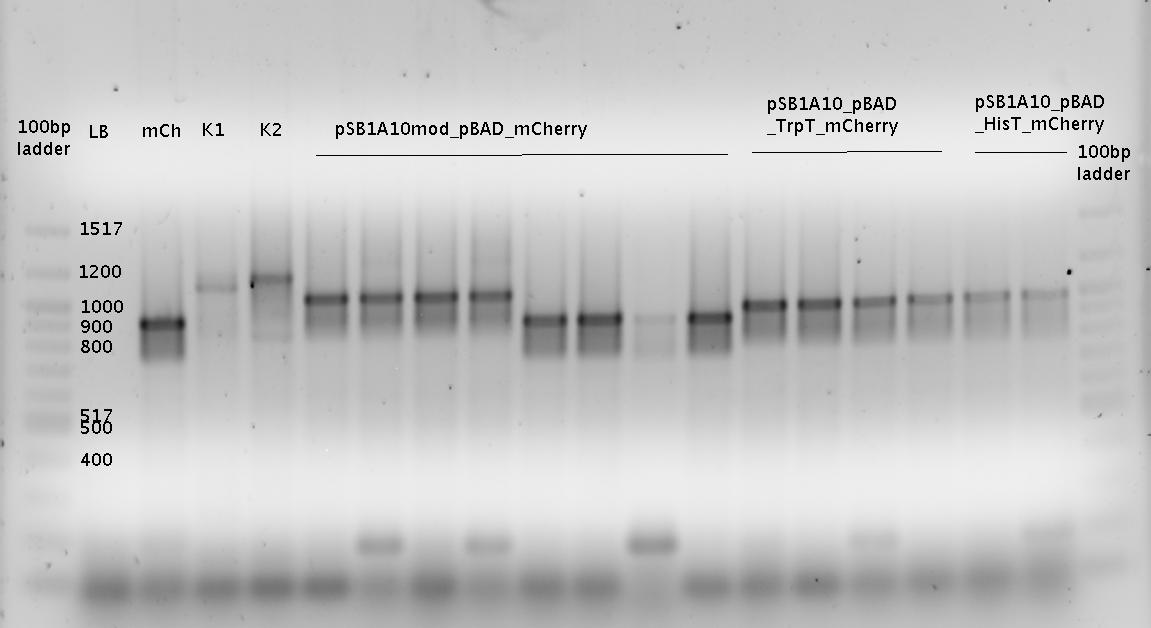
- K1= pSB1A10mod_HisTerm_mCherry_HisSig
- K2 = pSB1A10mod_TrpTerm_mCherry_TrpSig
- 5ml over night cultures:
- positive control pSB1A10mod_Pbad_mCherry
- negative His control pSB1A10mod_Pbad_HisTerm_mCherry
- His-Switch pSB1A10mod_Pbad_HisTerm_mCherry_HisSig
- Trp-Switch pSB1A10mod_Pbad_TrpTerm_mCherry_TrpSig
07.09.2010
- MiniPrep using Zymo Classical kit
- pSB1A10mod_Pbad_mCherry
- pSB1A10mod_Pbad_HisTerm_mCherry
- pSB1A10mod_Pbad_HisTerm_mCherry_HisSig
- pSB1A10mod_Pbad_TrpTerm_mCherry_TrpSig
- Fluorescence measurements
- Induction with 0.2% L-arabinose
- Measurement of OD600
- Fluorescence measurement at 30min, 150min (only Pos.Control) and 4.5h
- Samples:
- pSB1A10mod_Pbad_mCherry
- pSB1A10mod_Pbad_HisTerm_mCherry
- pSB1A10mod_Pbad_HisTerm_mCherry_HisSig
- pSB1A10mod_Pbad_TrpTerm_mCherry_TrpSig
- Transformation of BL21 (DE3)
- pSB1A10mod_Pbad_mCherry
- pSB1A10mod_Pbad_HisTerm_mCherry
- pSB1A10mod_Pbad_HisTerm_mCherry_HisSig
- pSB1A10mod_Pbad_TrpTerm_mCherry_TrpSig
08.09.2010
- 30%Glycerol in LB_Carb
- pSB1A10mod_Pbad_mCherry
- pSB1A10mod_Pbad_HisTerm_mCherry
- pSB1A10mod_Pbad_HisTerm_mCherry_HisSig
- pSB1A10mod_Pbad_TrpTerm_mCherry_TrpSig
- Fluorescence measurements
- Induction with 0.2% L-arabinose
- Measurement of OD600
- Fluorescence measurement at 24h and different OD600
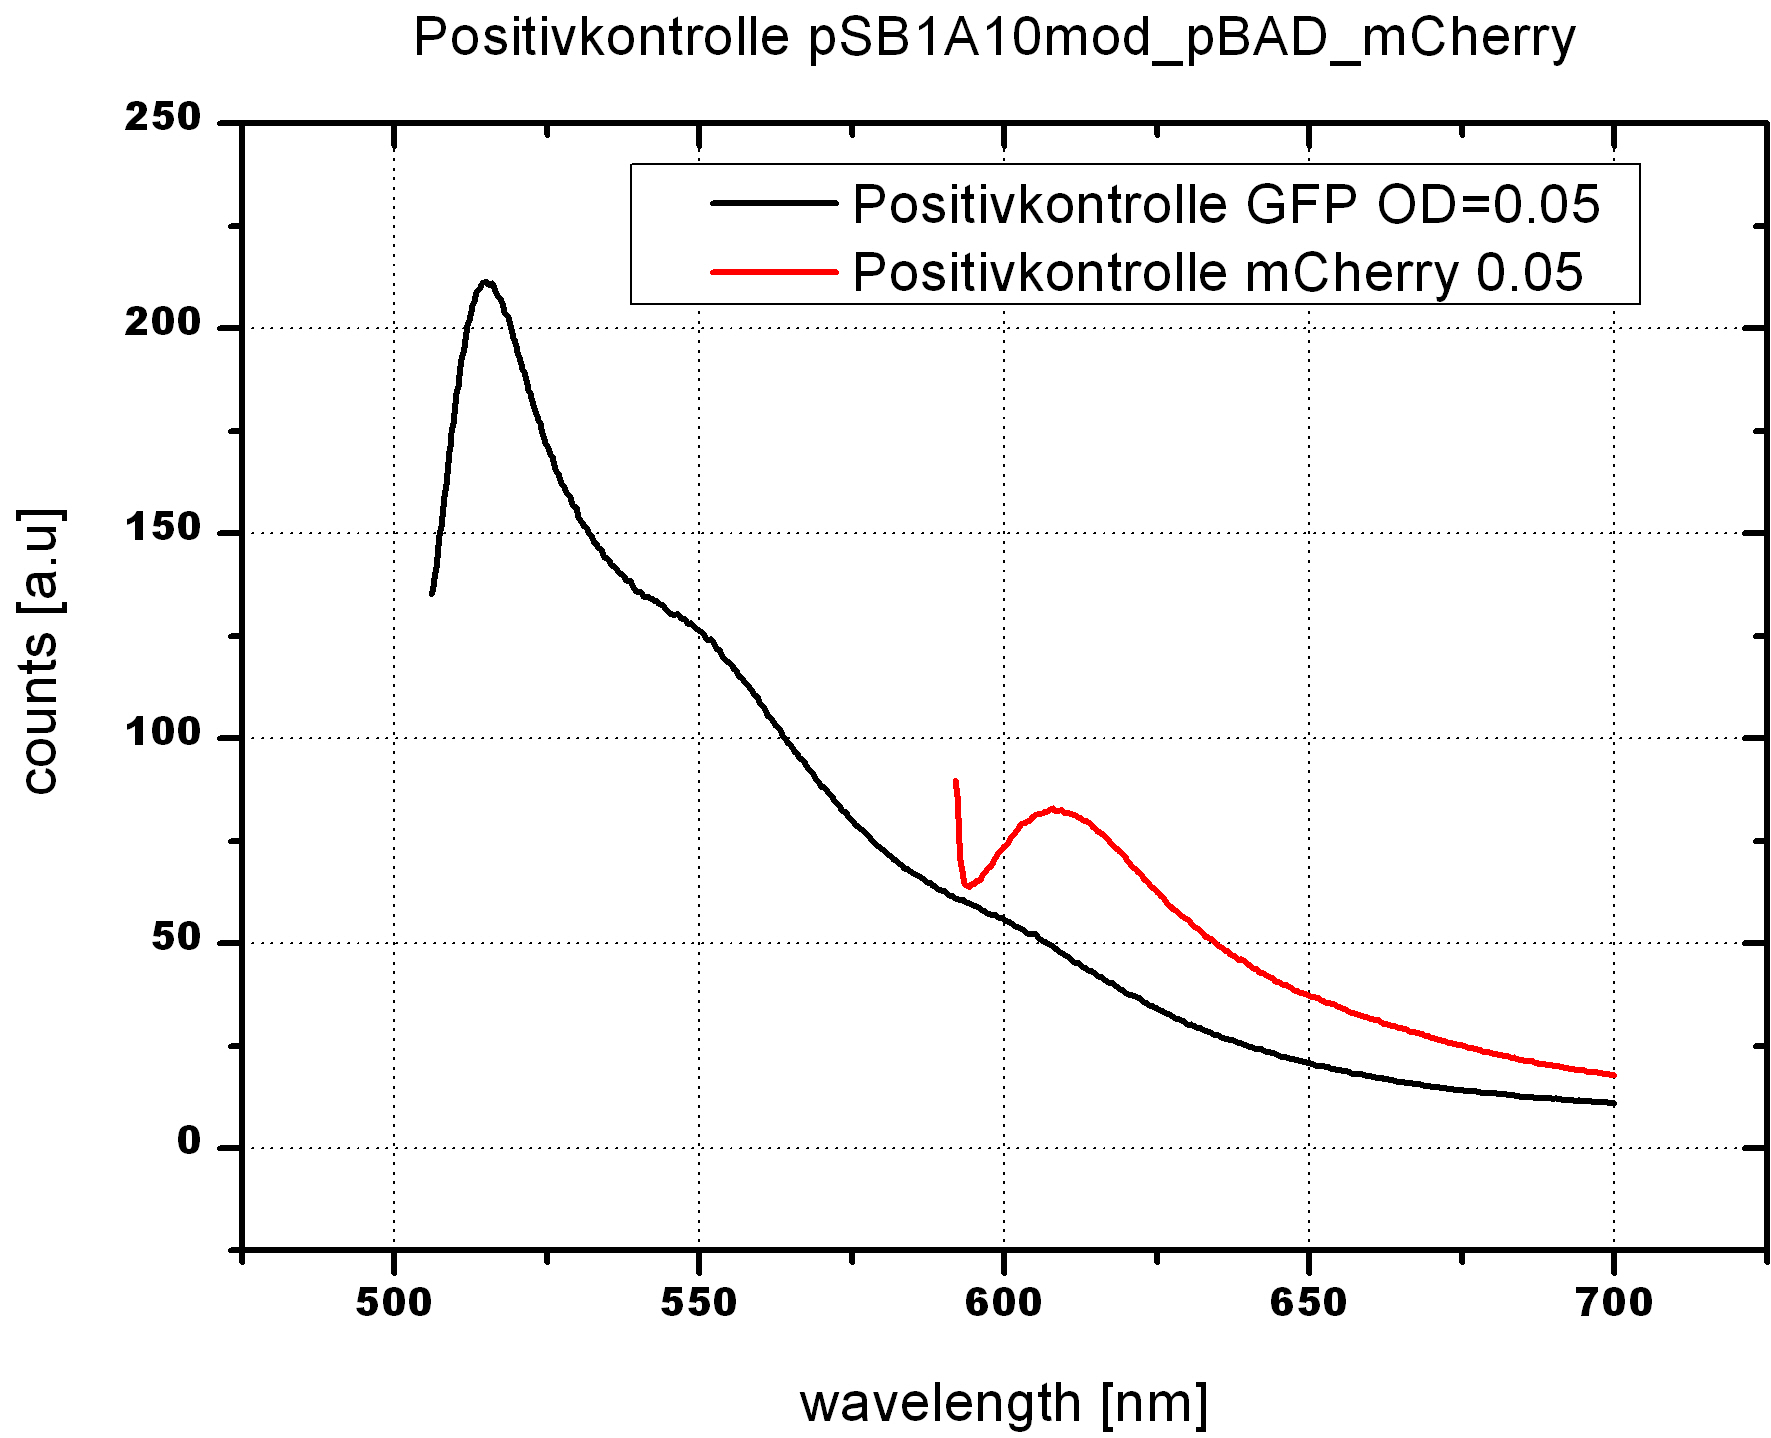
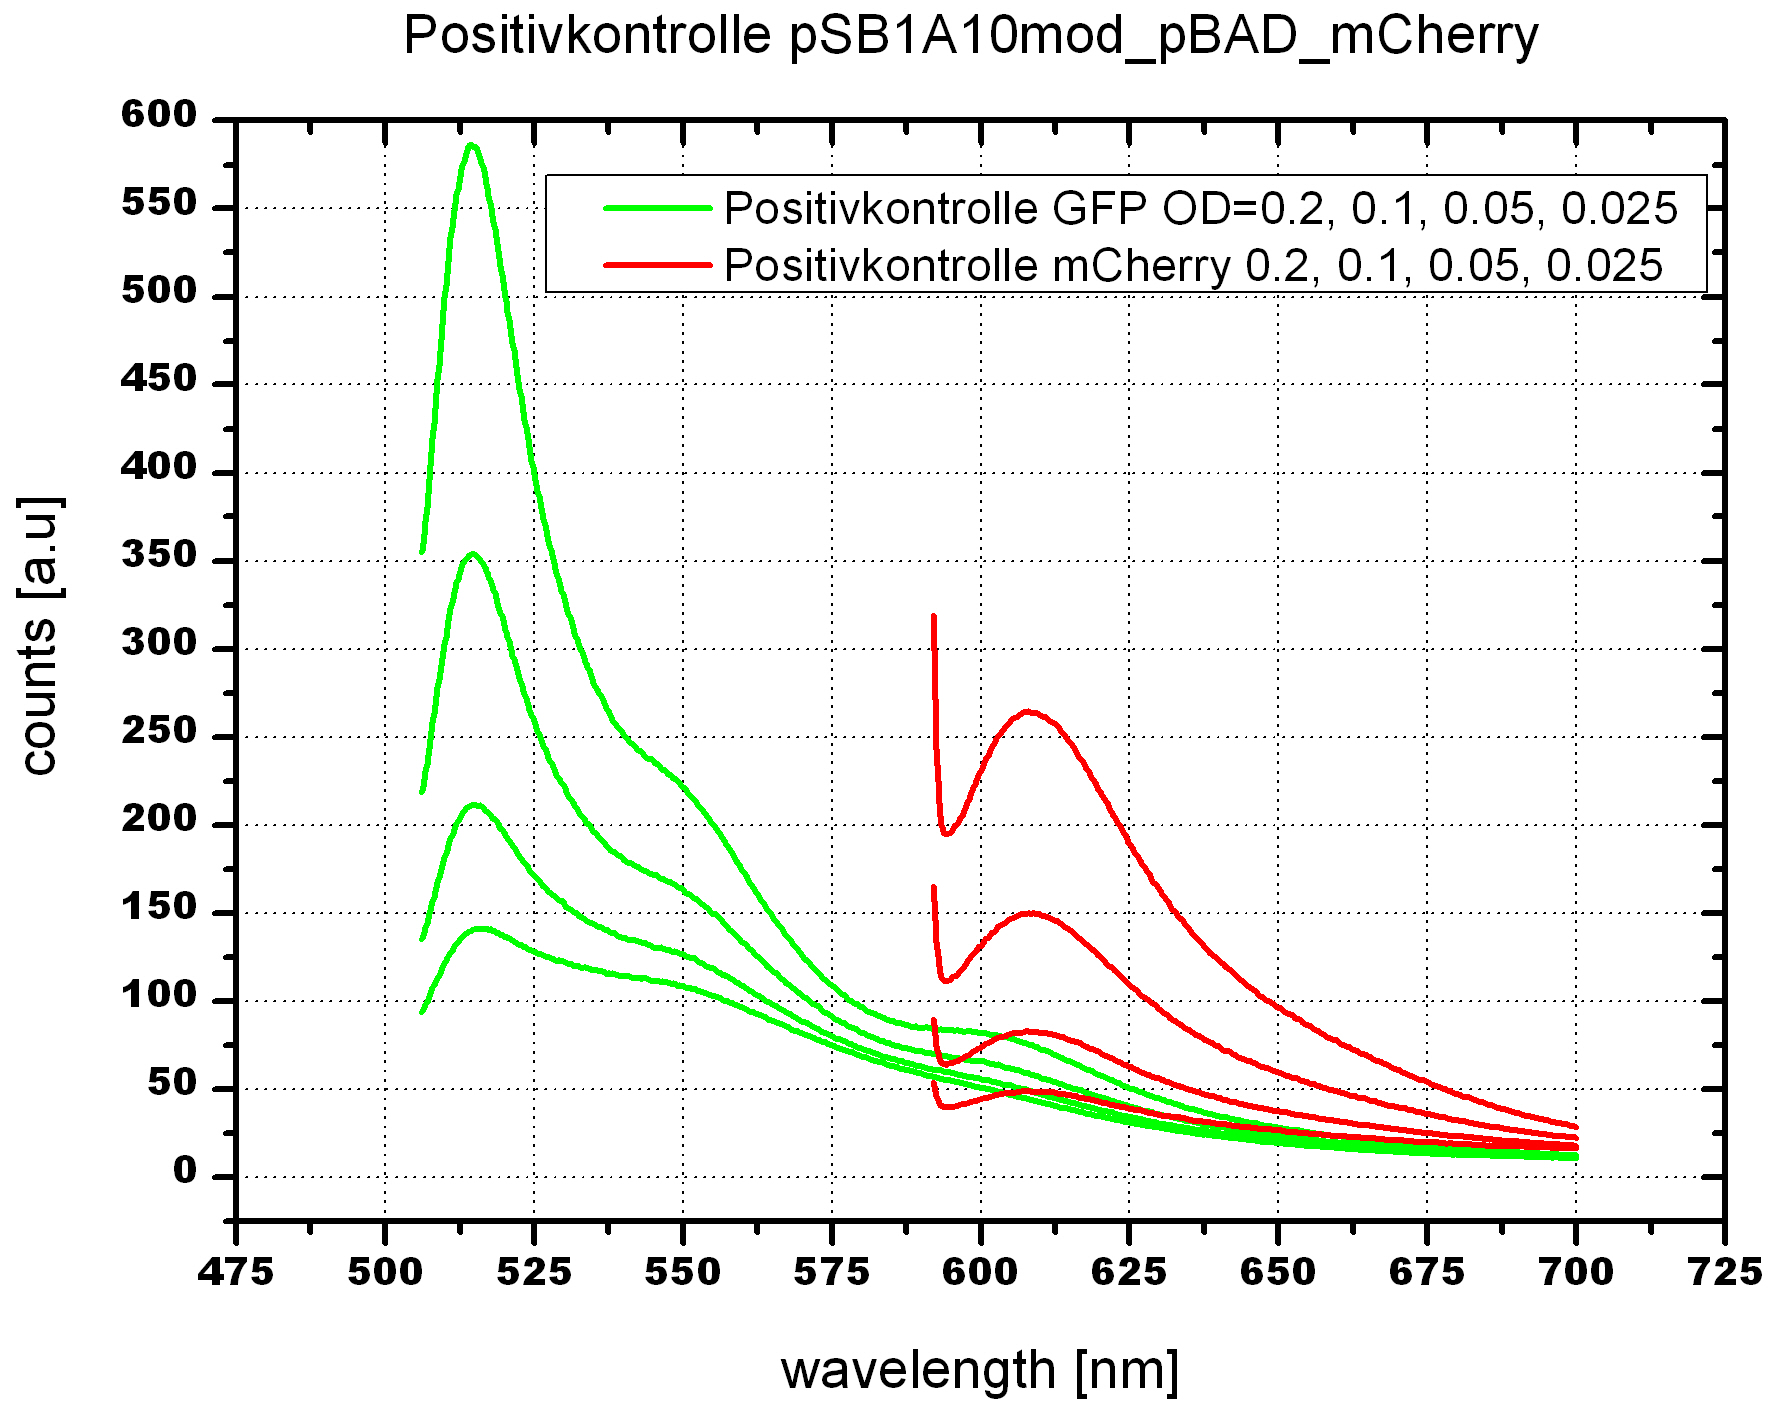
- Samples:
- pSB1A10mod_Pbad_mCherry
-->OD600 0.05 reasonable for our cell measurements. Positive control works fine after 24h induction.
- 5ml cultures of BL21 cells
- pSB1A10mod_Pbad_mCherry
- pSB1A10mod_Pbad_HisTerm_mCherry
- pSB1A10mod_Pbad_HisTerm_mCherry_HisSig
- pSB1A10mod_Pbad_TrpTerm_mCherry_TrpSig
- ColonyPCR
- picked 4 Colonies per Neg.TrpControl from 02.09' ligation plates
- PCR using Program 'colonyPCR'. Elongation time modified to 1:20min
09.09.2010
- Fluoresence measurement
- using BL21 cells
- samples:
- Positive control (pSB1A10mod_pBAD_mCherry)
- Negative control (pSB1A10mod_pBAD_HisTerm_mCherry)
- pSB1A10mod_pBAD_HisTerm_mCherry_HisSignal
- pSB1A10mod_pBAD_TrpTerm_mCherry_TrpSignal
- Induction with 0.4% L-arabinose and 1mM IPTG
- Timepoints: 1h, 2h, 4h, 10h, 16h (induced the day before)
- (OD checked seperately each time; average ODs=0.02-0.06)
- 30% glycerol stocks of BL21 cells carrying:
- Positive control (pSB1A10mod_pBAD_mCherry)
- Negative control (pSB1A10mod_pBAD_HisTerm_mCherry)
- pSB1A10mod_pBAD_HisTerm_mCherry_HisSignal
- pSB1A10mod_pBAD_TrpTerm_mCherry_TrpSignal
10.09.2010
- Fluorescence measurements
- Induction with 0.4% L-arabinose and 1mM IPTG
- Measurement of OD600
- Fluorescence measurement at 15h and 26h
- Samples:
- pSB1A10mod_Pbad_mCherry - Positive Control
- pSB1A10mod_Pbad_HisTerm_mCherry - HisNeg. Control
- pSB1A10mod_Pbad_HisTerm_mCherry_HisSignal
- pSB1A10mod_Pbad_TrpTerm_mCherry_TrpSignal
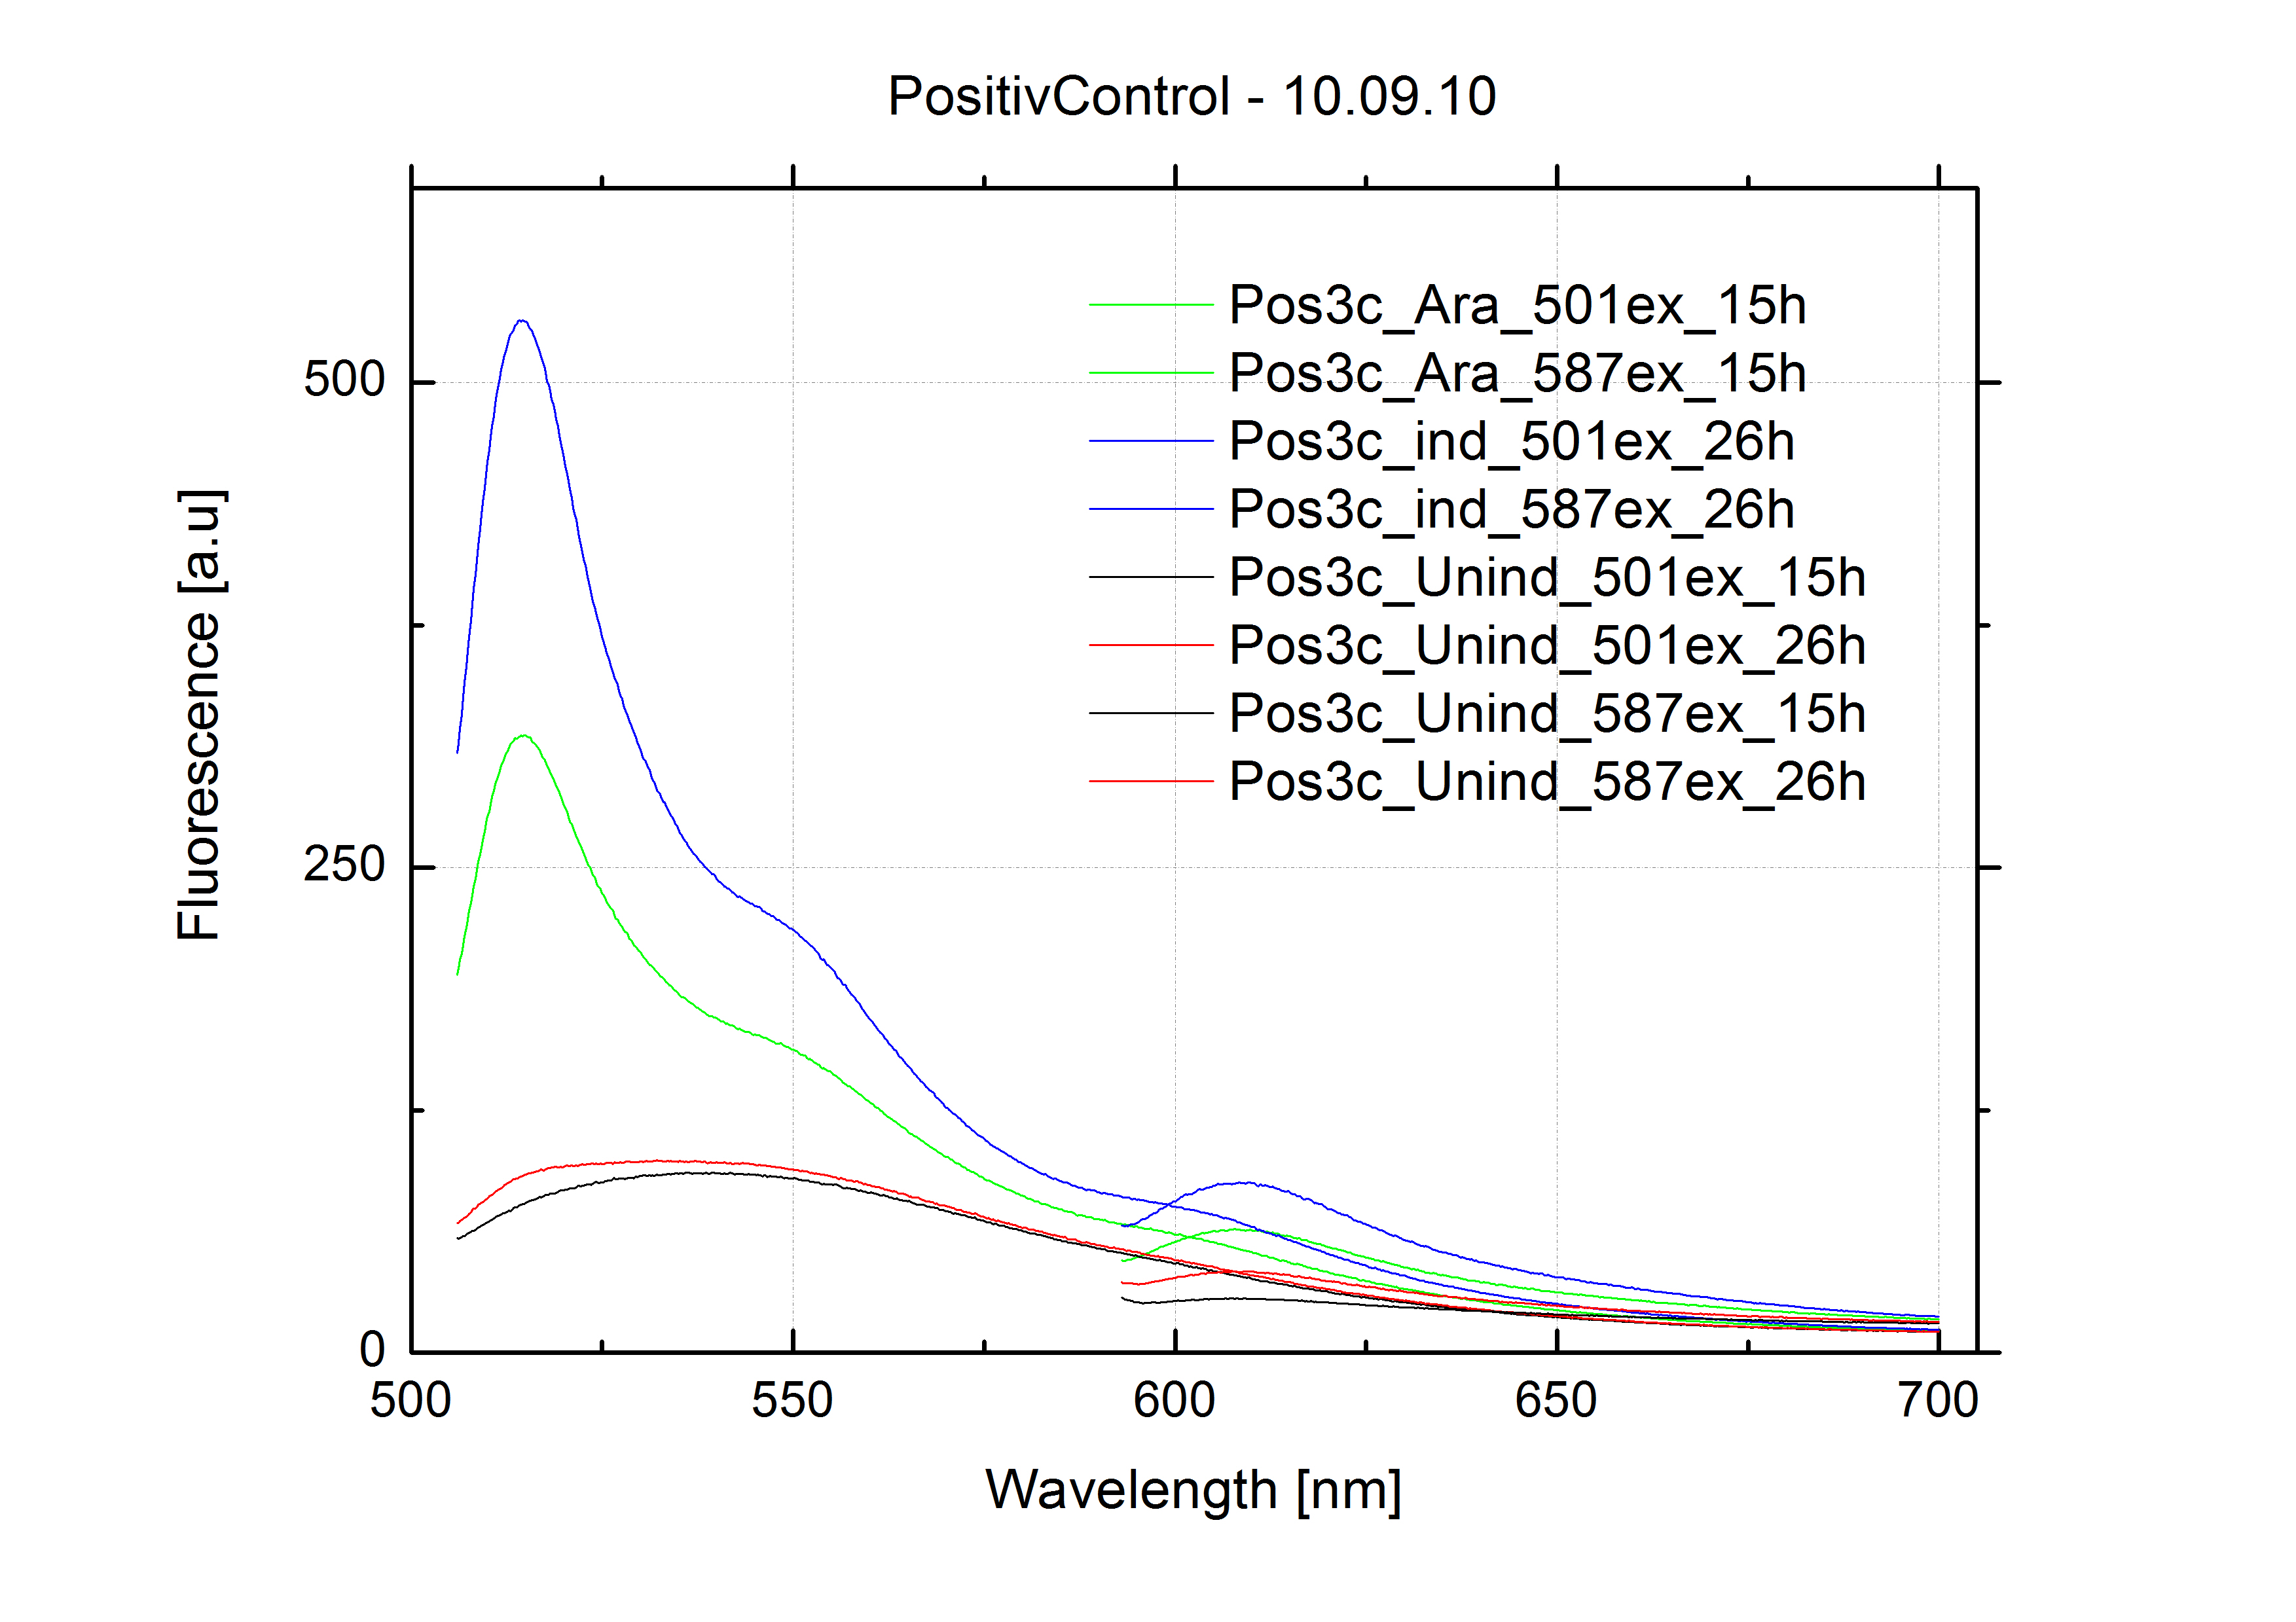
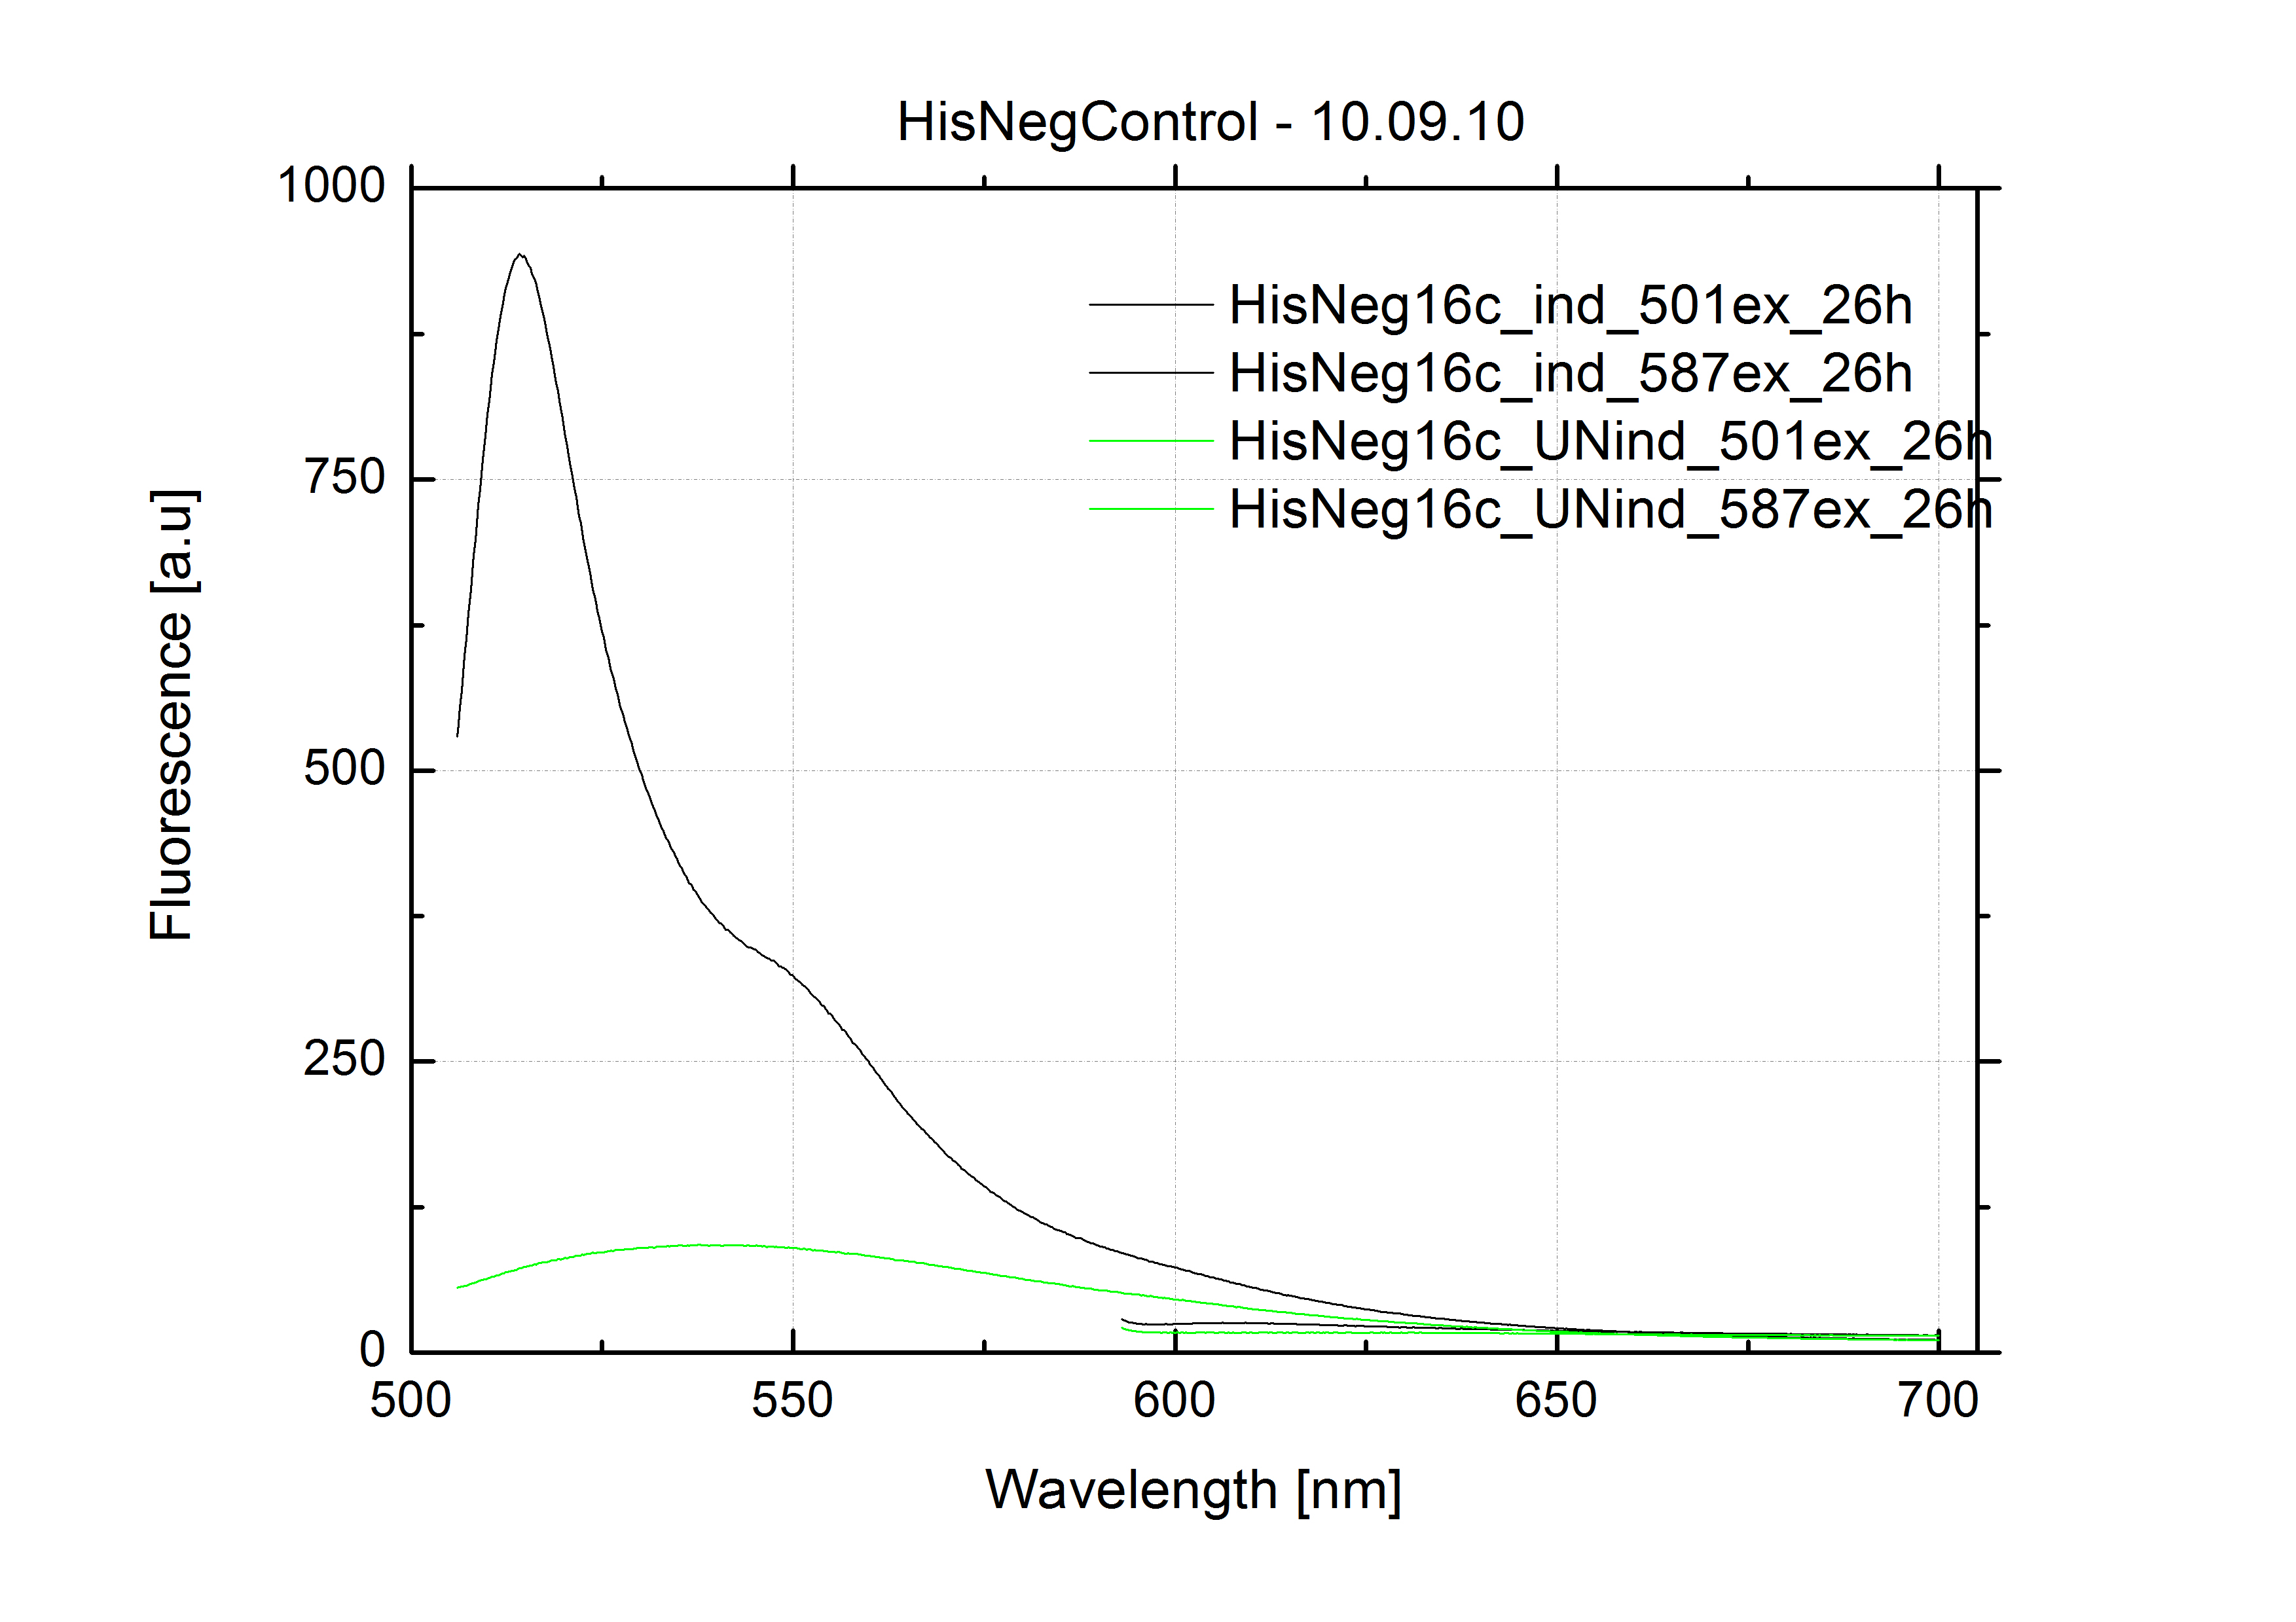
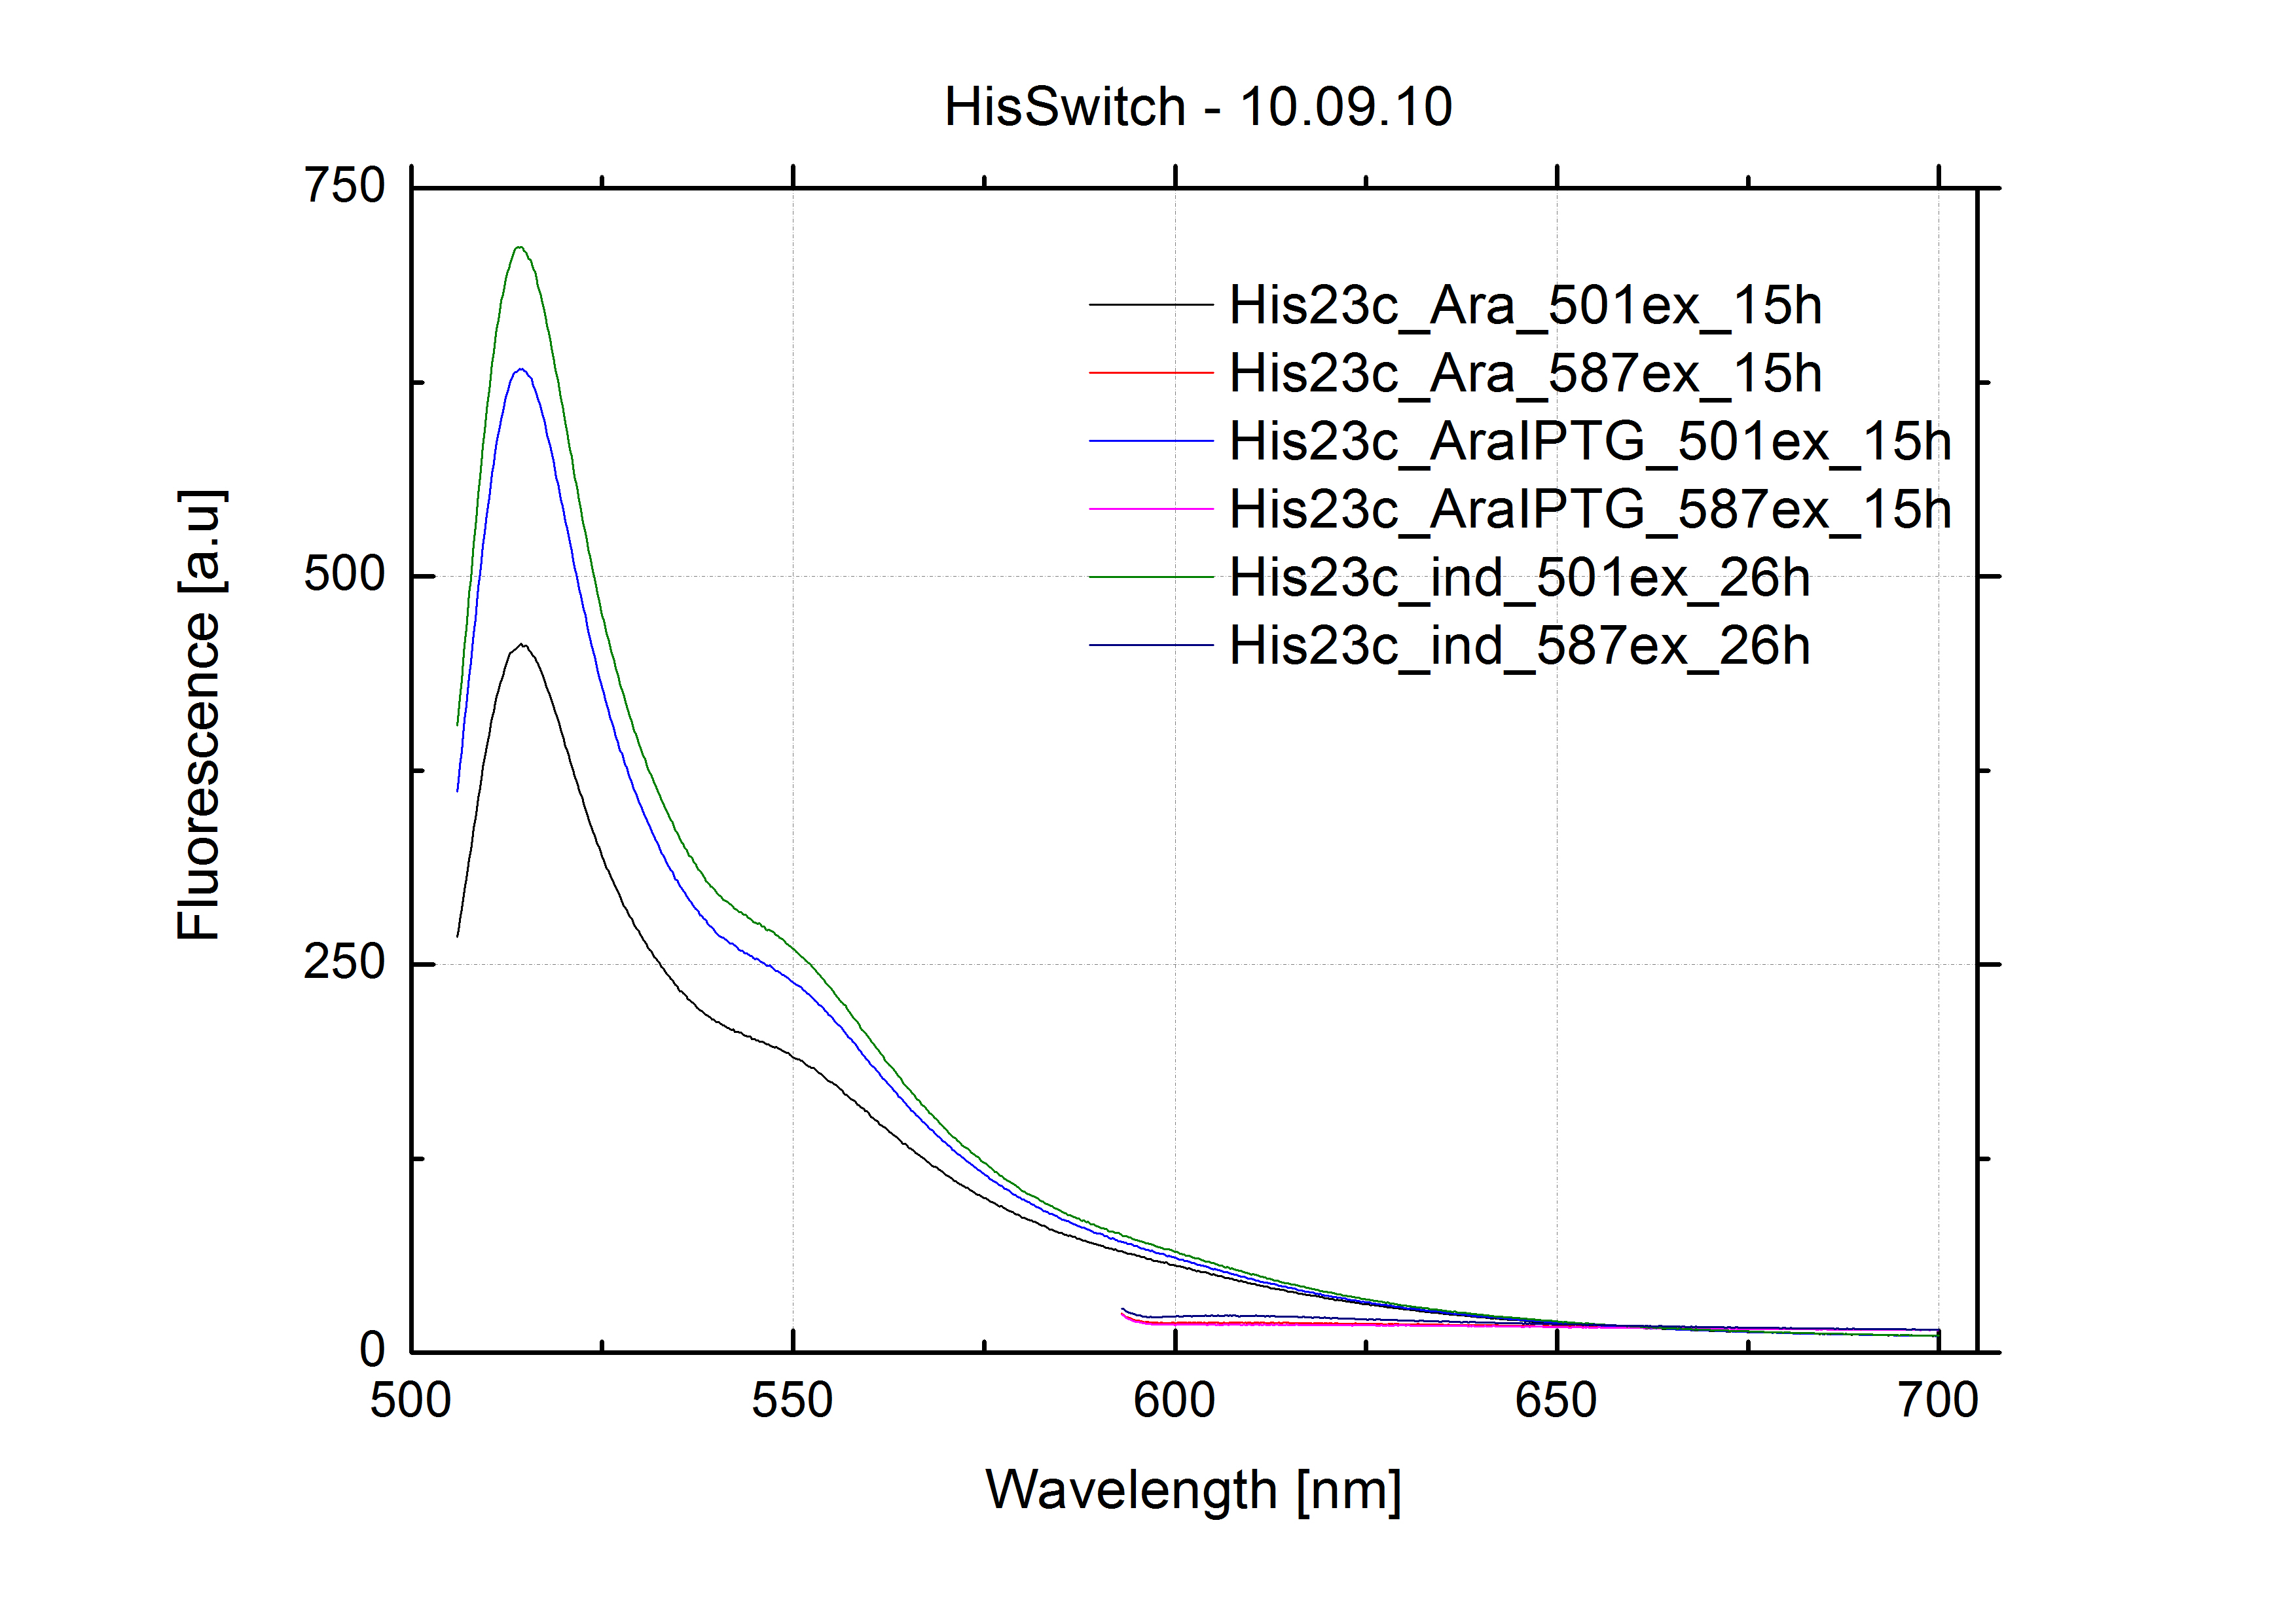

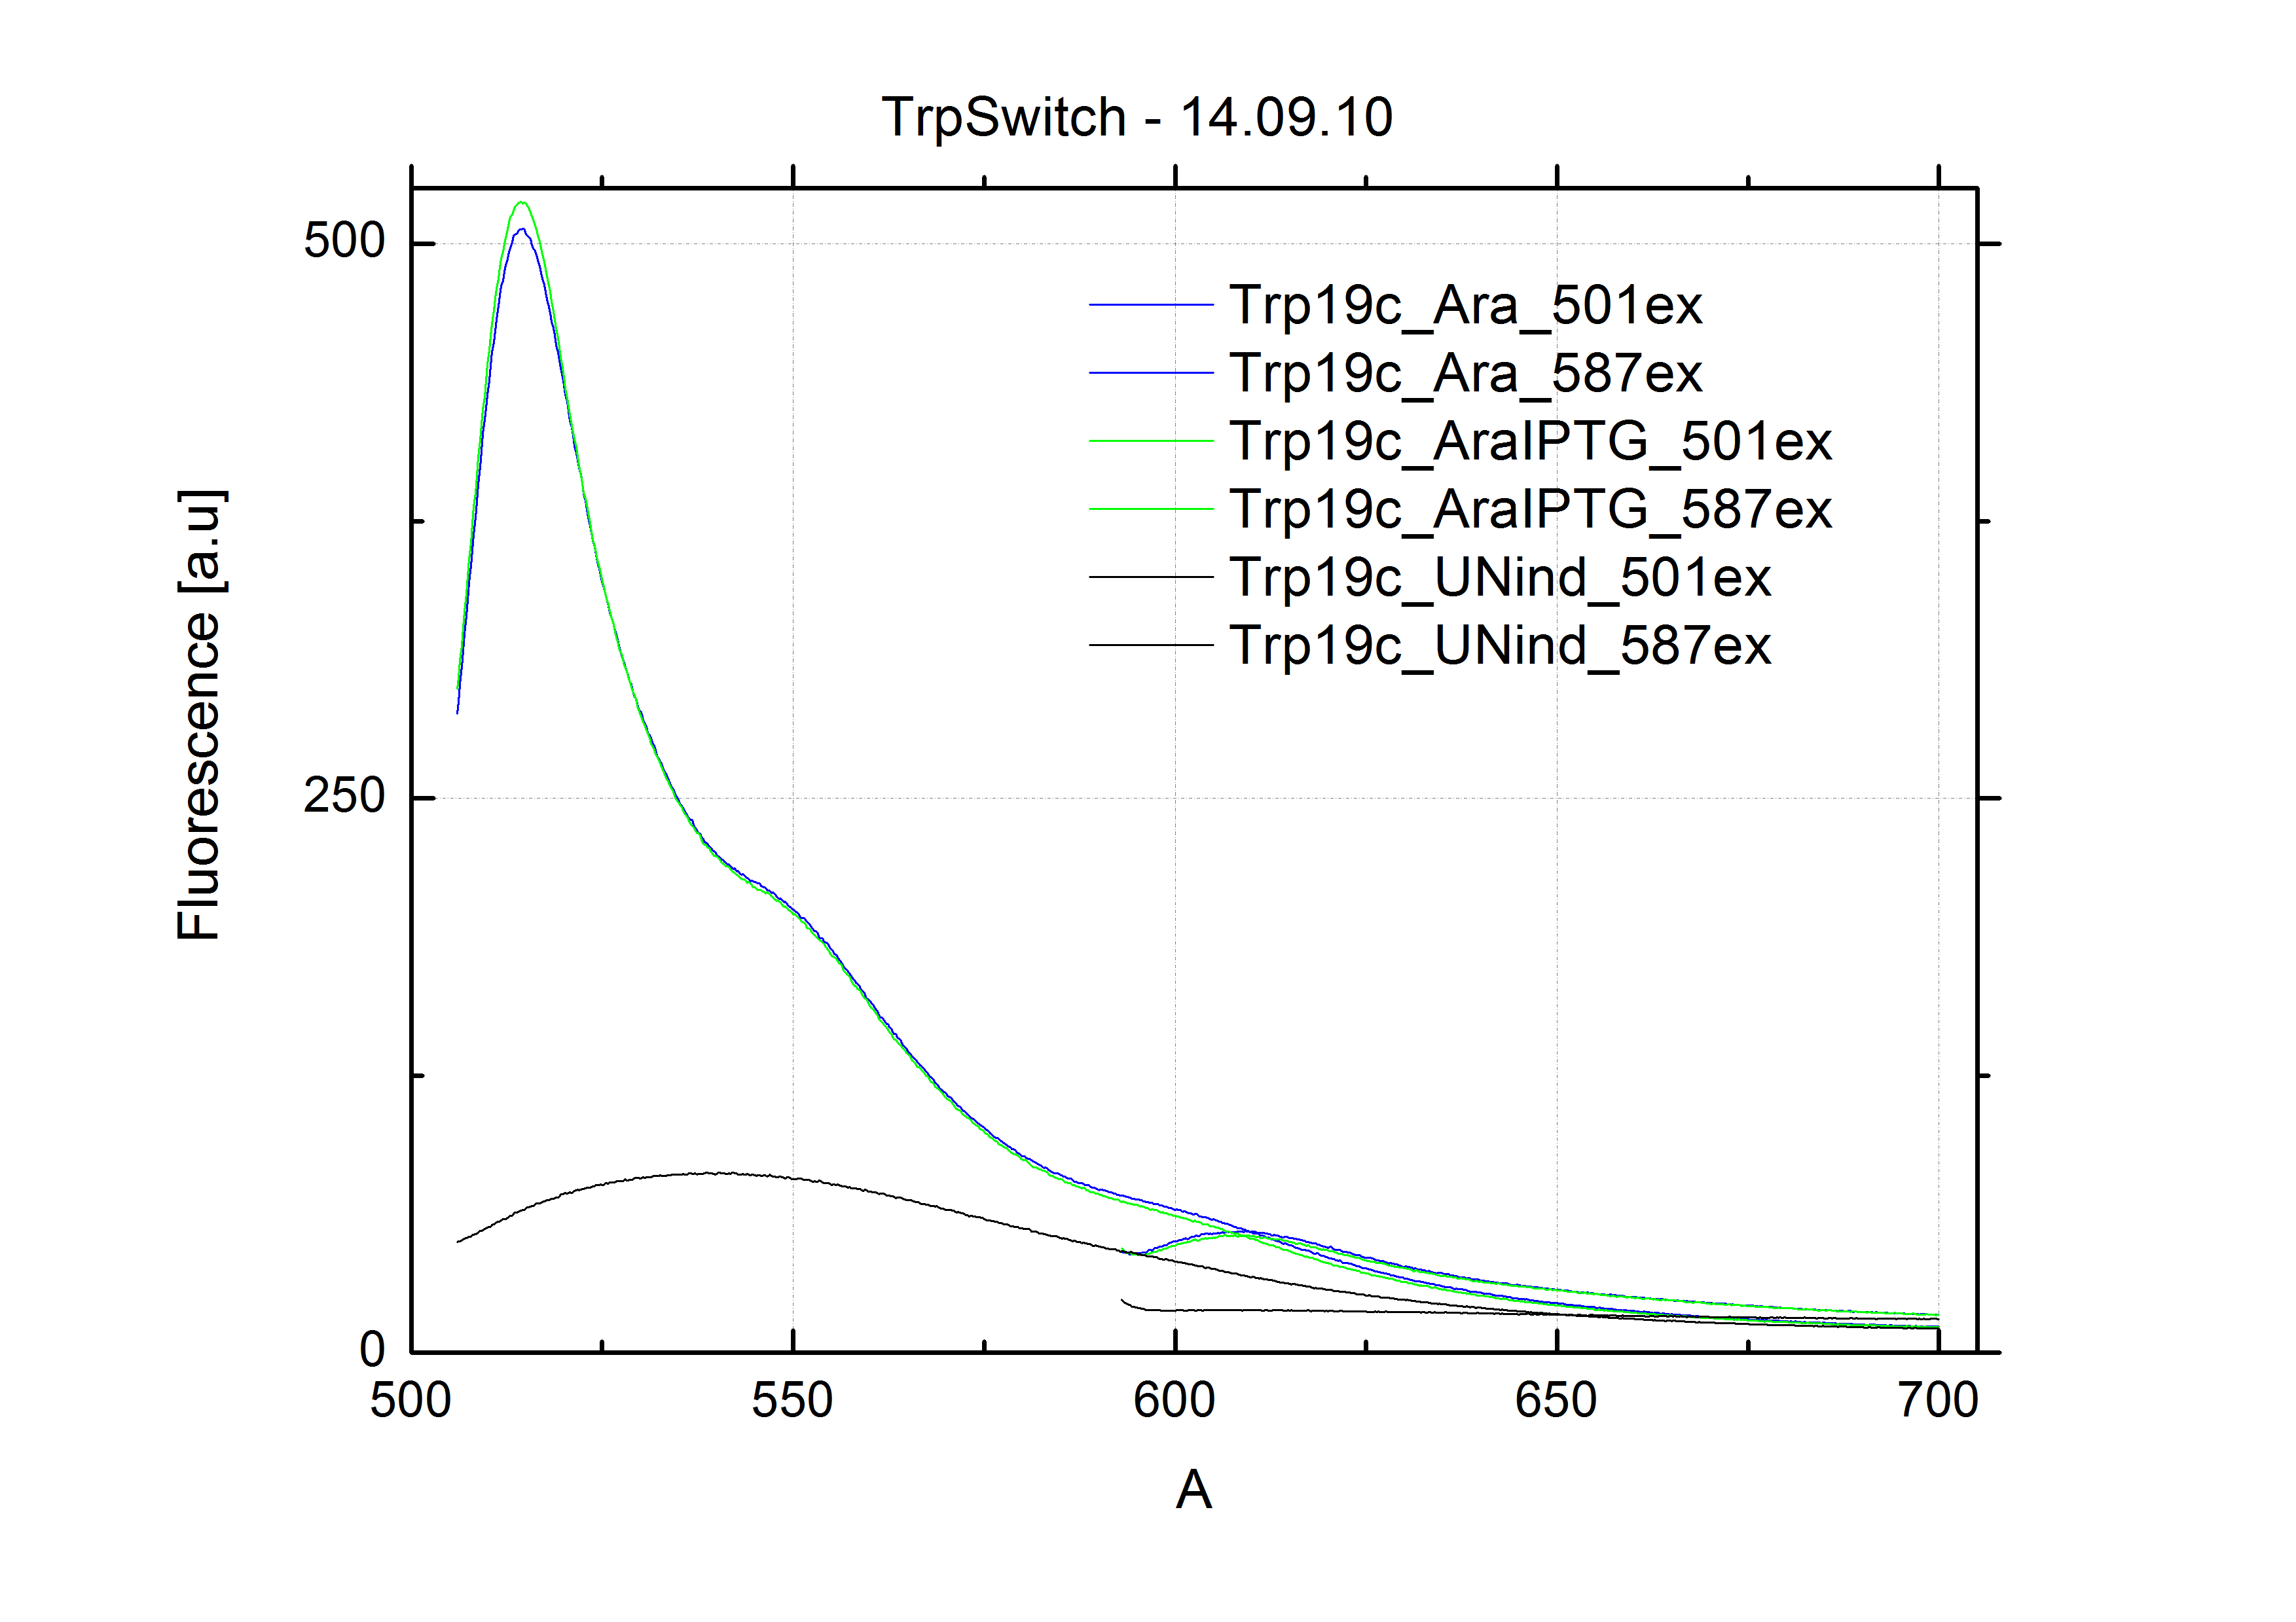
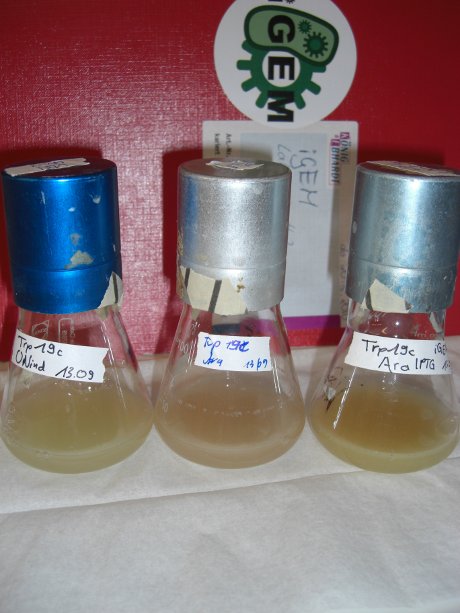
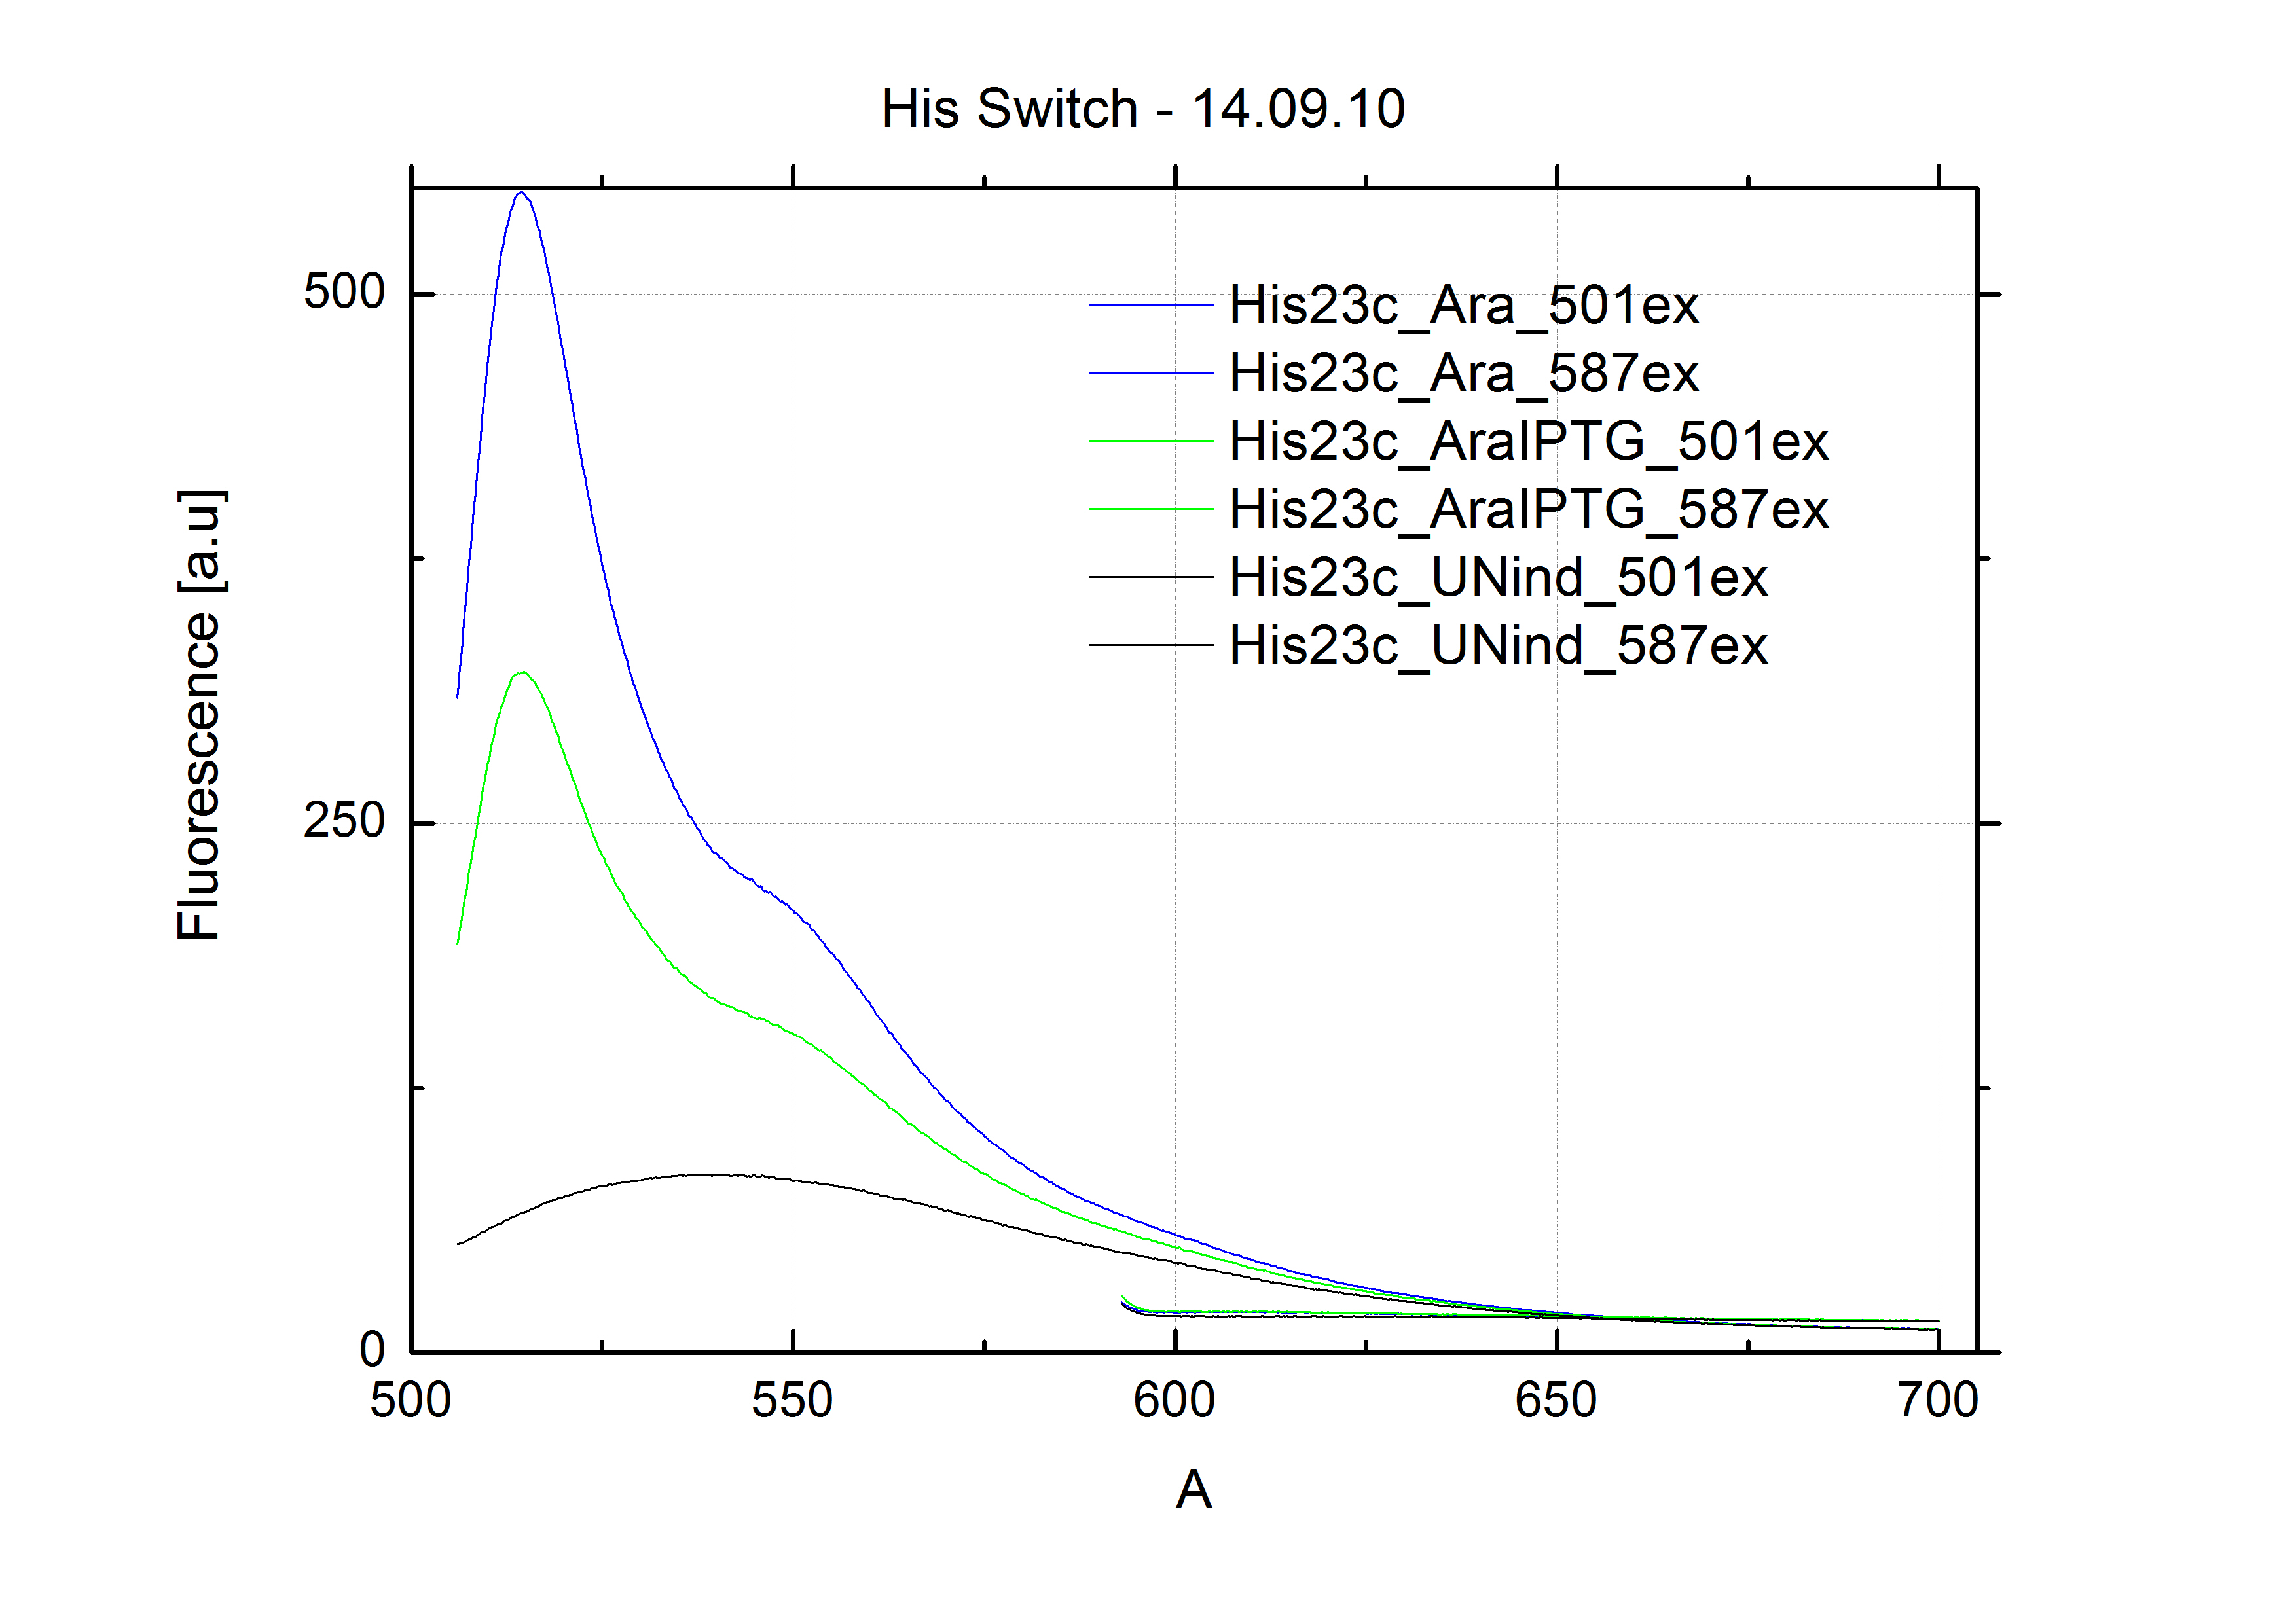
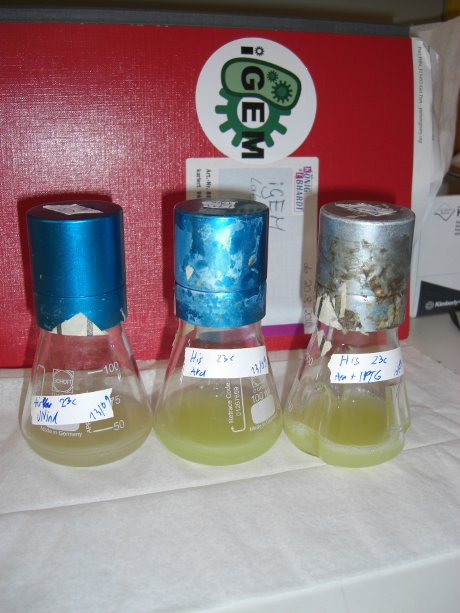
His-Switch DOES NOT seem to work!!! Measurements of Trp-Switch look weird, since Ara-induced culture showed strong mCherry signal than Ara+IPTG-induced culture. Maybe growing condition were not sufficient. We will use 50ml flask next time!
Close
Week25
Cloning HisTerm/TrpTerm Ordering Aptamer New Measurement Plasmid
Week26
Cloning of Malachit green constructs HisTerm/TrpTerm
20.09.2010
- PCR Purification using Qiagen MinElute Kit
- Trp-Signal
- His-Signal
- Trp-Switch
- His-Switch
- Digestions 37°C, 2h
- Trp-Signal XbaI/PstI
- His-Signal XbaI/PstI
- Trp-Switch EcoRI/PstI
- His-Switch EcoRI/PstI
- --> Heat inactivation 20min, 80°C
- Ligation
- pSB1A2_R0011 SpeI/PstI + Trp-Signal XbaI/PstI
- pSB1A2_R0011 SpeI/PstI + His-Signal XbaI/PstI
- pMalachit EcoRI/PstI + Trp-Switch EcoRI/PstI
- pMalachit EcoRI/PstI + His-Switch EcoRI/PstI
- pMalachit XbaI/SpeI
- Transformation of DH5a cells with ligation
21.09.2010
- Picked 2 colonies per plate of yesterday's transformation => we call them z-Series
- ColonyPCR of z-Series
- analytical agarose gel (2.5%)
- => ColonyPCR did not work. Probably not enough template.
- Picked futher colonies
- 2nd ColonyPCR of z-Series
22.09.2010
- analytical agarose gel (2.5%) of 2nd colonyPCR of z-Series
- pSB1A2-R0011-TrpSignal looks good. We removed all pSB1A2-R0011-HisSignal samples since there is a contamination on the gel and colonies turned redish. No conclusion regarding the other ligations of z_series can be drawn. LB control produces similar bands as to what we expected => Choose new Primers for PCR.
- 3rd colonyPCR of z-Series (samples 1-16z)
- used Primers Apt_For and Apt_Part_woT instead of BioBrick Primers (G1005 and G1004). Bands should be about 100bp longer.
- analytical agarose gel (2%)
23.09.2010
- PCR to obtain DNA for malachite green in vitro measurements
- 2z (XbaI/SpeI religated positive control)
- 16z (pMalachitApt_HisSig positive control)
- each samples was amplificated with two sets of primers (including and excluding the terminator BB0014):
- Apt_For and AptFull_wT_Rev
- Apt_For and AptPart_woT_Rev
- Purified with Qiagen MinElute Kit
- analytical digestion of z-series ligation:
- 2z (XbaI/SpeI religated positive control)
- 5z (pMalachitApt_TrpTerm)
- 12z (pMalachitApt_HisTerm)
- 16z (pMalachitApt_HisSig positive control)
- 28z (pSB1A2_R0011_TrpSig)
- NsiI only (HisTerm contains one cutting site for NsiI, so does pMalachiteApt => we expect 2 fragments):
- 12z (pMalachitApt_HisTerm)
- 10µl ligations using digested samples from 21.09.2010
- pSB1A2_R0011 (SpeI/PstI cut) + HisSig (XbaI/PstI cut)
- pMalachiteApt (EcoRI/PstI cut) + TrpSwitch (EcoRI/PstI cut)
- pMalachiteApt (EcoRI/PstI cut) + HisSwitch (EcoRI/PstI cut)
- Transformed DH5a cell with 8µl of the above ligation samples
24.09.2010
- Fluorescence measurement: Malachit Green Assay
- 2z positive control (X/S religated: tac_MalachitApt) (PCR-amplified without BB0014 Terminator)
- 2z positive control (X/S religated: tac_MalachitApt_BB0014) (PCR-amplified with BB0014 Terminator)
- negative control (tac_BB1006Switch_MalachitApt_BB0014) (PCR-amplified with BB0014 Terminator)
- tac_BB1006Switch_MalachitApt + tac_BB1006Signal (both PCR-amplified without BB0014 Terminator)
- 2µl sigma70 satured RNA E.Coli Polymerase (epicenter Biozyme) (2U)
- ca. 1µg DNA template
- 5µM Malachite Green
- 10µM DTT
- 4µM NTPs
- 40mM Tris-HCl pH = 7.1 @ 37°C; 7.5 @ 22°C
- 10mM MgCl2
- 150mM KCl
- added H20 to total volume of 100µl
- Kinetics measurement @ 37°C
- Excitation 630nm
- Emission 655nm

-
- no apatmer formation observed => positive controls did not work at all => assay did not work!!
-
- Exitation: 630nm
- Results:
- no detactable peaks between 640nm and 800nm in any sample at any measured time (Settings were checked by detecting scattering peaks).
Close
Week27
T7 Switch
27.09.2010
- Fluoresence measurements
- Cary Spectrometer
- samples:
- with T7 RNA Polymerase (NEB)
- T7 positive control (T7Promotor_MalachitAptamer)
- with Epicenter E coli RNA Polymerase
- 2z positive control (X/S religated: tac_MalachitApt) (PCR-amplified without BB0014 Terminator)
- 2z positive control (X/S religated: tac_MalachitApt_BB0014) (PCR-amplified with BB0014 Terminator) (NO KINETICS RECORDED)
- with in vitro kit (cell lysate)
- 2z positive control (X/S religated: tac_MalachitApt) (PCR-amplified without BB0014 Terminator)
- 2z positive control (X/S religated: tac_MalachitApt_BB0014) (PCR-amplified with BB0014 Terminator)
- Scanning measurements: excitation at 630nm
- Kinetics measurements: excitation at 630nm; Emission at 655nm
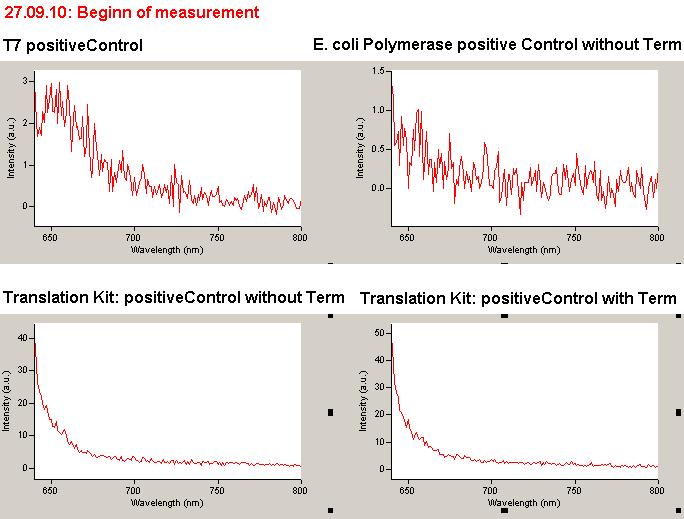
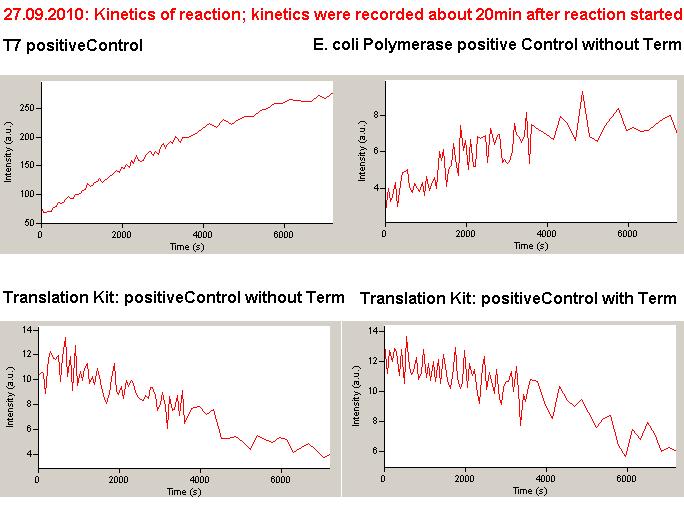
Results:
T7 Polymerase works perfectly. E coli Polymerase also produced RNA but much less (however enzyme might show reduced activity due to storage problems). In vitro (Cell lysate) kits do not work at all.
01.10.2010
T7-Measurments
- PCR of switch_phi_T7-construct to obtain dsDNA (conditions: igemPCR and 30s elongation time). Samples were purified using Qiagen MinElute.
- 1th measurment:
Maxi´s NEB buffer conditions: 40mM Tris pH 7.4 @ RT, 40mM Mg2Cl, 5 µM Malachit-green, 4 mM NTPs, 2,5U RNA-Polymerase
All DNA templates were all added to a final concentration of 200nM.
- sample 1: Positive control
- sample 2: negative control (= switch without any signal) (new DTT used for this sample)
- sample 3: switch + SigA1a
- sample 4: switch + SigA1c
- Results
- kinetic results
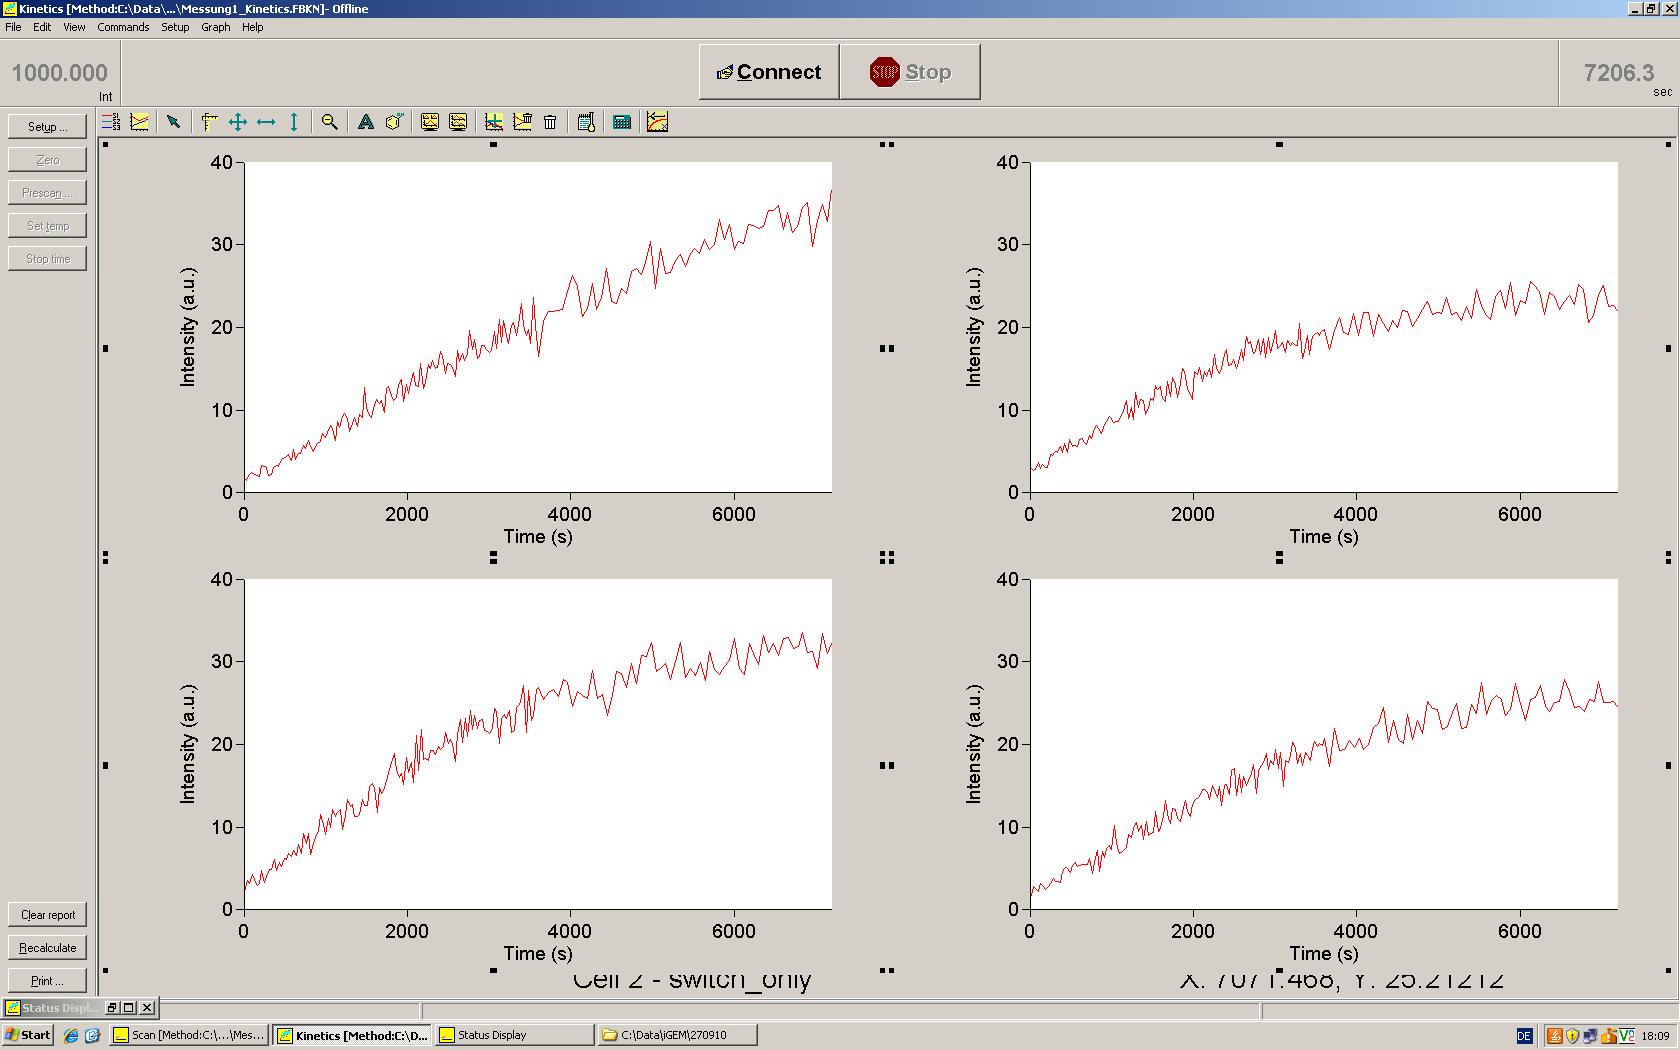
- Spectra
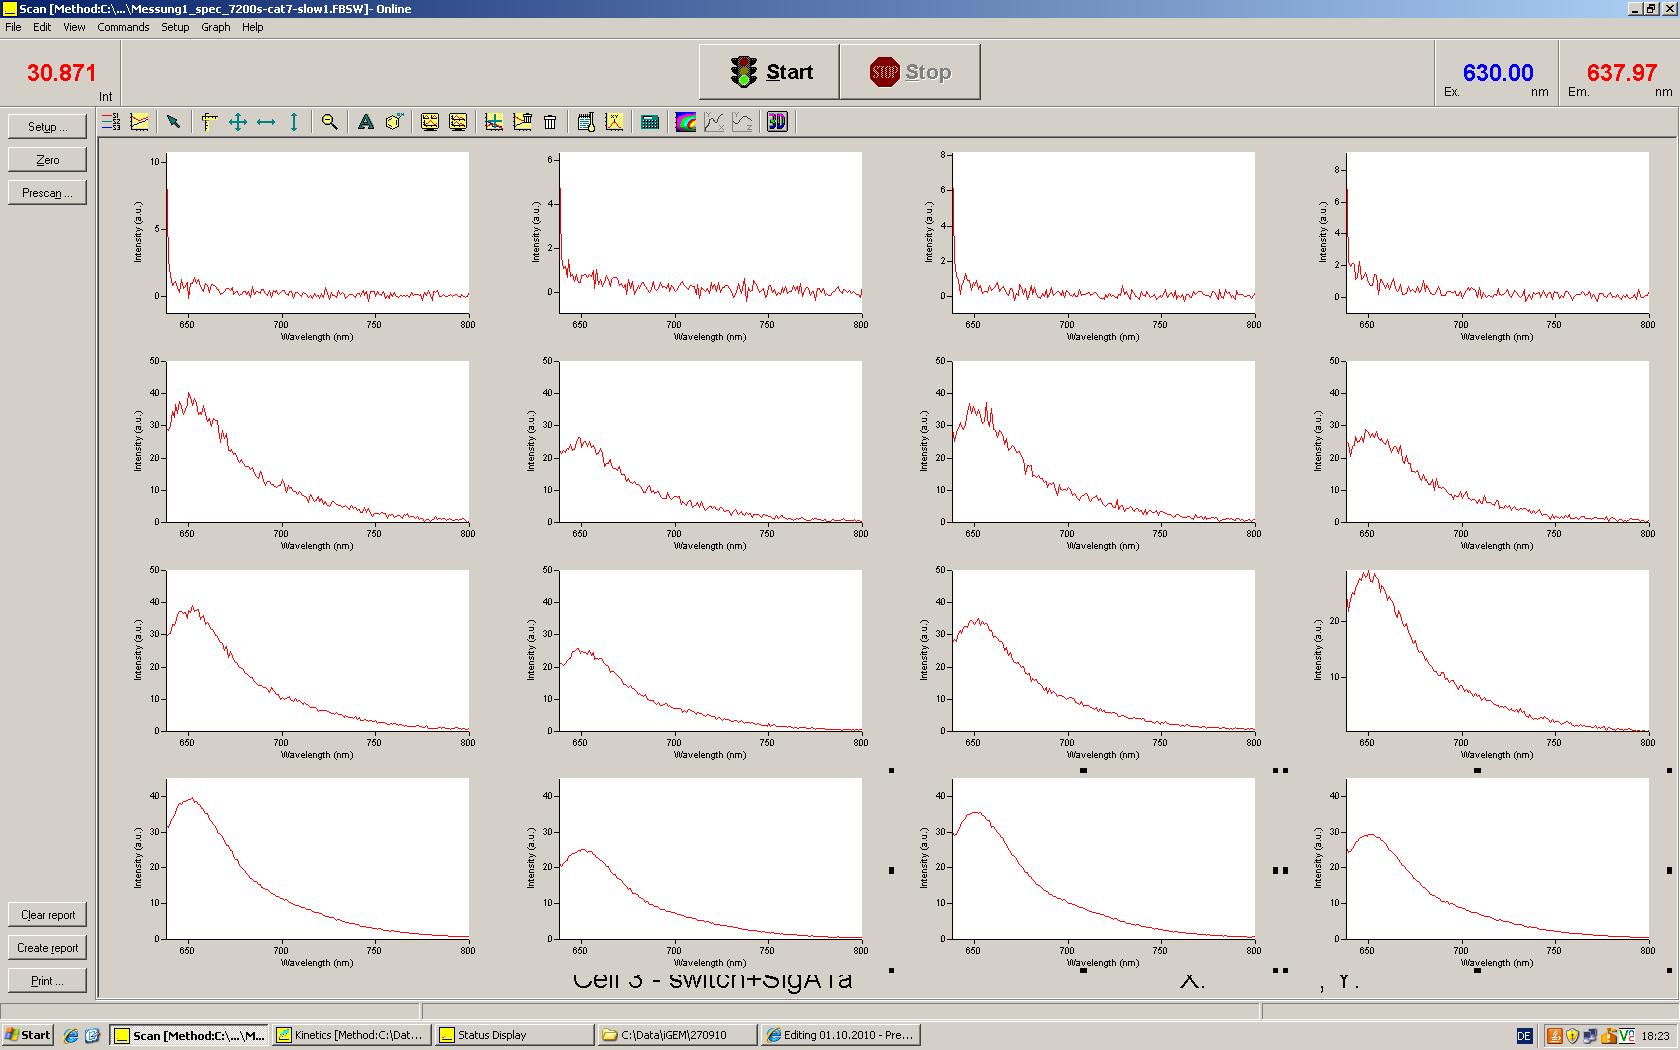
=> Switches do look quite good. However DTT was not the same in all samples.
- 2th measurment:
- "Paper´s" buffer conditions: 40mM Tris pH 7.9 @ RT, 6mM Mg2Cl, 5 µM Malachit-green, 100 mM KCl, 0.8 mM NTPs, 2,5U RNA-Polymerase
- sample 1: Positive control
- sample 2: negative control (= switch without signal)
- Maxi´s NEB buffer conditions: 40mM Tris, 40mM Mg2Cl, 10 µM Malachit-green, ph 7.4 @ RT
- sample 3: Positive control (new DTT used for this sample)
- sample 4: Negative control (= switch without signal)
Close
Week28
T7 Switch
04.10.2010
- 1st fluorescence measurement
-
- 200 nM T7-Switch (100 nM each strand) + SignalA_1a
- 200 nM T7-Switch (100 nM each strand) + SignalA_2a
- 200 nM T7-Switch (100 nM each strand) + SignalA_2b
- 200 nM T7-Switch (100 nM each strand) + SignalA_2c
- 40 mM Tris pH 7.1
- 40 mM MgCl2
- 10 mM DTT
- 1.6 mM NTPs
- 5 µM Malachite green
- 2.5 U T7 RNA Polymerase
- Fluorescence increased in all samples in a very similar way, suggesting all signal to work equally well.
- 2nd fluorescence measurement
-
- 200 nM T7-Switch only (Buffer A)
- 200 nM T7-Switch only (Buffer B)
- positiv control (T7Promoter_MalchitAptamer) (Buffer A)
- positiv control (T7Promoter_MalchitAptamer) (Buffer B)
- 40 mM Tris pH 7.1 @ RT
- 40 mM MgCl2
- 10 mM DTT
- 1.6 mM NTPs
- 10 µM Malachite green
- 2.5 U T7 RNA Polymerase
- 40 mM Tris pH 7.9 @ RT
- 6 mM MgCl2
- 100 mM KCl
- 10 mM DTT
- 1.6 mM NTPs
- 10 µM Malachite green
- 2.5 U T7 RNA Polymerase
- Very strange results!! Both negative controls increased strongly compared to the positive controls that only slightly increased (buffer A seems to be better for transcription than buffer B).
- => Maybe something went very wrong. However, last Friday we observed a similar, strange behavior. Maybe the positive control is no good choice. It would make sence to use T7-Switch+SignalA_1a as a reference.
- Signals were generally stronger. 10 µM of malachite green seems to be quite good.
Close
Week29
T7 Switch
11.10.2010
- PCR T7 switch
- 32 x Mastermix: 1600 µl total volume
- 32 µl dNTPs
- 32 µl T7 forward primer
- 32 µl T7 reverser primer
- 160 µl 10x buffer
- 96 µl MgCl2
- 6.4 µl Taq Polymerase
- 10 µl Template (some older PCR)
- 1209.6 µl H2O
- Standart iGEM PCR program:
- 95°C, 2'
- 1) 95°C, 0,5'
- 2) 58°C, 0.5'
- 3) 71°C, 1'
- 71°C, 7'
- repeat 1)-3) 35 times
- yield after purification: 80 µl, 1.14 µM
- Malchitegreen measurement
- for 4.1 x 100 µl
- 35.88 µl PCR product
- 20.05 dNTPs
- 41 µl DTT
- 10.25 µl T7 RPO
- 8.75 µl switch
- 2 µl signal per 100 µl
- measured signals: (1) nonsense, (2) 1a, (3) 1b, (4) 2a
- Voltage set to 1000 (maximum)
- 38°C, every 15 s measurement
- start at 5 au, end at 25 au
- rise visible over time in all samples, nonsense signal with the fastest rise, 1a similiar, end signal similiar in all measurements
12.10.2010
- PCR T7 switch
- 32 x Mastermix: 1600 µl total volume
- 32 µl dNTPs
- 32 µl T7 forward primer
- 32 µl T7 reverser primer
- 160 µl 10x buffer
- 96 µl MgCl2
- 6.4 µl Taq Polymerase
- 10 µl Template (some older PCR)
- 1209.6 µl H2O
- changed iGEM PCR program:
- 95°C, 2'
- 1) 95°C, 0,5'
- 2) 50°C, 0.5'
- 3) 71°C, 1'
- 71°C, 10'
- repeat 1) - 3) 35 times
- --> melting temperature primers: 55/54°C!!!
- yield after purification: 300 ng/µl in 60 µl, 3.66 µM
- Malachitegreen measurement with preincubation of transcription stuff with signals
- for 4.1 x 100 µl
- 35.88 µl PCR product
- 20.05 dNTPs
- 41 µl DTT
- 10.25 µl T7 RPO
- 2 µl signal per 100 µl
- preincubation of signal with RPO for one hour, 37°C
- addition of signal after one hour (2.735 µl)
- once done in eppis (low bind), once in cuvettes
- no rise in both
- incubation and measurement of cuvette-incubated mix over night: no rise visible
- 15 % denaturing acrylamide gels
- for 50 ml
- 15 % acrylamide: 18.75 ml 40 % acrylamide
- 6M urea: 18 g
- 1x TBE: 5 ml 10x TBE
- 500 µl APS
- 50 µl TEMED
- H20 till 50 ml
- only 30 ml needed for two gels
- big combs for a lot of sample :)
- glass plates cleaned with RNAseZip before pouring the gel
13.10.2010
- in vitro T7 transcription, check by polyacrylamide gel electrophoresis
- 10 ml 5 x paper buffer
- 200 mM Tris/HCl, pH=7.85: 2 ml 1M Tris/HCl, pH=7.85
- 30 mM MgCl2: 600 µl 0.5 M MgCl2
- 500 mM KCl: 5 ml 1 M KCl
- 2.4 ml H2O
- for in vitro transcription
- 0.5 µl T7 RPO: 25 U
- 0.5 µl rNTPs : 20 mM
- 1.36 µl switch: 250 µM
- 1 µl signal: 250 µM
- 2 µl DTT: 10 µM
- 0.2 µl RNase inhibitor
- 4 µl 5x buffer
- 10.44 µl H2O
- 5.1 times
- no signal, nonsense, 1a, 1c, 2a
- in low bind tubes
- 2 hour, 37°C
- actually 2 hours and half a hour pocket cleaning time
- for PAGE:
- don't try to run yourgel in the pouring device - if you do so: feel very stupid and embarrassed (I guess I've ran over 100 gels in my life yet... still too stupid...)
- don't feel tempted to use the Dietz' group's 0.5 x TBE buffer - if you do so: feel very stupid and embarassed, discard buffer carefully and use 1 x TBE
- don't use a comb which is thinner than your spacers - if you do so: scrap gel pieces out of the pockets for half an hour
- cook your sample for 5 minutes, 95°C - if you do not so, feel stupid, embarassed and hope that it won't matter so much
- I did not cool the samples
- gel runs at 100 V (~ 10V/cm)
- 20 µl sample + 20 µl ambion loading buffer (1-2 x loading buffer - who does that?) --> 40 µl fits nicely
- 2 µl low molecular weight marker + 20 µl loading buffer + 18 µ H2O
- in 1 x TBE
- M, control (same amounts switch and signals as in the samples), no signal, random, 1a, 2a, 1c, random overnight, 1a overnight, 1c overnight
- overnight samples: measurement with malachitegreen sample over night: no rise visible
- Xylene Cyanol: Comigrating with 60, Bromphenol BLue: comigrating with 15 (http://www.protocol-online.org/cgi-bin/prot/view_cache.cgi?ID=845) - Maxi: bei Hälfte ungefähr
- run for 1:45 hours, Bromphenoleblue at about half of the gel
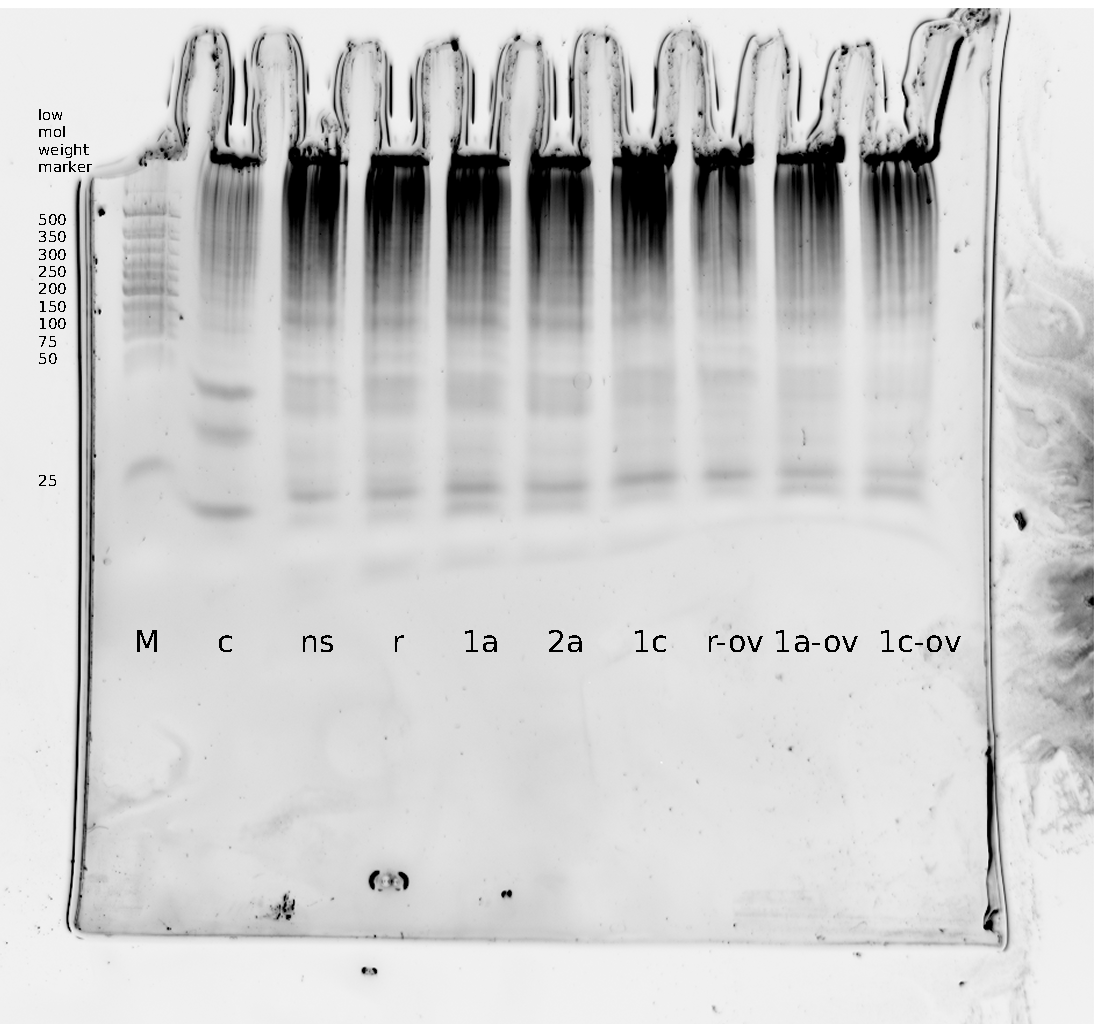
- --> c=control, ns=no signal, r=random
- --> weird smear everywhere: degraded RNA?
- --> no switch visible on the gel: 133 bp!
- --> signal length: 29-43 bp visible
- --> 25 bp: signal sense, between 50-25 bp: signals: 1a and 1c with approximately the same length, 2a is longer
- --> Wie Sie sehen, sehen Sie nichts.
- PCR of switch: Biomers original used as template
- PCR T7 switch
- 32 x Mastermix: 1600 µl total volume
- 32 µl dNTPs
- 32 µl T7 forward primer
- 32 µl T7 reverser primer
- 160 µl 10x buffer
- 96 µl MgCl2
- 6.4 µl Taq Polymerase
- 5 µl Template (some older PCR)
- 1214.6 µl H2O
- changed iGEM PCR program:
- 95°C, 2'
- 1) 95°C, 0,5'
- 2) 50°C, 0.5'
- 3) 71°C, 1'
- 71°C, 10'
- repeat 1) - 3) 35 times
14.10.2010
- yesterday's measurement
- rise visible, comparable to tuesday measurement
- samples frozen, put on 15 % PAGE
- purification of yesterday's PCR
- in vitro T7 transcription, check by polyacrylamide gel electrophoresis
- 10 ml 5 x paper buffer
- 200 mM Tris/HCl, pH=7.85: 2 ml 1M Tris/HCl, pH=7.85
- 30 mM MgCl2: 600 µl 0.5 M MgCl2
- 500 mM KCl: 5 ml 1 M KCl
- 2.4 ml H2O
- for in vitro transcription
- 0.5 µl T7 RPO: 25 U
- 0.5 µl rNTPs : 20 mM
- 1.36 µl switch: 250 µM
- 1 µl signal: 250 µM
- 2 µl DTT: 10 µM
- 0.2 µl RNase inhibitor
- 4 µl 5x buffer
- 10.44 µl H2O
- 5.1 times
- no signal, nonsense, 1a, 1c, 2a
- in low bind tubes
- 2 hour, 37°C
- actually 2 hours and half a hour pocket cleaning time
- 2 % agarose gel to check previous PCR products
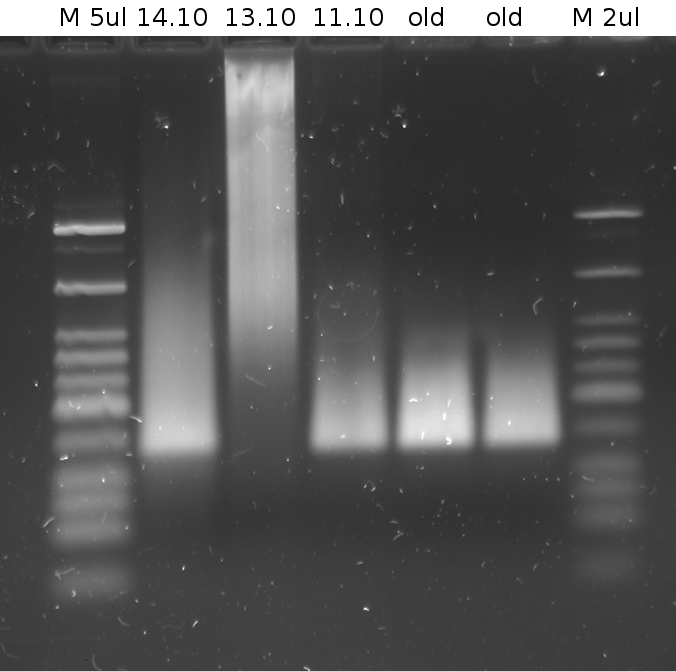
- --> yesterdays results bad because no switch :)
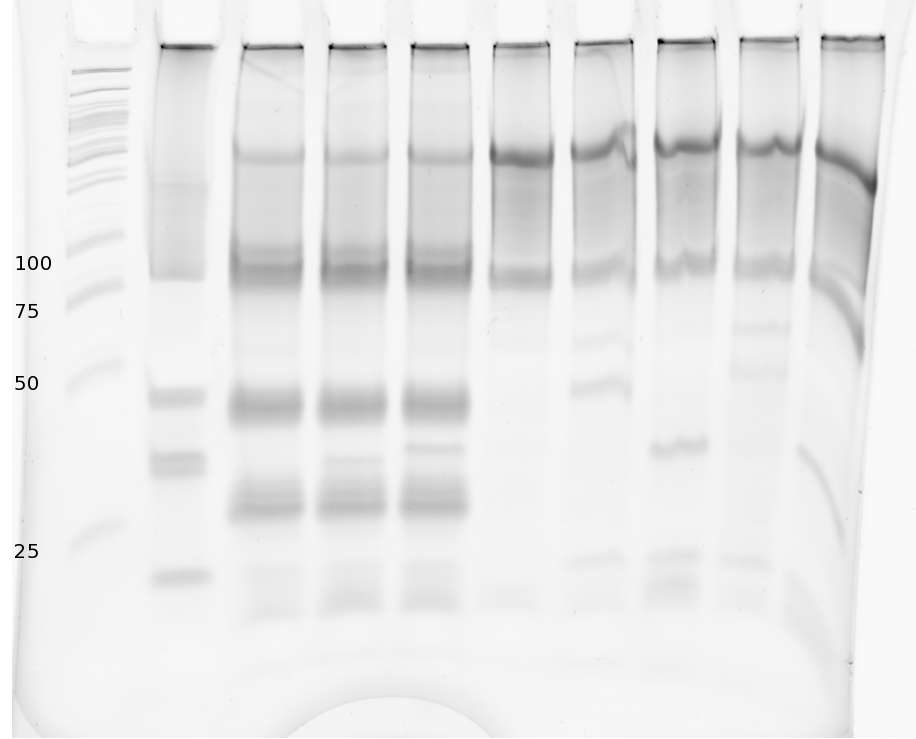
- --> M = low molecular weight marker (NEB)
- --> c=control=all DNAs mixed together in used concentrations: switch and all signals, ns=no signal, r=random=nonsense
- --> r, 1a, 2a on the left: overnight incubation with malchitegreen
- --> r, 1a, 1c, 2a on the right: two hour in vitro transcription without malachitegreen
- --> switch: 133 bp!
- --> signal length: 29-43 bp
- --> T7 promoter sense: ca. 20 bp (I can't look it up right now)
- --> extra bands visible after overnight transcription (rise in malchitegreen fluorescence visible)
- --> switch runs at a strange height: WHY? looks normal on 2 % agarose gel
- --> upper band: RPO bound to DNA? Compare EMSA
- --> DNA ladder, RNA bands: How to compare?
- Okay, let's try to interpret this:
- Denaturing conditions, everything precooked: No guarantee for double stranded DNA/RNA
- control: switch and signals from tubes on gel - otherwise treated the same
- --> internal standart: switch at about 80 bp (low molecular weight standart) equals 133 bp
- --> band seen in all samples at the height of random/1c --> termination product of switch??? (expected size: about 90 bp? does not fit at all?!)
- --> lower band visible, what is it?
- --> What is left: NO Differences Between Random control (=nonsense) and Designed Switches...
- New malachitegreen assay (overnight in vitro transcription) with new PCR product
- for 4.1 x 100 µl
- 35.88 µl PCR product
- 20.05 dNTPs
- 41 µl DTT
- 10.25 µl T7 RPO
- 2 µl signal per 100 µl
- preincubation of signal with RPO at 37°C
- no rise during preincubation (makes sense)
- addition of signal after about one and a half hour
15.10.2010
- in vitro transcription - malachite green
- slight rise visible after overnight incubation after preincubation of signal
- only 1/4 of the intensity measured yesterday
- spectra fit but very weak signal, scattered spectra
- Next step: addition of DNaseI (RNase free) to overnight transcription products
17.10.2010
- Malachite-green measuring assay
- 1x:
- 2 µl signal, 5 µM
- 4.66 µl switch, 176 µM
- 2.5 µl RPO
- 50 µl Paperbuffer
- 10 µl DTT 100 µM
- 5 µl rNTPs
- 25.84 µl H2O
- 4.1 x
- 19.11 µl switch, 176 µM
- 10.25 µl RPO
- 205 µl Paperbuffer
- 41 µl DTT 100 µM
- 20.5 µl rNTPs
- 105.94 µl H2O
- Signals: random, 1a, 2a, 1c
Close
Week30
Cloning of Parts into pSB1C3 T7 & E. coli
18.10.2010
- Yesterday's malachitegreen-binding assay
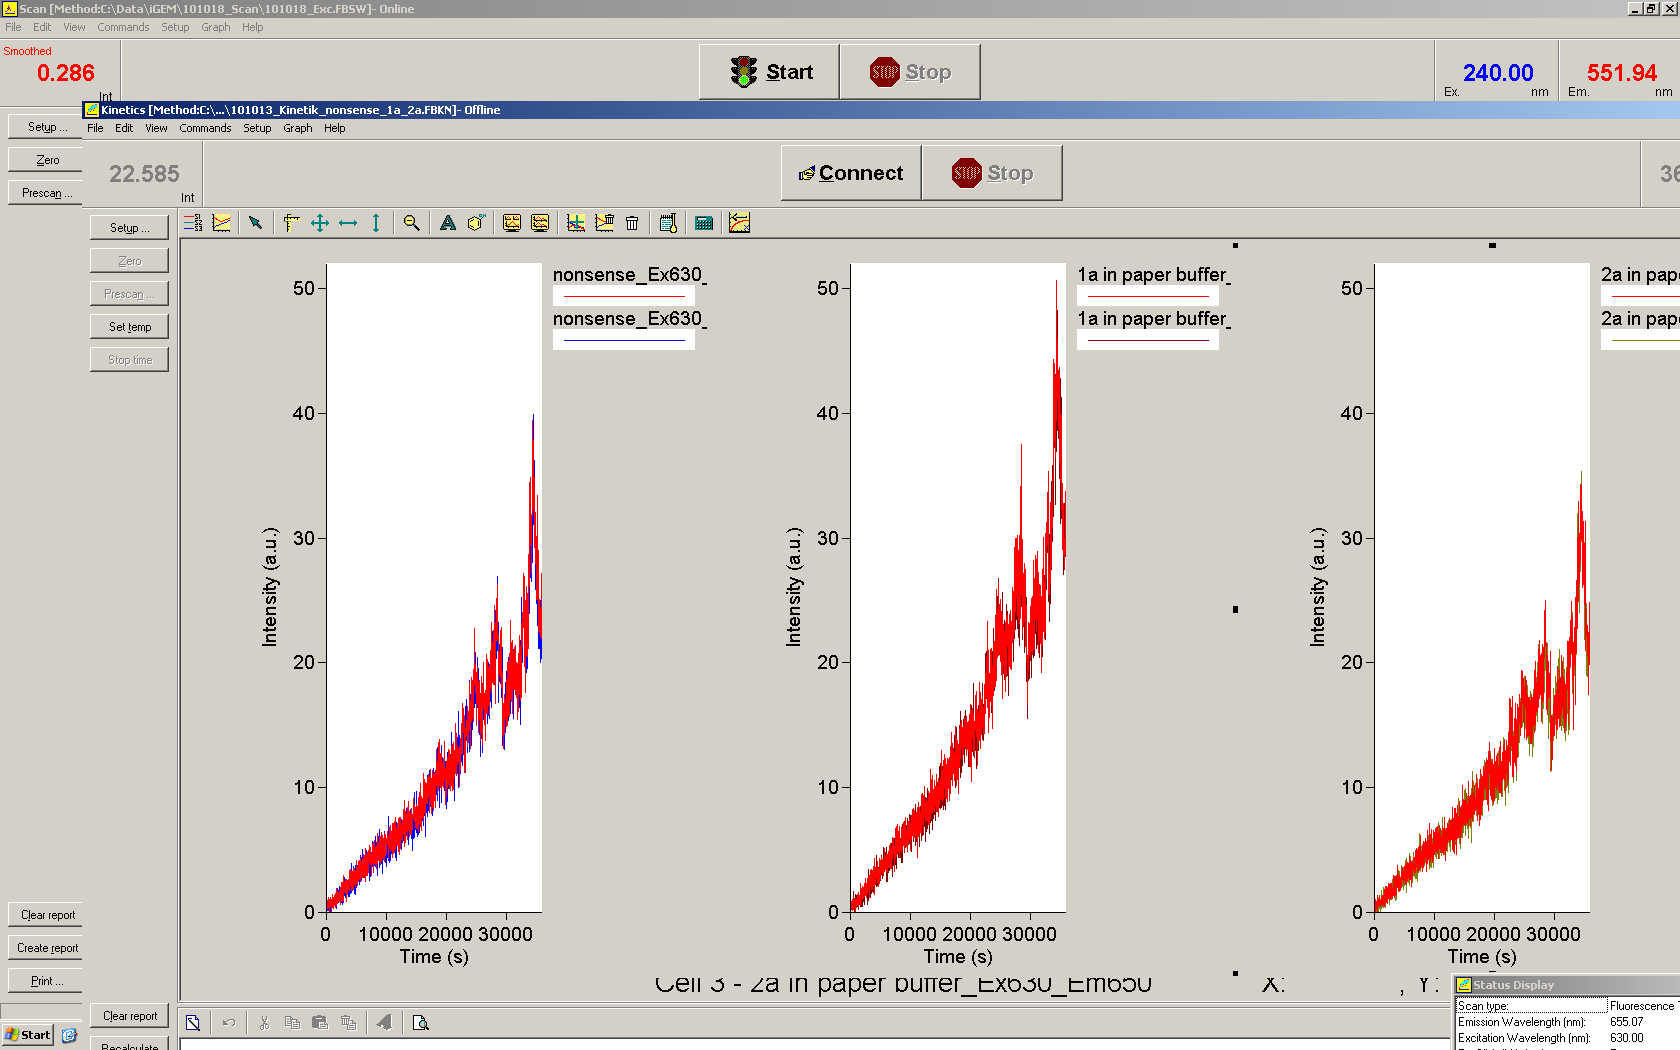
--> Favourite one ever so far!
- Emission and Excitation: Exc=530 nm, Em=552 nm
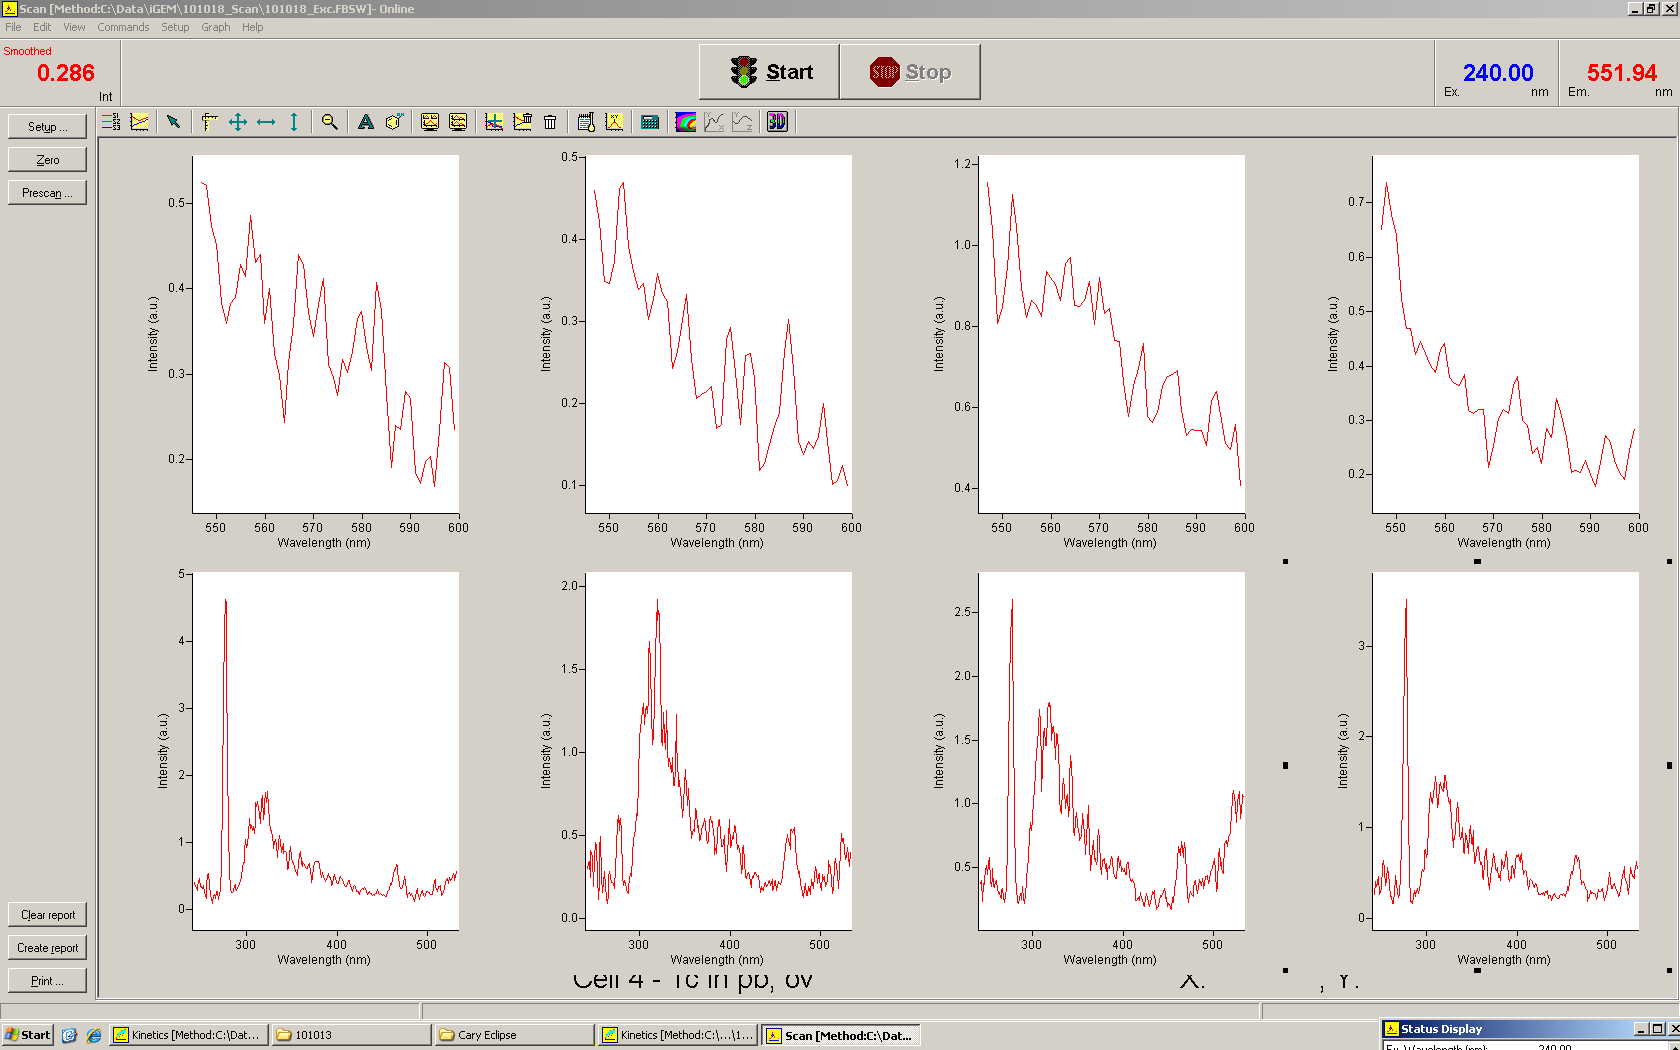
- Biomers order arrived
- DNA resolved according to manual, 100 µM endconcentration
- PCR T7 switch/positive signal
- 32 x Mastermix: 1600 µl total volume
- 32 µl dNTPs
- 32 µl T7 forward primer
- 32 µl T7 reverser primer
- 160 µl 10x buffer
- 96 µl MgCl2
- 6.4 µl Taq Polymerase
- 10 µl Template (some older PCR)
- 1209.6 µl H2O
- changed iGEM PCR program:
- 95°C, 2'
- 1) 95°C, 0,5'
- 2) 50°C, 0.5'
- 3) 71°C, 1'
- 71°C, 10'
- repeat 1) - 3) 35 times
- yields positive control:
- Mr=67234,6 g/mol
- 230 ng/µl --> 3.42 µM
- 198 ng/µl --> 2.94 µM
- 209 ng/µl --> used for cloning
- 178 ng/µl --> 2.65 µM
- yields switch:
- Mr=82059 g/mol
- 170 ng/µl --> 2.07 µM
- 204 ng/µl --> 2.49 µM
- 179 ng/µl --> 2.18 µM
- 160 ng/µl --> 1.95 µM
- 6 M urea 15 % acrylamid PAGE
- DNase I digestion
- 1 µl 10 x DNase buffer
- 1 µl DNaseI
- 20 µl reaction product from malachitegreen assay, 17.10.10
- 37°C, 90 minutes
- Gel:
- 20 µl loading buffer and 20 µl sample
-
- Malachitegreen assay with double stranded signals
- Concentration verification of sense and antisense in ng/µl
- diluted 1:8 (5+35 µl)
- signal - sense ng/µl - antisense ng/µl
- 1a - 1391 - 1584
- 2b - 1812 - 1823
- 1c - 2208 - 1575
- random2=nonsense2 - 2480 - 1903
- Concentration verification of sense and antisense in µM
- signal - sense µM - antisense µM
- 1a - 15.47 - 17.99
- 2b - 15.43 - 15.70
- 1c - 16.95 - 12.31
- r2 - 21.27 - 16.28
- for 10 µM of both sense and antisense and to put it together to equal 5 µM in total...
- signal - sense µl - antisense µl - water µl
- 1a - 32.32 - 27.79 - 38.89
- 2b - 32.40 - 31.85 - 35.75
- 1c - 29.50 - 40.62 - 29.88
- r2 - 23.51 - 30.71 - 45.78
- 2 µl signal, 5 µM, double stranded!
- 4.17 µl switch, 2.49 µM
- 2.5 µl RPO
- 50 µl Paperbuffer
- 10 µl DTT 100 µM
- 5 µl rNTPs
- 26.3 µl H2O
- 3.1 x
- 12.93 µl switch, 176 µM
- 7.75 µl RPO
- 155 µl Paperbuffer
- 31 µl DTT 100 µM
- 15.5 µl rNTPs
- 81.53 µl H2O
- signals: r2, 1a, 1c
- 1x positive control
- 2 µl signal, 5 µM, double stranded!
- 2.94 µl switch, 2.94 µM
- 2.5 µl RPO
- 50 µl Paperbuffer
- 10 µl DTT 100 µM
- 5 µl rNTPs
- 27.57 µl H2O
- signal: r2
- Cloning Malachitegreen-binding aptamer into pB1C3
- E/P digestion
- 2 µl 10x NEB 4
- 2 µl 10x BSA
- 0.5 µl EcoRI
- 0.5 µl PstI
- 15 µl linearized pB1C3 (50 ng/µl)/malachitegreen binding aptamer (203 ng/µl)
- 37°C, 1 h
- purification afterwards using DNA clean and concentrated (or something)
- Concentrations
- backbone: 11 ng/µl
- insert:
- Ligation
- 5 µl digested plasmid
- 2 µl malachitegreen binding aptamer, 1:10 diluted
- 2 µl T4 ligase buffer
- 1 µl T4 ligase
- 10 µl water
- no transformation not possible: no chloramphenicol plates in physic's department...
19.10.2010
- Yesterday's malachitegreen assay
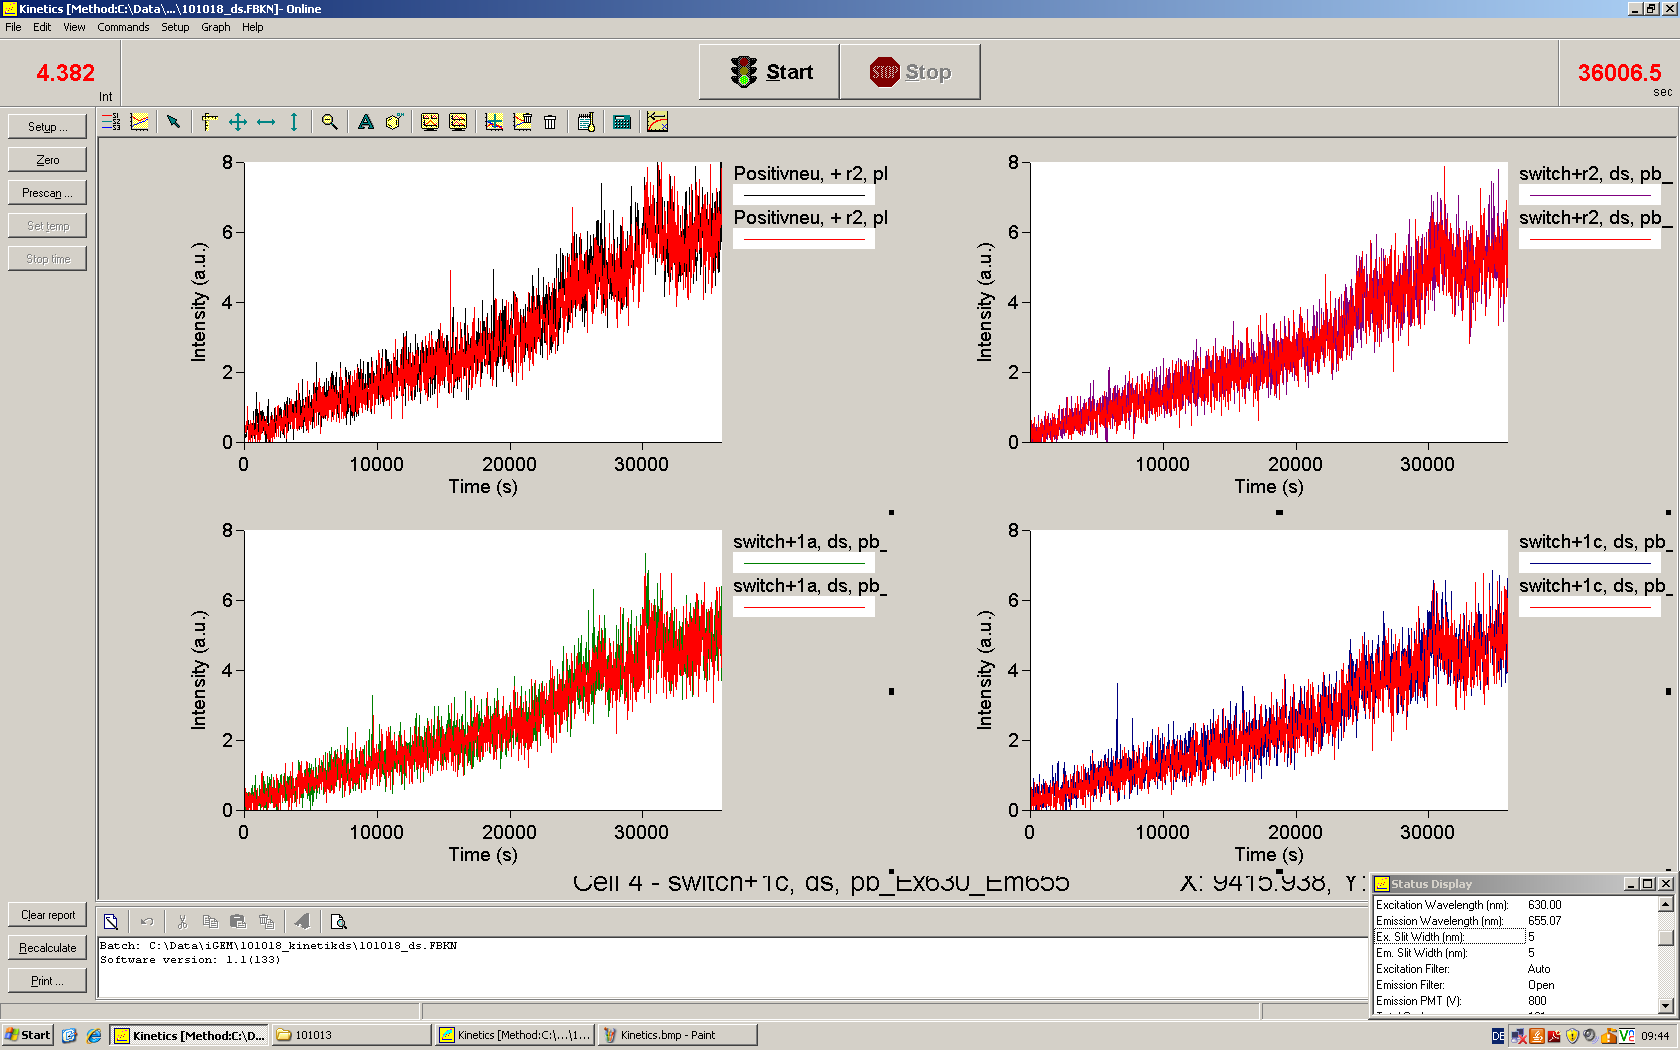
- Emission spectra: Exc=530 nm
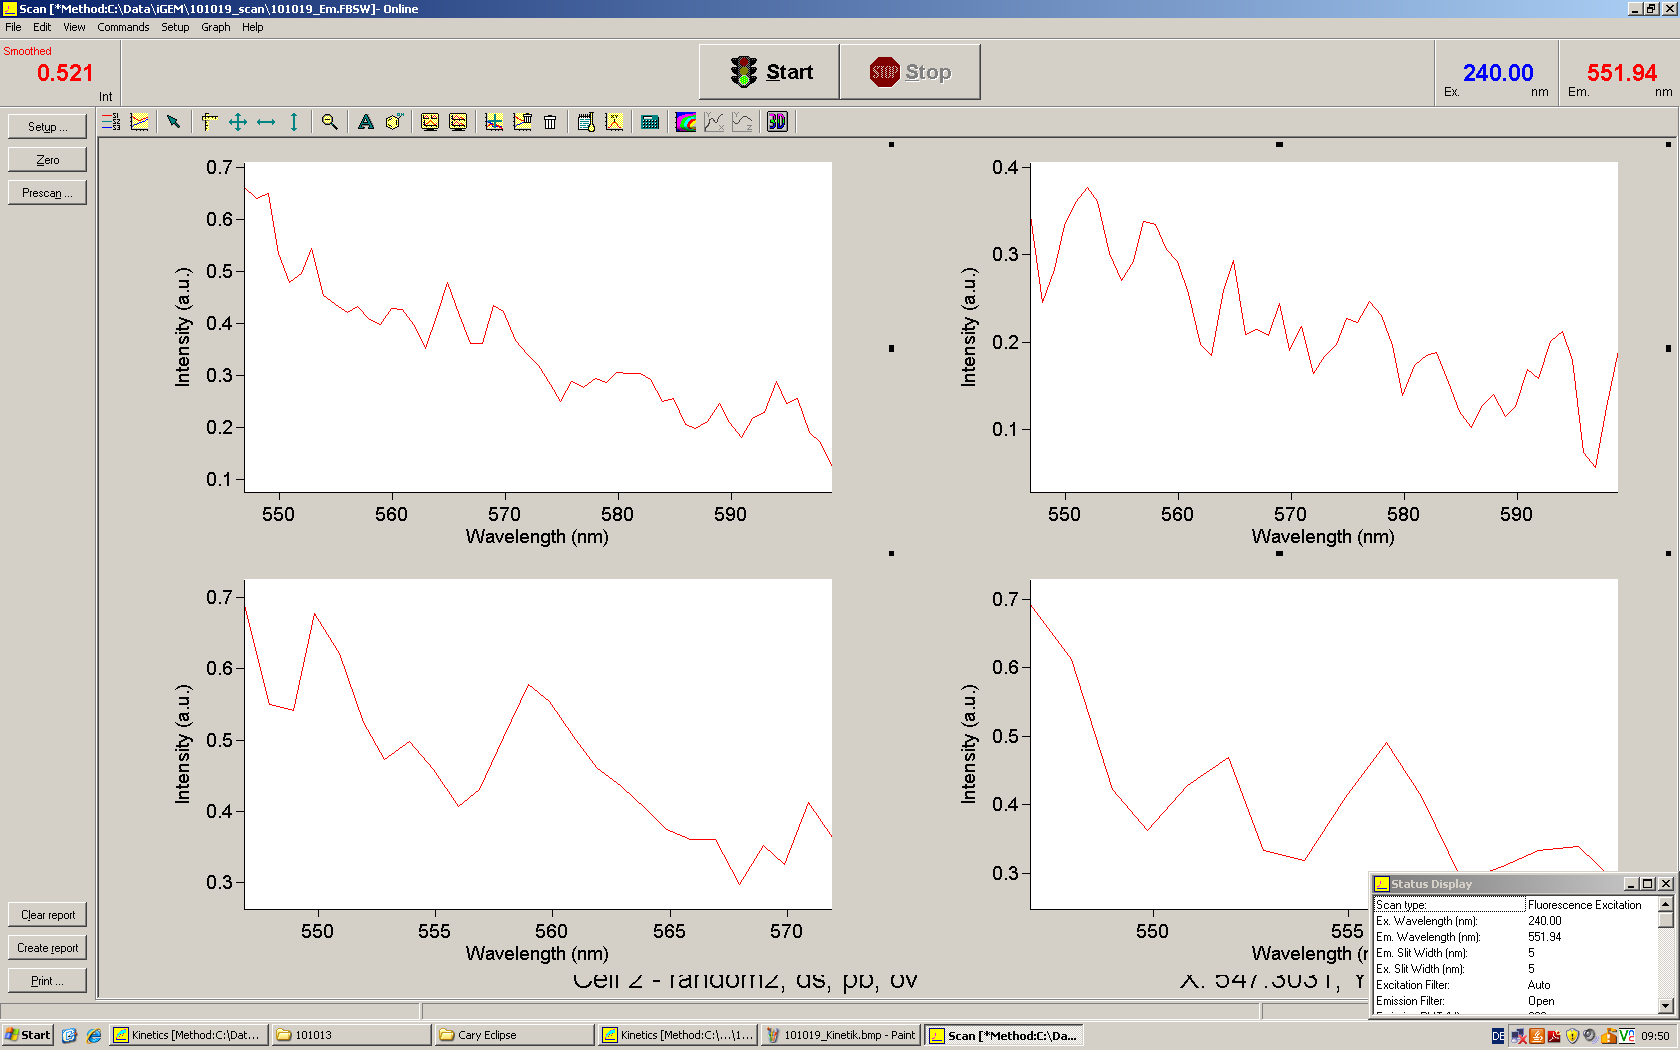
- Excitation spectra: Em=552 nm
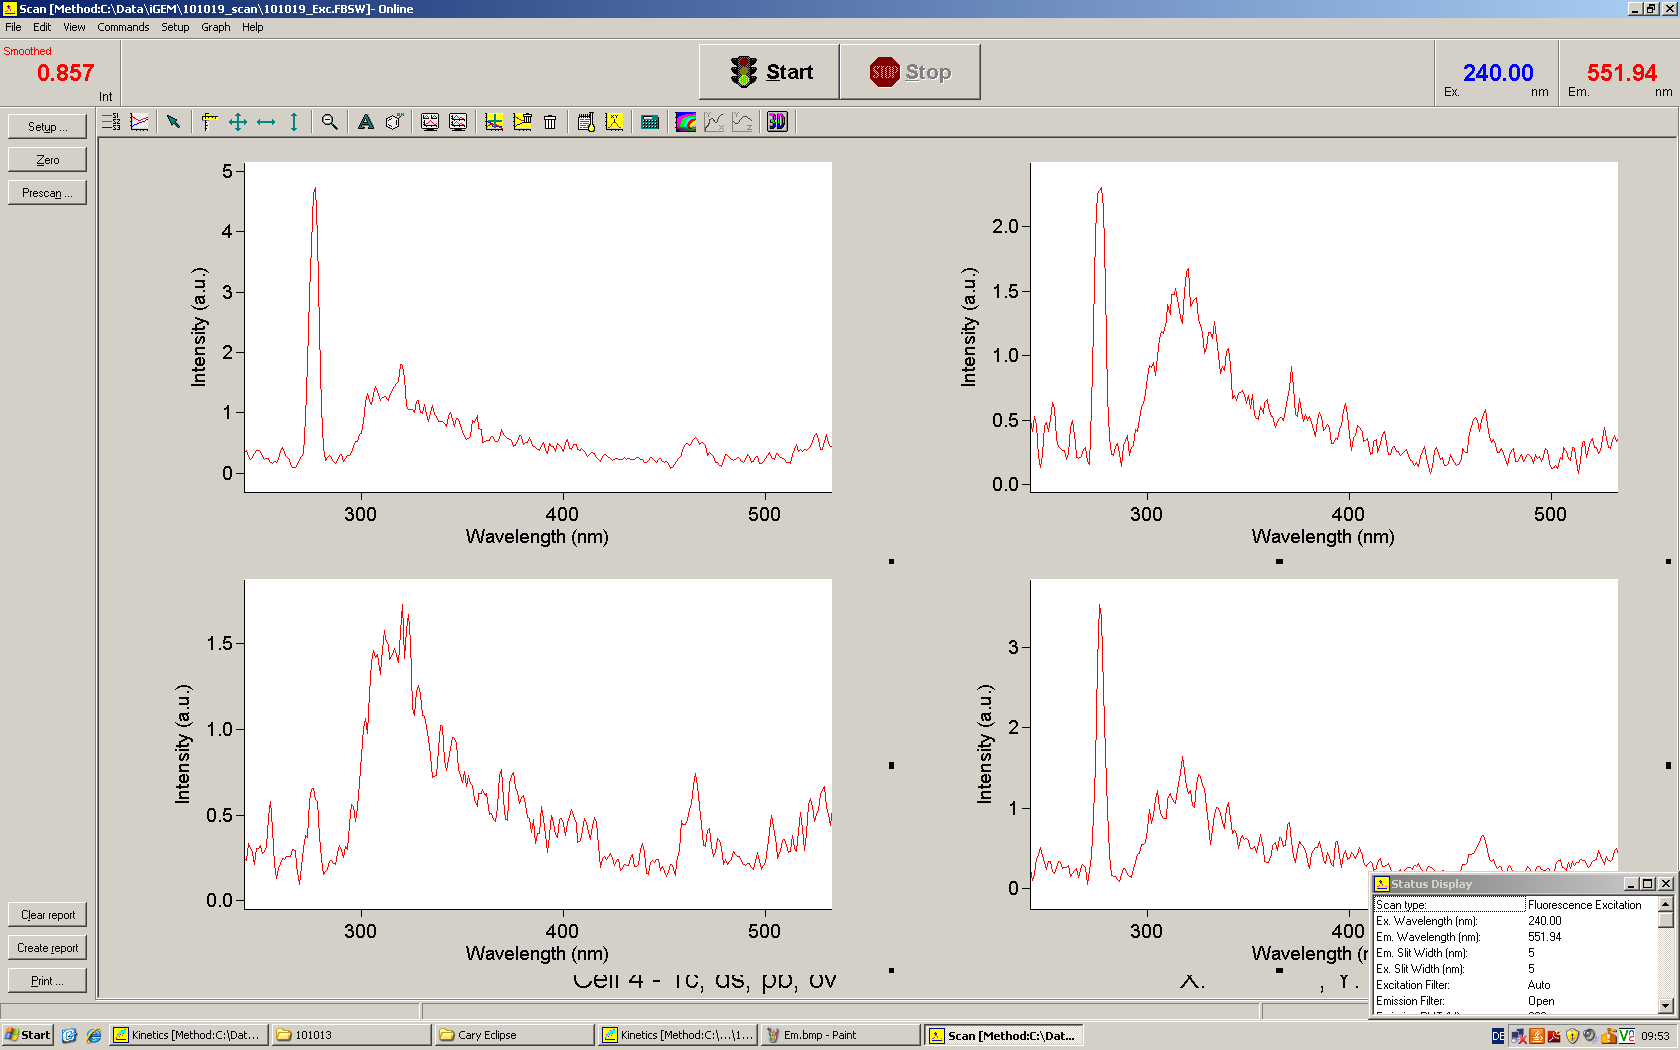
- DnaseI testdigestion
- plasmid digestion to test DnaseI activity:
- 10 µl paper buffer
- 0.2 µl DTT
- 2 µl 10x DnaseI buffer
- 1 µl Dnase
- 1 µl plasmid (some random thing from Wuschel)
- 5.8 µl water
- 37°C, 2h
- samples for DNaseI digestion
- 2 µl 10x DnaseI Buffer
- 1 µl DnaseI
- 17 µl reaction product from malachitegreen assay, 18.10.10
- 37°C, 2 h
- 7M urea, 15 % PAGE
- 30 ml
- 11.25 ml acrylamide
- 12.6 g urea
- 3 ml 10x TBE
- 300 µl 10 % APS
- 30 µl TEMED
- H20 to 30 ml
- heat a bit and sonificate
- gel could not be run: pockets not solid...
- most likely reason: too hot when radical starter were added: instant polymerization were they hit the mixture...
- malachitegreen assay with more malachitegreen this time!
- --> 3x more than usual
- 30 mM 2x malachitegreen paper buffer
- 1 ml 5x paper buffer without malachitegreen
- 0.6 ml 250 mM malachitegreen
- 0.9 ml Water
- 1x switch
- 2 µl signal, 5 µM, double stranded!
- 4.17 µl switch, 2.49 µM
- 2.5 µl RPO
- 50 µl Paperbuffer
- 10 µl DTT 100 µM
- 5 µl rNTPs
- 26.3 µl H2O
- signals: 1a, r2
- 1x positive control
- 2 µl signal, 5 µM, double stranded!
- 2.94 µl switch, 2.94 µM
- 2.5 µl RPO
- 50 µl Paperbuffer
- 10 µl DTT 100 µM
- 5 µl rNTPs
- 27.57 µl H2O
- signal: r2, none
- Cloning Malachitegreen-binding aptamer into pB1C3
- Ligation
- 5 µl digested plasmid
- 2 µl malachitegreen binding aptamer, 1:10 diluted
- 2 µl T4 ligase buffer
- 1 µl T4 ligase
- 10 µl water
- Transformation
- borrowed plates from the Prof. Groll's department
- and from Prof. Becker's
- the one from Prof. Becker's once contained tetracyclin...
- in DH5alpha cells
- 200 µl plated
- overnight, 37°C
20.10.2010
- Yesterday's malachite green binding assay
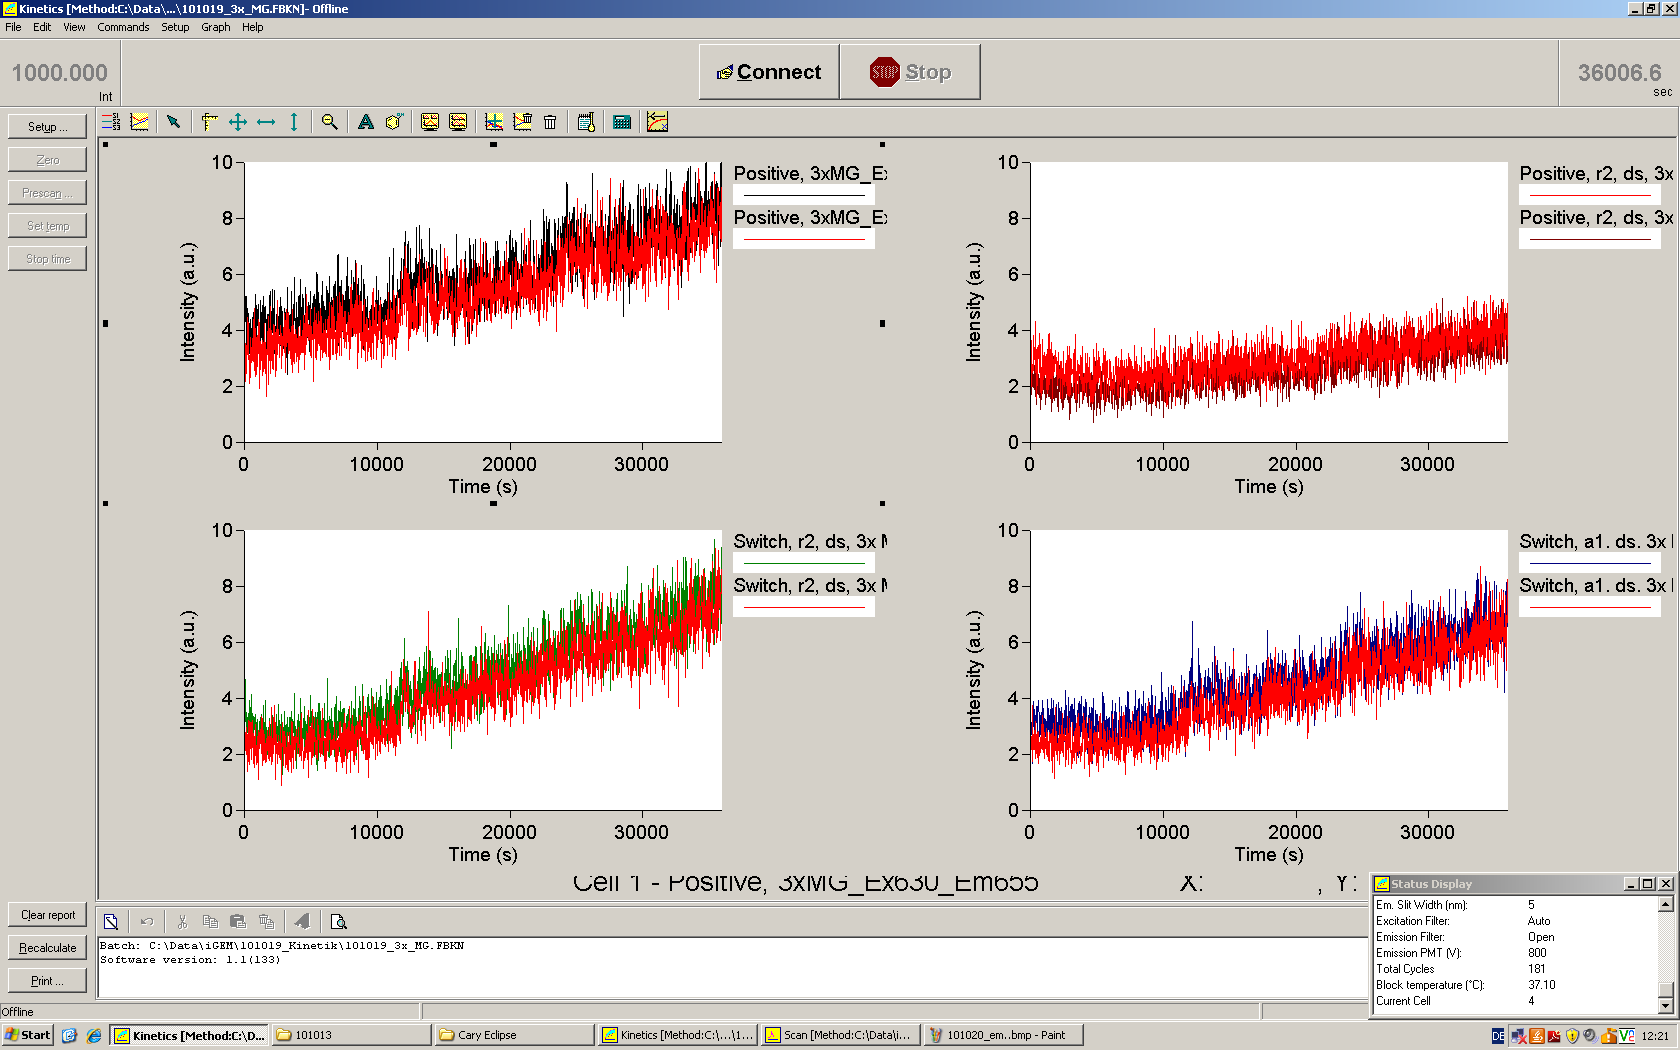
- Emission spectra: Exc=530 nm
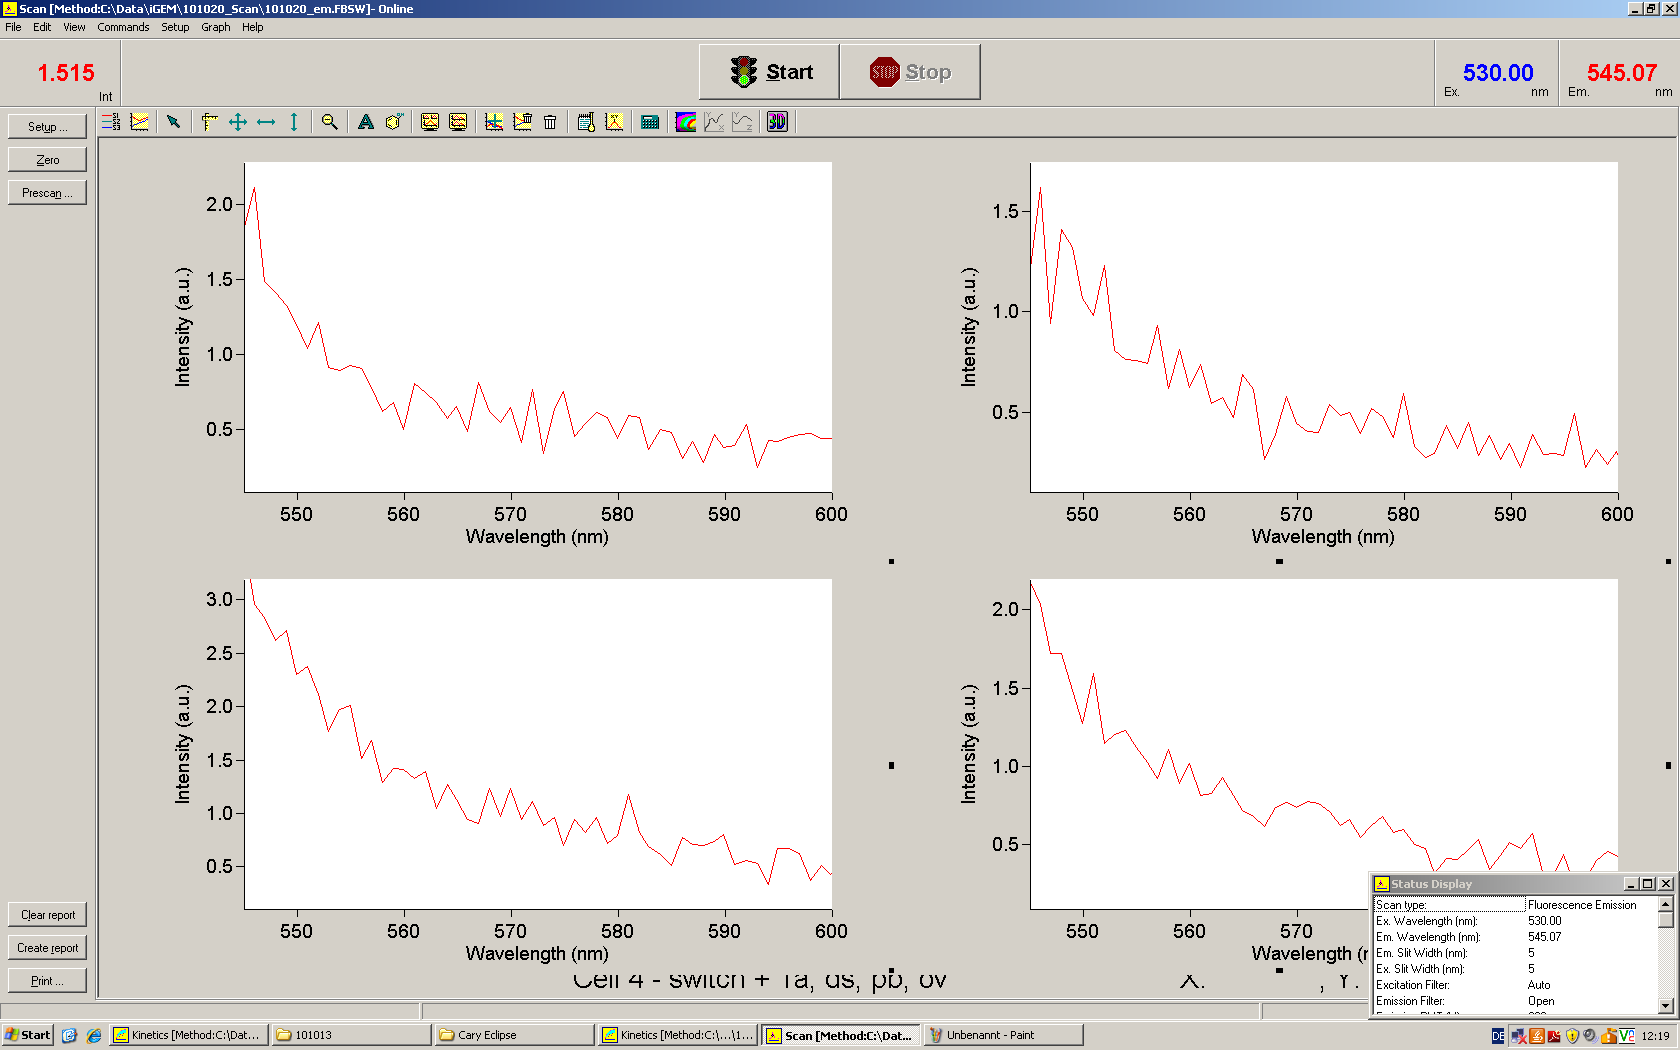
- Excitation spectra: Em=552 nm
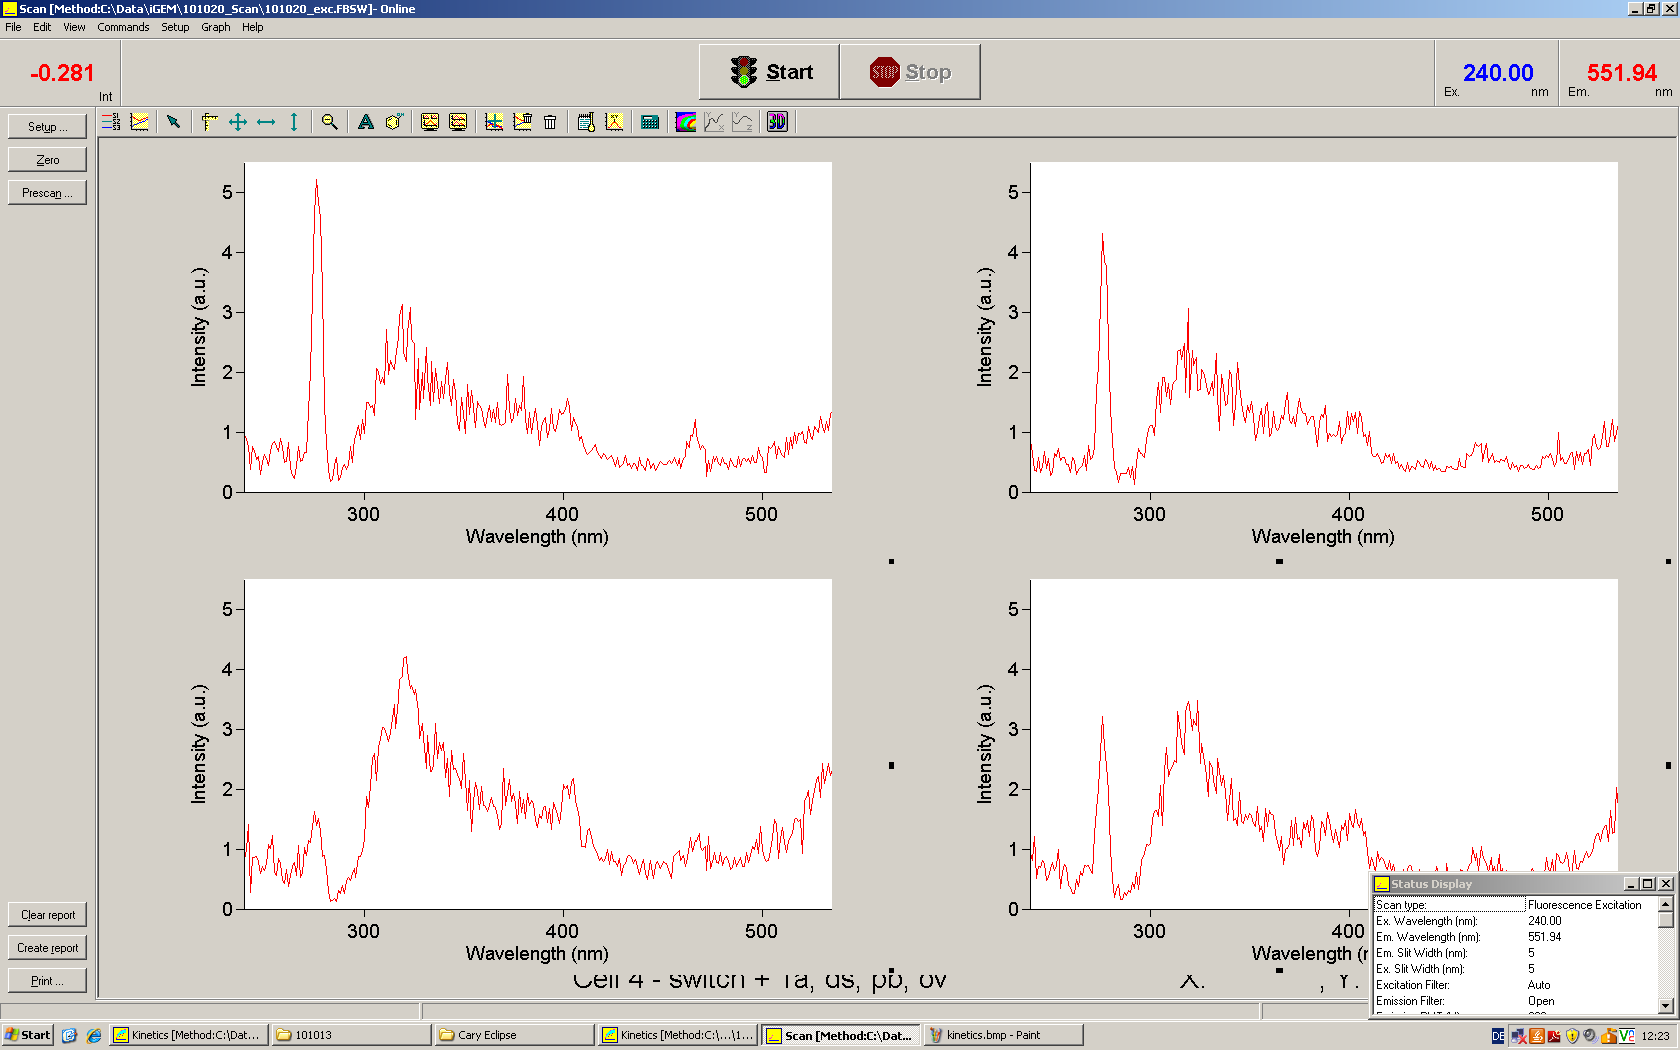
- Cloning Malachitegreen-binding aptamer into pB1C3
- many colonies grown
- Well done, Flo!
- Colony PCRl
- 10 x Mastermix: 500 µl total volume
- 10 µl dNTPs
- 10 µl G1004
- 10 µl G1005
- 50 µl 10x buffer
- 30 µl MgCl2
- 2 µl Taq Polymerase
- 2 µl Template per reaction
- H2O
- PCR program
- iGEM program!
- 58°C annealing
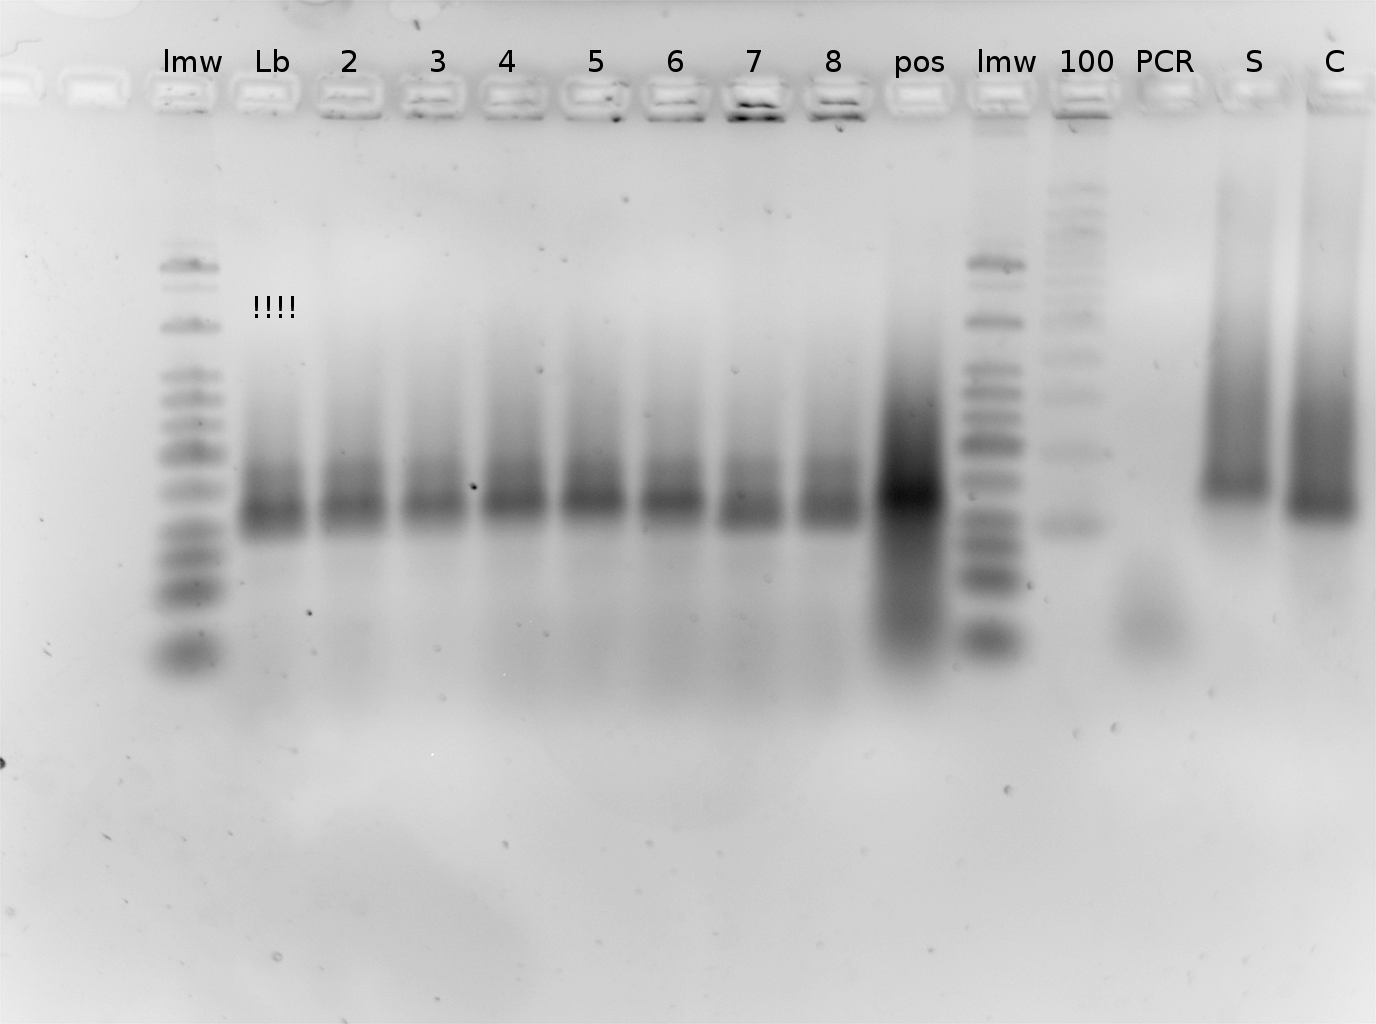
- lmw: low molecular weight (ladder)
- 100: 100 kb (ladder)
- 7 clones chosen to be checked by Colony PCR
- LB=negative control=LB-Chloramphenicol
- positive control: PCR with Biomer product
- also on the gel:
- S=switch=PCR of switch used for measurement
- P=positive control=PCR product used for measurement and cloning
- Interpretation
- stupid negative control looks just the same like everything else
- two bands at approximately the right height, but exactly above and below positive control band
- shit.
- Further proceedings
- 5 ml cultures of clones 3, 4, 5, 7
- 5 ml cultures of 6 new colonies
- minipreps and analytical digestions tomorrow
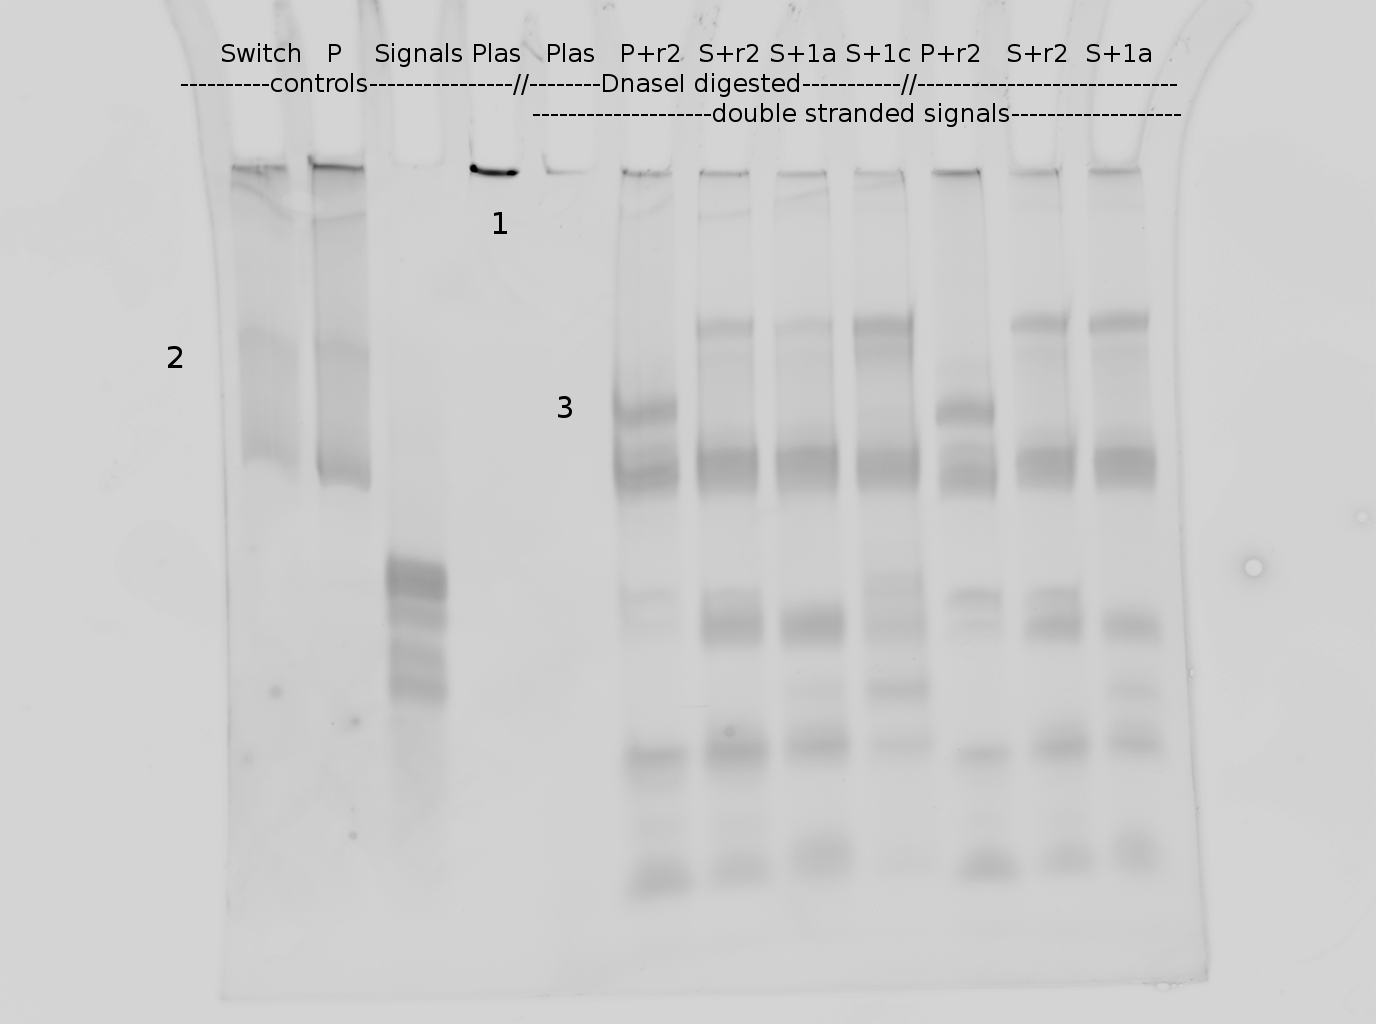
- controls:
- switch: PCR of switch, used in measurements
- P: PCR of positive control, used in measurements
- Plas: random test plasmid used for evaluation of DnaseI activity
- DNase digested samples: 20 µl
- Plas: DnaseI digested random plasmid, for conditions check previous day
- P+r2: Positive control together with double stranded nonsense 2/random 2 signal after overnight transcription in paper buffer (check malachitegreen assay, previous day), DnaseI digested
- S+r2: Switch together with double stranded nonsense 2/random 2 signal after overnight transcription in paper buffer, DnaseI digested
- S+1a: Switch together with double stranded 1a signal after overnight transcription in paper buffer, DnaseI digested
- S+1c: Switch together with double stranded 1c signal after overnight transcription in paper buffer, DnaseI digested
- other: 15 µl
- P+r2: Positive control together with double stranded nonsense 2/random 2 signal after overnight transcription in paper buffer (check malachitegreen assay, previous day)
- S+r2: Switch together with double stranded nonsense 2/random 2 signal after overnight transcription in paper buffer
- S+1a: Switch together with double stranded 1a signal after overnight transcription in paper buffer
- no marker this time! Only 12 lanes :)
- Interpretation:
- no real differences between DnaseI digested and not
- It is rather stupid to use a plasmid to check for DnaseI activity if you want to run the result on a 15 % gel. A plasmid with some kb does not seperate... But: DNA visible, without Dnase I, no DNA visible with DnaseI (stuck in the upper lane, 1)
- Next try with PCR product maybe
- weird lane in all PCR reactions at 2 in both cases and in all other gels and a bit also in agarose gels visible
- positive control runs totally elsewhere than switch even though they do not really vary in length (3)
- Malachitegreen binding assay
- Measurement
- 1x switch
- 2 µl signal, 5 µM, double stranded!
- 4.17 µl switch, 2.49 µM
- 2.5 µl RPO
- 50 µl Paperbuffer
- 10 µl DTT 100 µM
- 5 µl rNTPs
- 26.3 µl H2O
- measured: signals all doublestranded, everything in paper buffer, 10 µM malachitegreen
- positive control
- positive control with nonsense2/random2
- switch with nonsense2/random2
- switch with 1a
21.10.2010
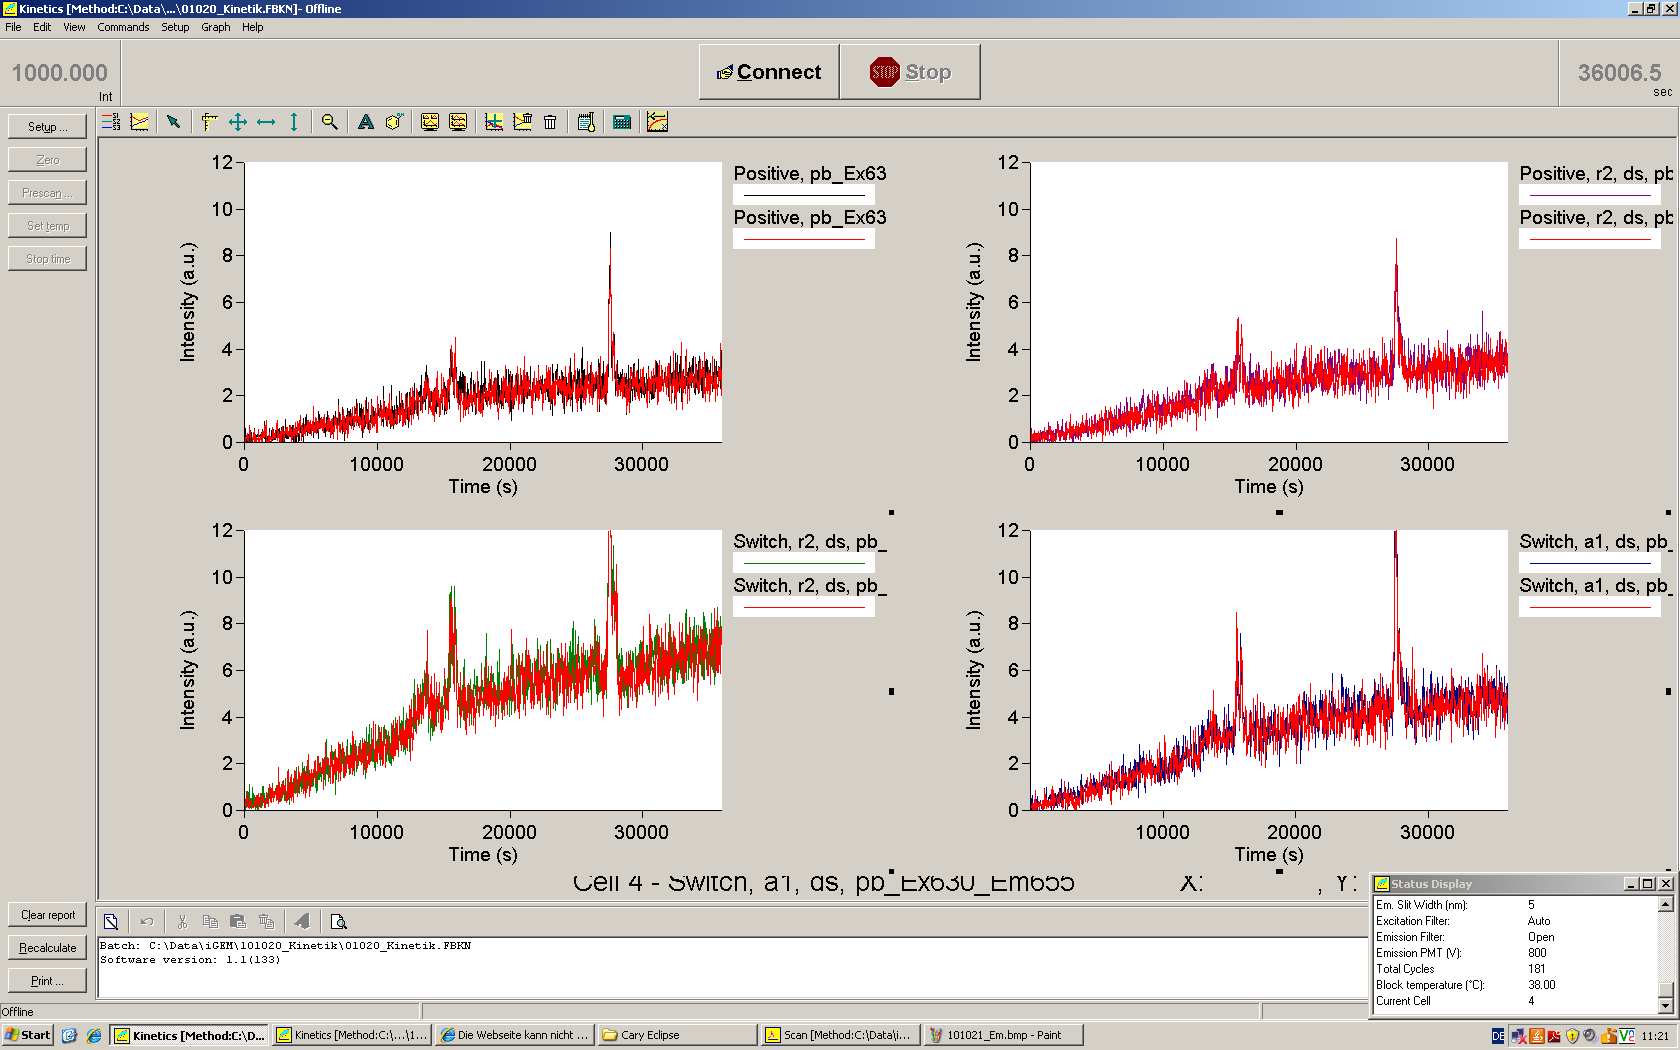
- Fluorescence spetrum, Exc=530
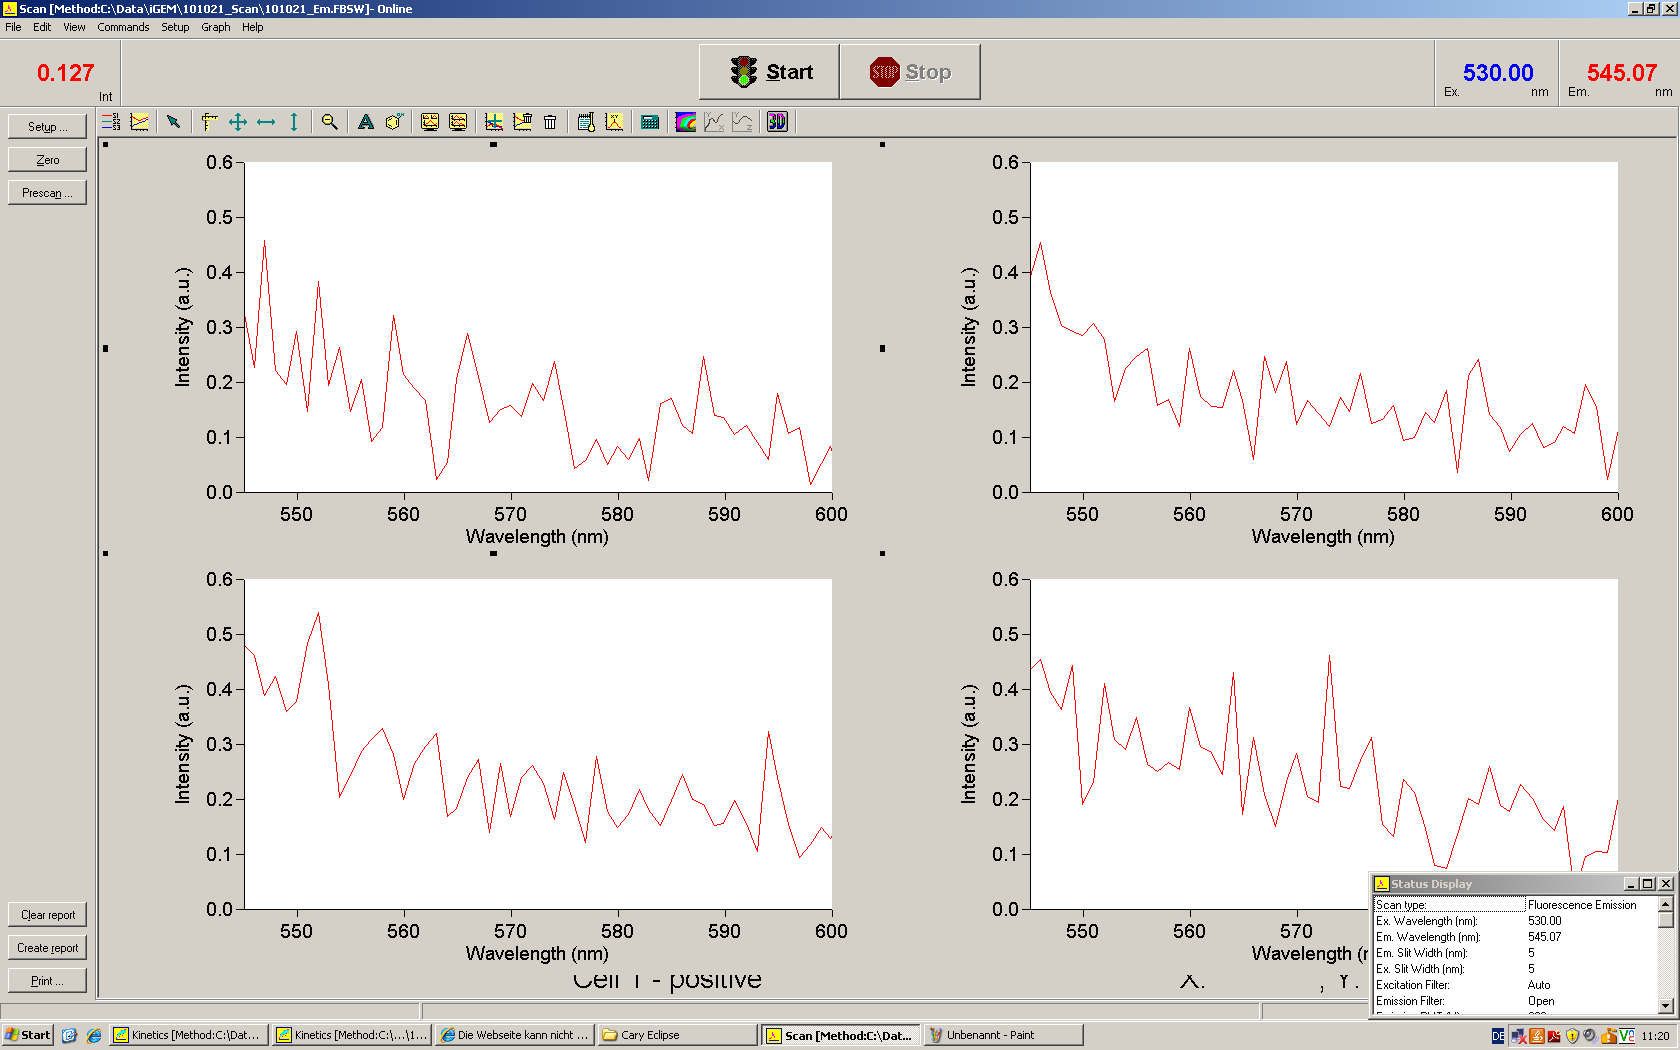
- Fluorescence excitation spectrum, Em= 552

- Amplifying in vivo positive control to send for PartsRegistry
- Miniprep of 5 ml overnight control
- P1 185 ng/µl
- P2 416 ng/µl
- check below for gel picture and further proceeding
- Cloning Malachitegreen-binding aptamer into pSB1C3
- Mini-prep of 5 ml overnight cultures
- # - concentration in ng/µl
- 3 - 272
- 4 - 59
- 5 - 100
- 7 - 95.56
- a - 86
- b - 165
- c - 114
- d - 131
- e - 232
- f - 144
- P1 - 185
- P2 - 416
- Control digestion
- 4 µl plasmid
- 2 µl NEB 3
- 0.5 µl PstI
- 0.5 µl EcoRI-HF
- 13 µl H2O
- 1 h, 37°C
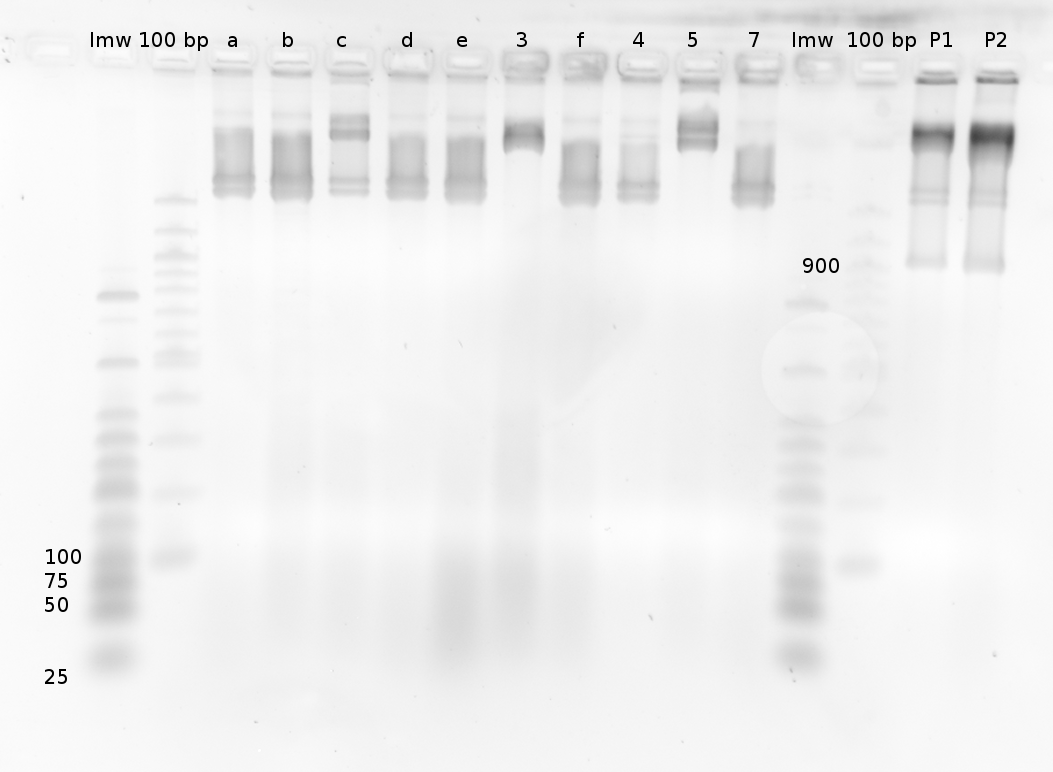
- lmw: low molecular weight ladder (NEB)
- 100 bp: 100 bp ladder (NEB)
- 3,4,5,7: yesterday's clones, checked and falsified by colony PCR
- a-g: yesterday picked clones
- P1, P2: minpreps of in vivo measurement positive control, to be sent to partsregistry
- Interpreation
- well, something went seriously wrong while cloning
- asked at physic's department: DH5alpha cells in use were pretty old: cell from old -80°C are baaaad!
- showed us new stock
- further possibilities: EcoRI nearly empty --> not cutting properly anymore
- T4 ligation buffer: went through 4 tubes until I found one which was not totally full of precipitates
- Chloramphenicol-plates: got plates from Groll group, plates from 2008
- Further cloning procedure
- digestion of linearized pSB1C3 (from parts registry) and positive control with EcoRI-HF (full enzyme)
- digestion of T7 positive control
- 15 µl linearized pSB1C3 (25 ng/µl, damn it, I thought there are 50 ng/µl while preparing the ligation...)/5 µl of positive control, PCR product (c=173 ng/µl) + 10 µl H2O
- 2 µl 10x NEB 3
- 2 µl 10x BSA
- 0.5 µl EcoRI
- 0.5 µl PstI
- 37°C, 1 h
- ligation
- 1 µl T4 ligase
- 2 µl T4 ligase buffer: tested three buffers, one was okay, made aliquots: what happened to all the buffers???
- 1.33 µl backbone (I thought 50 ng, actually 25 ng)
- 0.23 µl insert, 1:10 diluted
- 17.37 µ H2O
- incubated till transformation
- Extracting pSB1C3 from iGEM 2010 distribution
- 10 µl H20 in A3
- 3 µl used for transformation
- transformation
- in DH5alpha cells from new -80°C fridge...
- also in XL-1 blue: Tetracycline resistance
- 15 minutes in ice with ligation product
- 1 minute heat shock, 42°C
- 2 minutes on ice
- 500 µl LB0 added
- 1.5 hours at 37°C, shaking
- control: digested, linearized pSB1C3 into XL-1 blue
- reason: DpnI digestion recommended, we don't have any DpnI
- on chloramphenicol agar plates from Prof. Buchner's lab --> new and shiny
- XL-1 blue plated on Tetracycline/Chloramphenicol plates from Becker's lab: not used in Becker's lab because Tetracycline broken, does not matter for us...
- E. coli RPO malachitegreen assay
- E. coli RPO finally arrived
- called Biozym: RPO was supposed to arrive yesterday, delivery cimpany signed for yesterday
- called Materialausgabe two times everyday for the last week --> In the end they already knew, when they heard E14
- nevertheless when the enzyme arrived, somebody forgot to put it into the large book of incoming stuff
- only one person knew, that the enzyme already arrived
- stored at -20 °C meantime
- dry ice already vaporated...
- people were first mad at me, because I insisted that the package arrived although it was not written in the main book
- then mad at each other because somebody did not put it into the main book
- then I was slightly mad because we called two times a day for seven days, argued about -80°C storage and still...
- bought dry ice, transport into ZNN, stored at -20°C covered in dry ice (-80°C fridge is already standing in the lab but not installed yet) until measurements
- now stored at old -80°C in physic's department in iGEM box
- preperation of measuring constructs - without terminator
- PCR of 12z (His-Terminator in plasmid)
- 5z (TrpTerm in plasmid)
- 28z (pSB1A2-R0011-TrpSig)
- pSB1K3-R0011-HisSig-B0014
- 4x 8x PCR mix
- 8 µl dNTPs
- 8 µl Apt forward
- 8 µl Apt reverse - without terminator!
- 40 µl 10x buffer
- 24 µl MgCl2
- 1.6 µl Taq Polymerase
- 302.4 µl Template per reaction
- H2O
- recognized that wrong primers were used for the signals, thrown away after PCR
- protocol iGEM PCR, 52°C annealing temp.
- purified using Clean and Concentrator
- yields: 220 ng/µl TrpTerm, 178 ng/µl (or something like that) HisTerm
- Buffer preparation for E. coli RPO
- Instructions from Epicentre Biotechnologies Datasheet (included in package)
- 5x transcription buffer
- 2 ml Tris, pH=7.49
- 1 ml 500 mM MgCl2
- 5 µl Triton X-100
- 3.75 ml 2 M KCl
- water to 10 ml
- stored in fridge
- 2x transcription buffer with malachitegreen
- 4 ml 5x buffer
- 800 µl 250 mM malachitegreen stock
- water to 10 ml
- wrapped in aluminium foil, stored in fridge
- measurement with E. coli RNA Polymerase
- measured: 12z (TrpTerm - negative control), 5z (HisTerm, negative control), (positive control)
- 1x measurement
- 2.5 µl RPO (2.5 U)
- 10 µl DTT (100 mM stock, 10 mM end)
- 50 µl 2x buffer
- 2.5 µl rNTPs (80 mM stock, 2 mM end)
- 1 µg DNA template
- water to 100 µl
- 3.1 x
- 7.75 µl RPO
- 31 µl DTT
- 7.75 µl rNTPs
- 155 µl 2x buffer
- 77.5µl H20
- 4.5 µl 5z/5.5 µl H2O
- 5.35 µl 12z/4.65 µl H2O
- 5.88 µl ??? /4.12 µl H20
- 38°C, Exc=630 nm, Em=650/655 nm
- Cloning of R0011 and B1006 in pSB1K3
- digestion of R0011 with EcoRi and SpeI (check above, same procedure)
- ligation
- 0.3 µl R0011
- 0.2 µl B1006 (signal)
- 5 µl pSB1K3
- 2 µl T4 ligation buffer
- 1 µl T4 ligase
- 11.5 µl H2O
- Transformation into DH5alpha cells
- put on Kana-Plates
- Cloning of signal B1006 in pSB1A2_R0011
- 1.82 µl pSB1A2_R0011
- 0.2 µl Signal B1006
- 2 µl T4 DNA ligation buffer
- 1 µl T4 DNA ligase
- 15 µl H2O
- Transformation into DH5alpha cells
- put on Amp-plates
22.10.2010
- Yesterday's malachitegreen assay using E. coli RPO
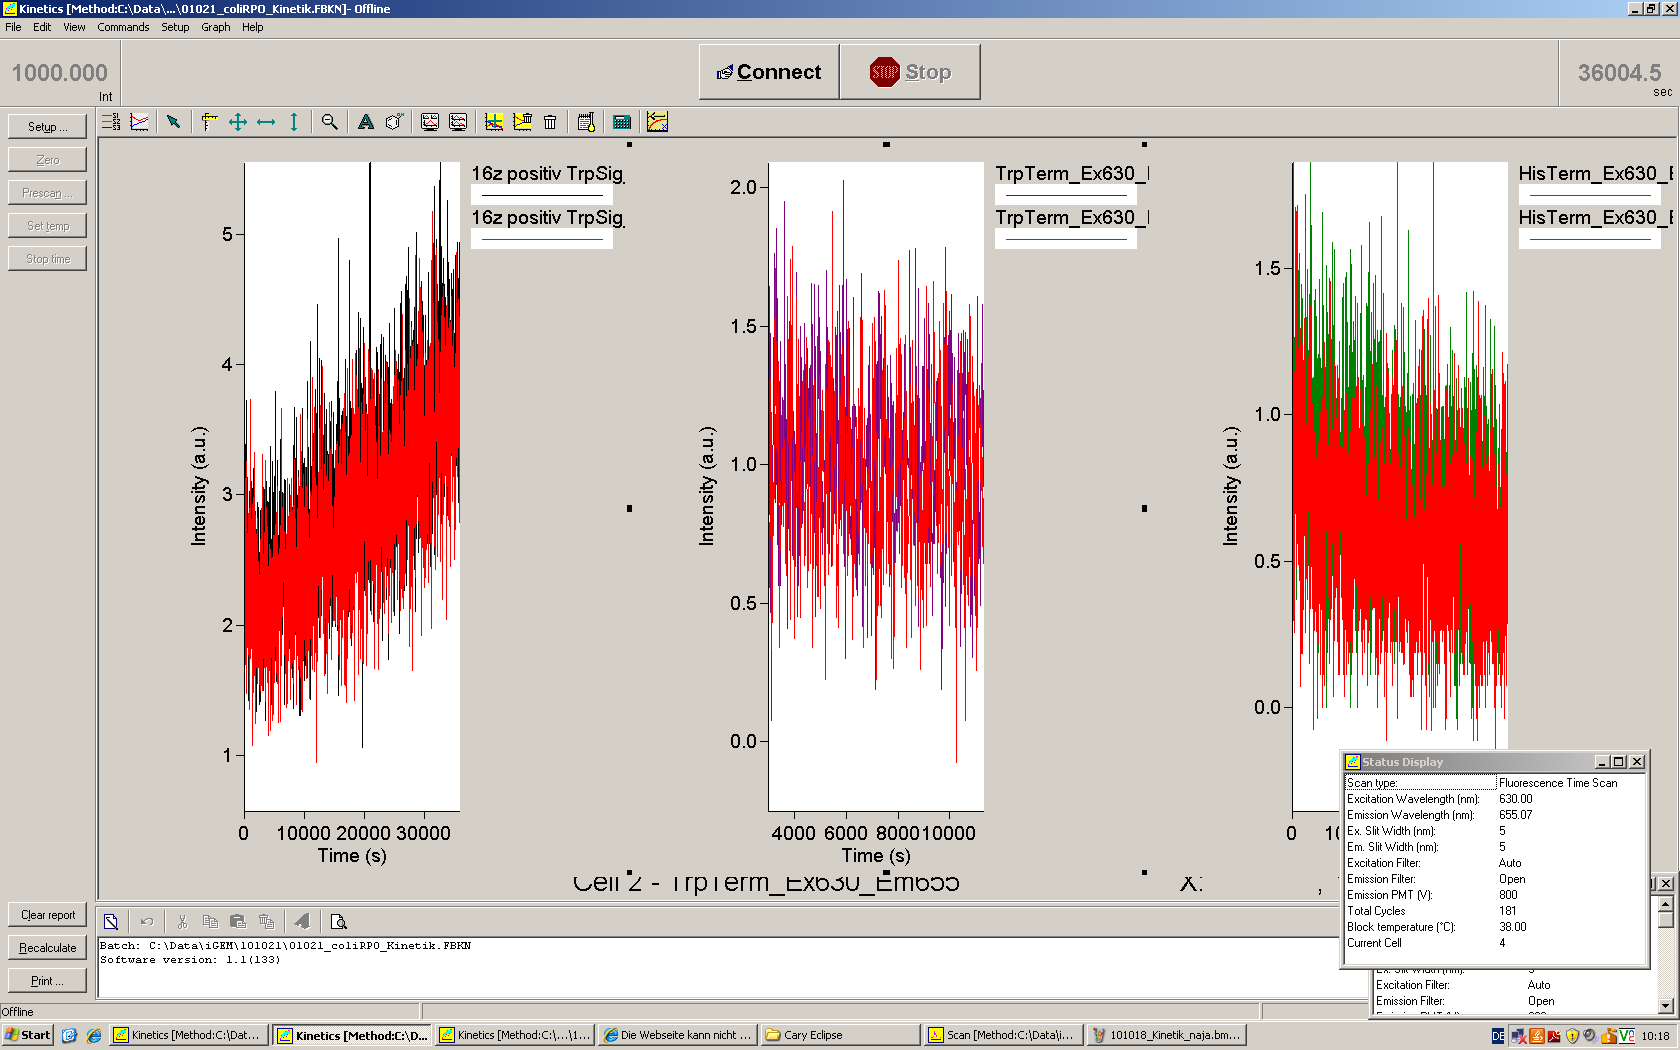
- Fluorescence spetrum, Exc=630
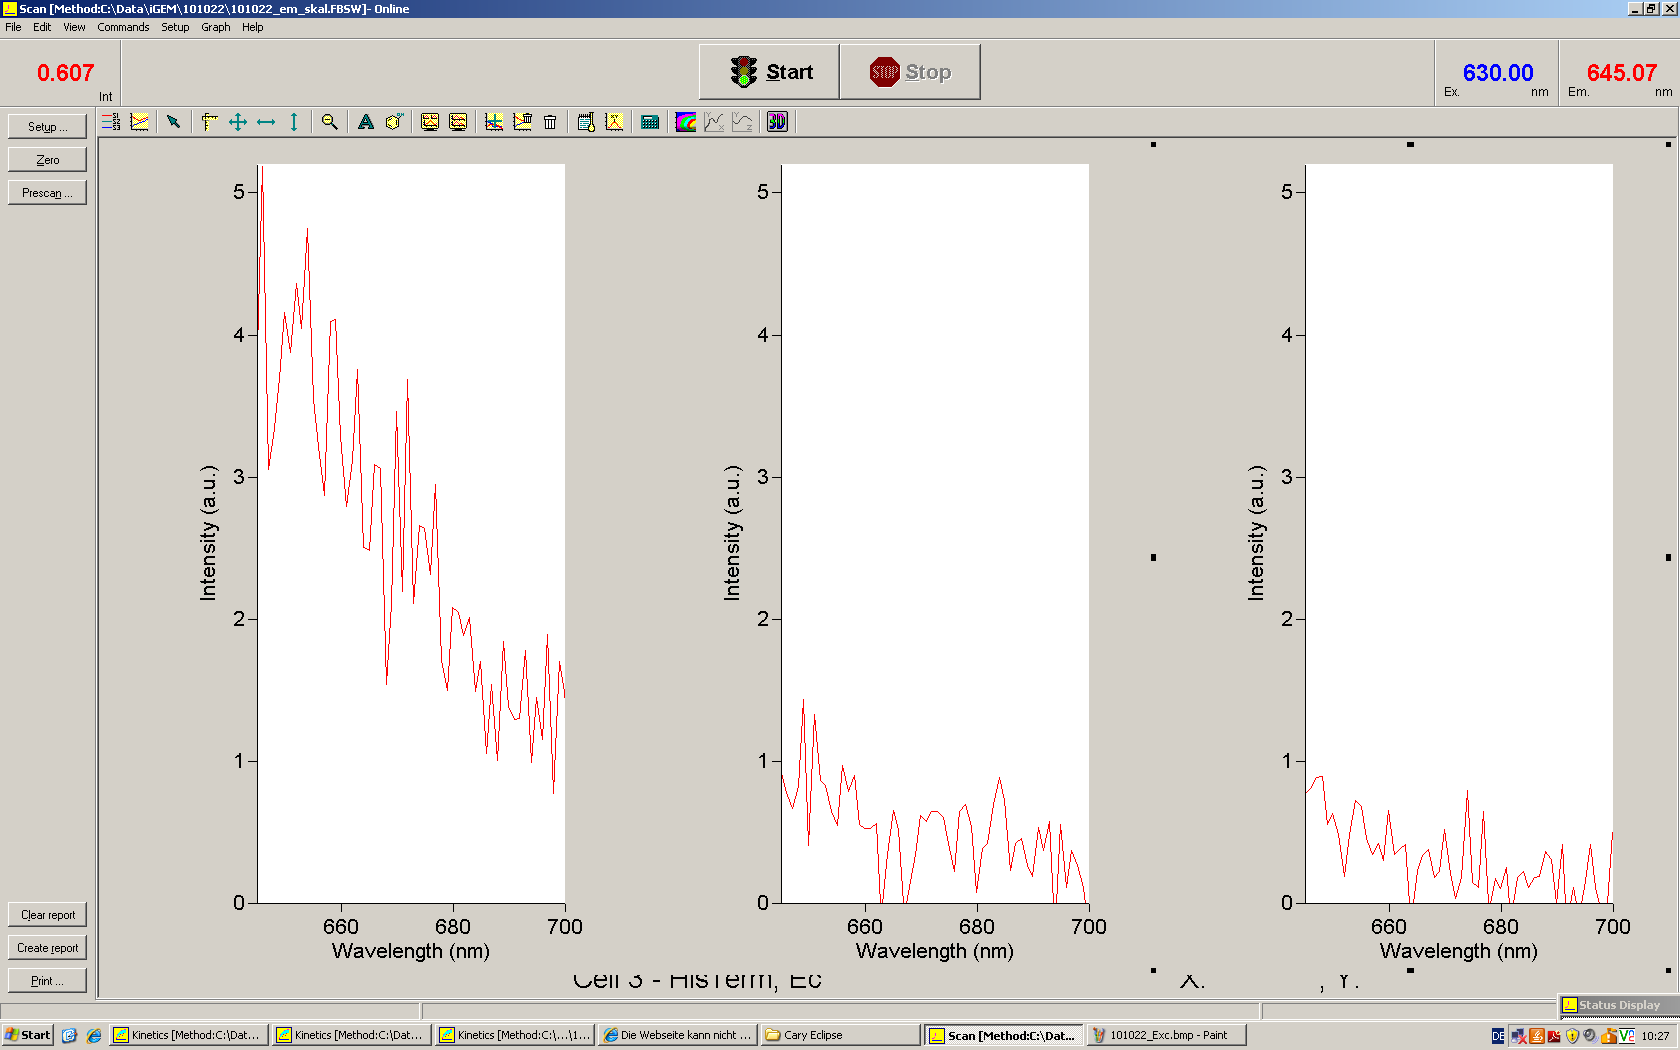
- Fluorescence excitation spectrum, Em= 652
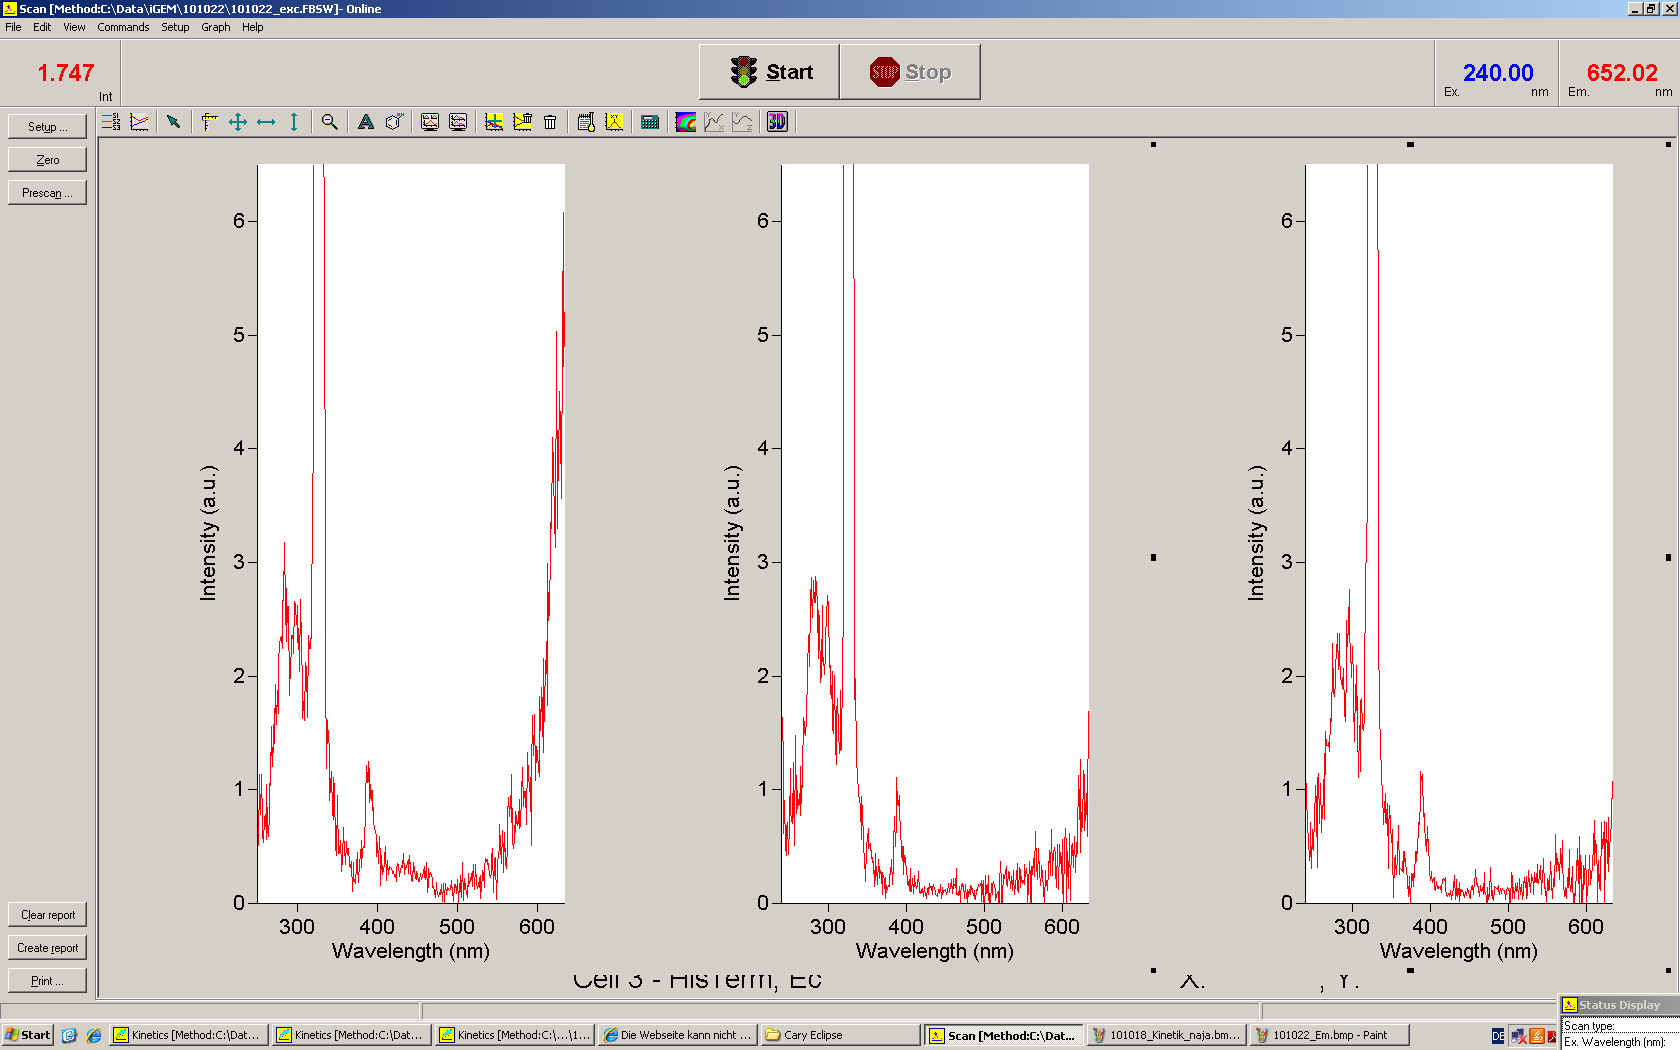
- 7 M 15 % PAGE
- DnaseI digestion of E. coli RPO transcription
- control: T7 positive control
- 17 µl Transcription product
- 2 µl 10 x DnaseI buffer
- 1 µl Dnase
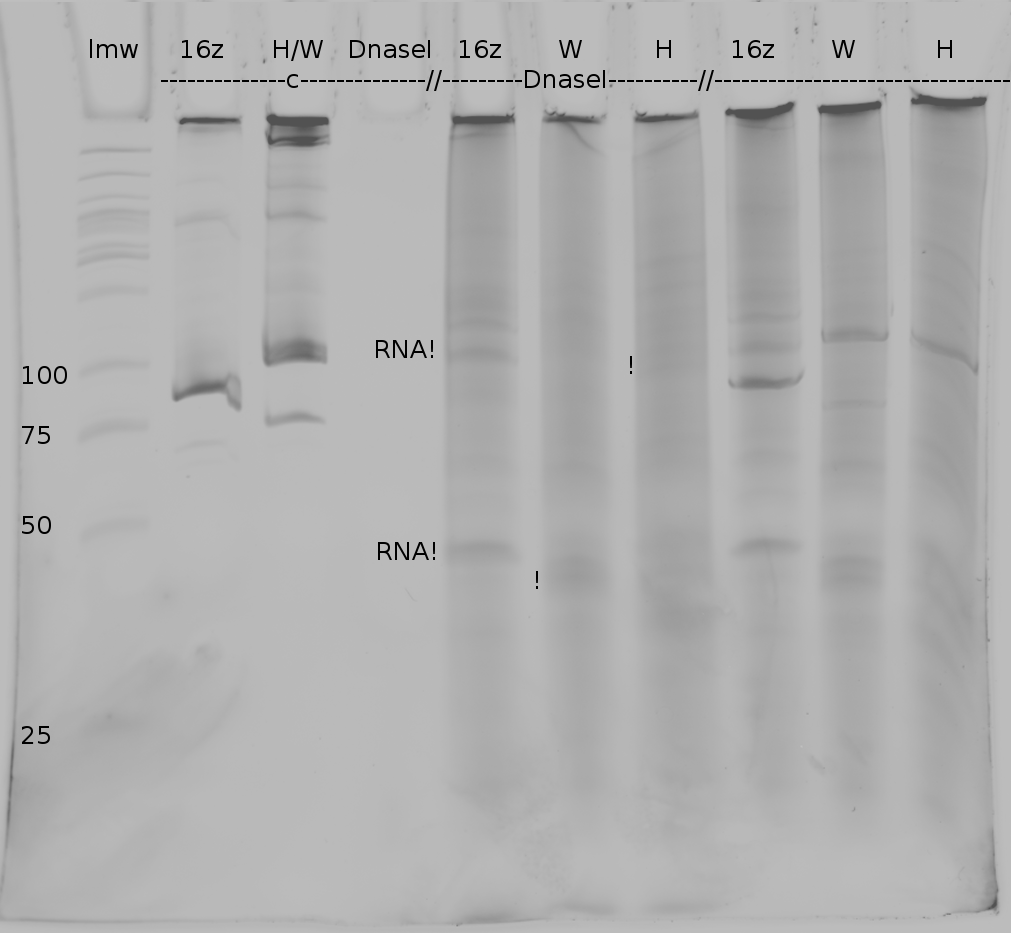
- lmw: low molecular weight ladder, NEB
- H: His-switch
- W: Trp-Switch
- 16z: Positive control (with TrpSignal); using Primer Apt_For+AptPart_woT_Rev
- Ladies and Gentleman, we definetly see RNA this time
- positive control completely transcriped, terminators terminate (finally some terminator terminate...)
- DnaseI digestion works. DnaseI control completely clean.
- I think termination products are visible
- I also think, that RPO/DnaseI/protein in general bound RNA is stuck in pockets
- 1h. 37°C, Dnase digestion conditions: RNA suffers a bit, paradise for RNases?
- Cloning Malachitegreen-binding aptamer into pSB1C3
- no clones on plates
- clones expected to show up on A3 transformed cells --> part from partsregistry!
- weird clones on Tetracycline/Chloramphenicol plates from Becker's department --> maybe both antibiotics not working anymore
- talked to Moni from E 22
- still old cells in new -80°C --> cells from 2008, maybe dead, certainly not competent...
- repeat transformation (see yesterday's labbook)
23.10.2010
24.10.2010
Close
Week31
Cloning of Parts into pSB1C3 T7 & E. coli
The Week of Wiki freeze! We will all be doomed! DOOMED!!!!!!!!
Close
|
 "
"


