Team:TU Munich/Lab
From 2010.igem.org
(→In vivo Measurements) |
(→In vivo Measurements) |
||
| Line 19: | Line 19: | ||
<br> | <br> | ||
| - | To control the expression of the switch, the particular DNA sequence itself is under the control of an IPTG dependent promotor. In the future we want our networks to be able to respond to a variety of external signals like small metabolites, ions or whatever can be found in the parts registry. For a start we went with an established and well-working system like the ''lac''-operon. | + | To control the expression of the switch, the particular DNA sequence itself is under the control of an IPTG dependent promotor. In the future we want our networks to be able to respond to a variety of external signals like small metabolites, ions or whatever can be found in the parts registry. For a start we went with an established and well-working system like the ''lac''-operon. ---> PLASMID MAP |
<br> | <br> | ||
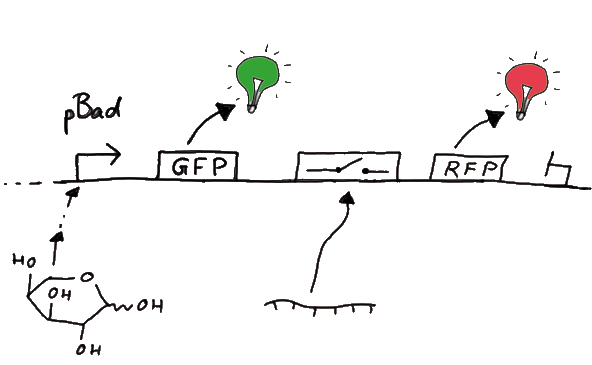
So upon induction with arabinose a rise of GFP expression can be seen. To monitor changes in gene expression we put our E. coli cells in a fluorimeter and measured fluorescent. It worked quite nicely with living cells in a fluorimeter, the only thing to avoid is too much scattering: the cell density should not exceed an OD600 of ???. Continious stirring and a set temparature at 37°C allowed measuring over severall hours. Cell density was checked in between. | So upon induction with arabinose a rise of GFP expression can be seen. To monitor changes in gene expression we put our E. coli cells in a fluorimeter and measured fluorescent. It worked quite nicely with living cells in a fluorimeter, the only thing to avoid is too much scattering: the cell density should not exceed an OD600 of ???. Continious stirring and a set temparature at 37°C allowed measuring over severall hours. Cell density was checked in between. | ||
Revision as of 16:25, 11 October 2010
|
||||||||
|
|
Experiment DesignIn vivo Measurements
Our initial idea to prove our concept of antitermination was to use flourescent proteins as reporters. This approach gives the opportunity to measure the termination and antitermination efficiency of our designed BioBricks in vivo as well as in vitro, the latter using a translation kit based on E. coli lysate.
To control the expression of the switch, the particular DNA sequence itself is under the control of an IPTG dependent promotor. In the future we want our networks to be able to respond to a variety of external signals like small metabolites, ions or whatever can be found in the parts registry. For a start we went with an established and well-working system like the lac-operon. ---> PLASMID MAP
For switch evaluation, IPTG was added to the cells after about two hours after arabinose induction (baseline). ??? Stimmt das?? A rise of RFP/mCherry emission should be visible in case of a working switch.
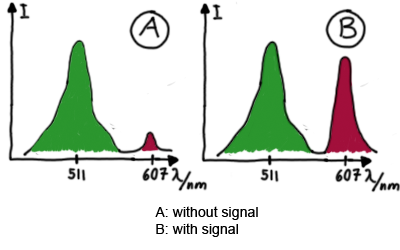
When measuring the termination of our BioBricks and the antitermination by their corresponding signal-RNA, we should be able to observe an increasing RFP emission compared to the GFP emission upon induced signal-RNA production in the cells/in the kit:
Wiith these measurements, it should also be possible to observe differences in efficiency of termination as well as antitermination between our designed switches. In vitro Measurements
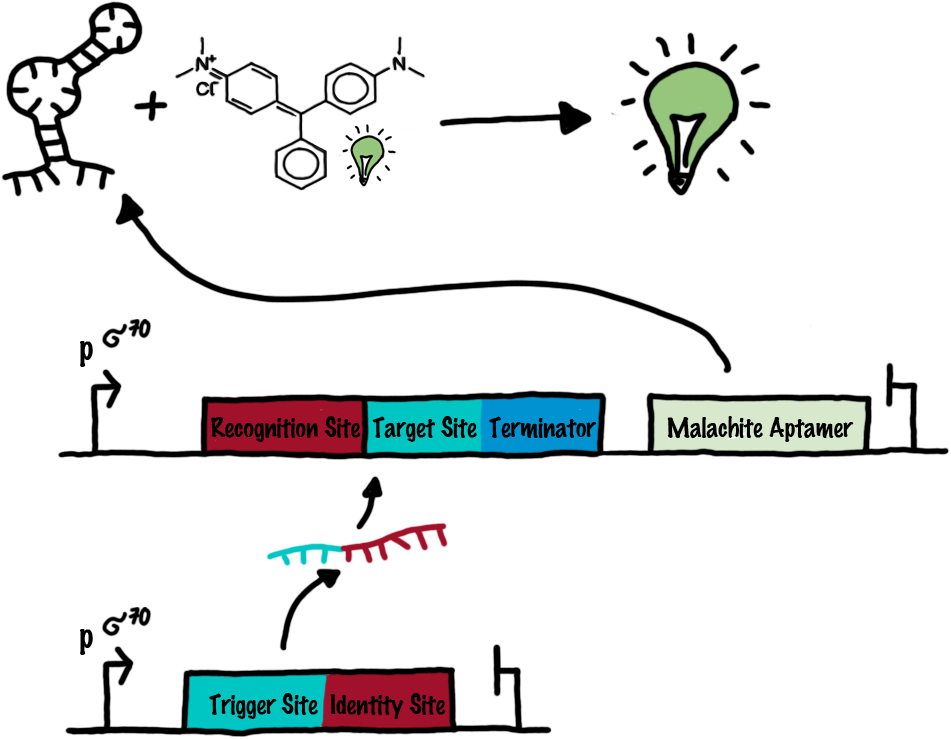
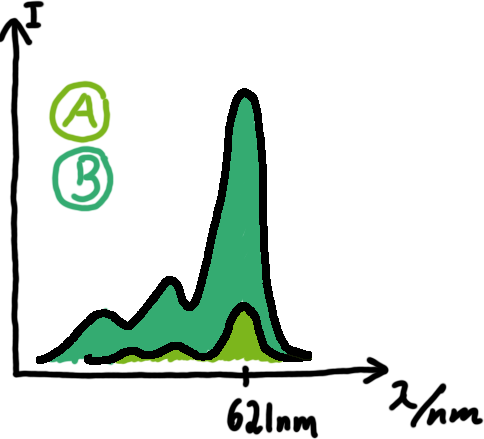
A second possibility to measure parameters of our switches we came up with, was the idea to investigate our system on the transcriptional level only. Therefore, we decided to use malachite green as reporter. Malachite green in a fluorescent dye, whose emission increasing dramaticly (about 3000 times) upon binding of a specific RNA-aptamer.
---concept to be described, as well as literature---
<ref>refs</ref>
To study the switches on the transcriptional level gives the advantage, that we would have less interferences and possible artefacts. Also, we are not sure how cellular mechanisms like degradation of RNases or interacting factors as well as molecular crowding influence our systems. We made constructs comprising of a sigma(70)-binding promoter followed by a short nonsense sequence, the switches and the aptamer sequence. In vitro Translation
So haben wir in vivo translation gemessen Close
ProtocolsMolecular BiologyPCR
So geht ne PCR CloseDigestion
So geht ne PCR CloseIn vivo measurement
So haben wir in vivo gemessen CloseIn vitro measurement
So haben wir in vitro gemessen Close
Lab BookExplanation:
|
|||||||
 "
"


