Lab notes (8/2 - 8/8)
Group: Flagella
Checking if Pst1 site in FlhDC mut is not pressent vol.2
Done by: Sheila & Louise
Date: August 2nd
Protocol: RD1.1
Notes: Freeze tube 9 containing DNA purification from MG1655 cells was used as native FlhDC. Freeze tube 48 containing FlhDC mut purification. These two samples was amplified according to CP1.1 and run with an annealing temperature of 63 celcius and 2 minutes elongation.
The PCR samples were loaded on a1.5% gel with two ladders (100-1000 and 100-10000) FlhDC native was loaded in the first 5 lanes and FlhDC mut in the next 5 lanes.
The gel is expected to show two bands for the native FlhDC gene, one arround 900bp and one arround 100bp, while the FlhDC mut is expected to show only one band, between 900bp and 1000bp.
Results: The gel is pour, shows smear and bands at 200 bp.
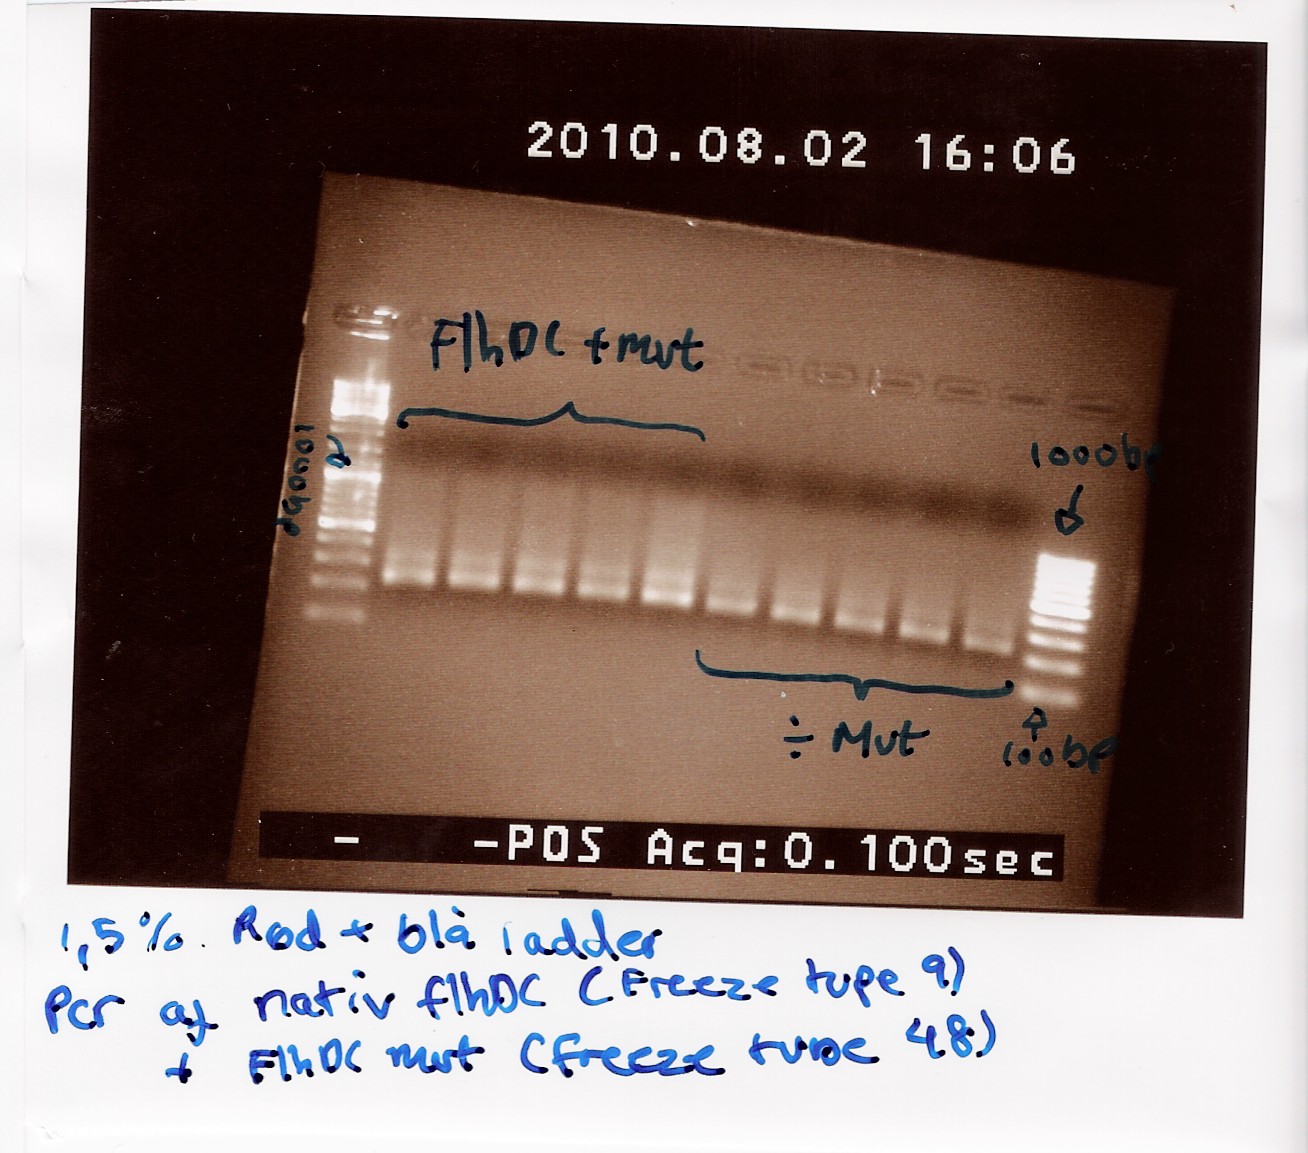
We suspect that the primers are to blame for this result. It is possible that when the primer-stock used was made, old primers was used instead of the new longer ones. If this is the case then the annealing temperature of 63 celcius (ajusted to the new primers) is way higher than that of the old ones (45 celcius) which would make it impossible for primers to anneal.
So we made new primer-stock, and removed the old stock and primers.
--Louch07 08:20, 5 August 2010 (UTC)
vol. 3
Done by: Sheila & Louise
Date: August 3th
Protocol: RD1.1
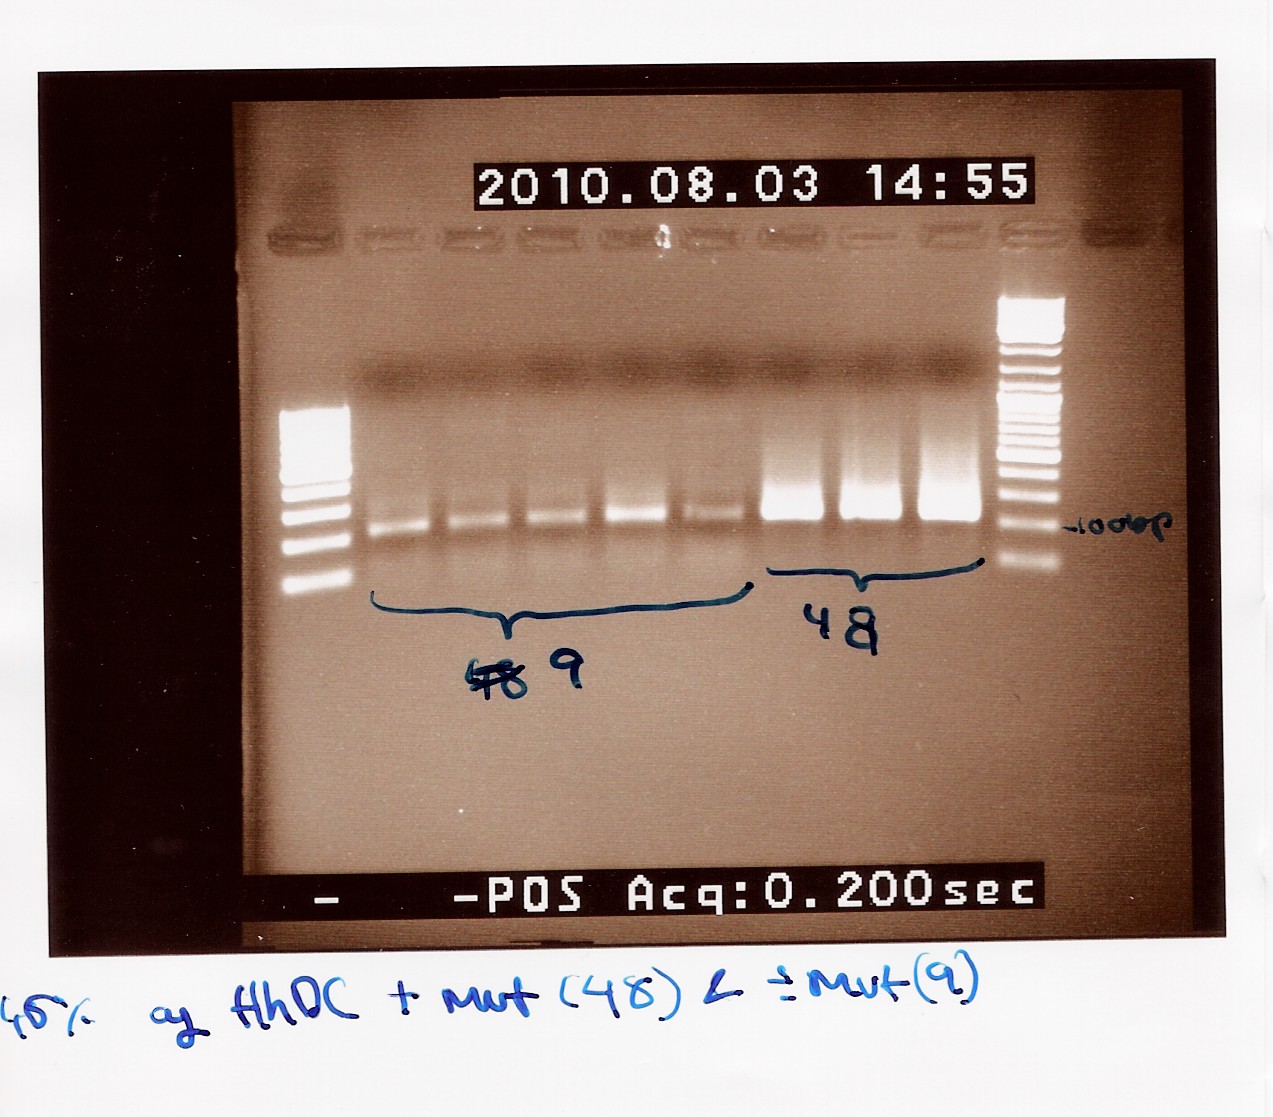
Notes: The previous experiment was redone with the new primers.
Five samples of native FlhDC (FT 9) and 3 samples of FlhDC mut (FT 48) was loaded on a 1.5% gel with two ladders (100-1000 and 100-10000).
Results: The gel still shows smear and bands at 200bp.
We have no explanation this time, and have desided to shelve this experiment a while.
--Louch07 10:20, 5 August 2010 (UTC)
Colony PCR of FlhDCmut and DT (B0015)
Done by: Maria, Pernille & Louise
Date: August 4th
Protocol: CP1.3
Notes: The FlhDC mut gene was previously incearted into two different plasmids (pSB3k3 and pSB1c3) and the DT was incearted into pSB3c5. These were grown and 8 colonies from different plates were picked
FlhDCmut in pSB3k3, PCR-tube 1a-h
- 1a, -b, -c were picked from plate L1.1b (30.07.10)

- 1d, -e, -f were picked from plate L2.1a (30.07.10)

- 1g, -h were picked from plate L3.2a (30.07.10)
FlhDCmut in pSB1c3, PCR-tube 2a-h
- 2a, -b were picked from plate L1.3b (30.07.10)

- 2c, -d, -e were picked from plate L3.2b (30.07.10)

- 2f, -g, -h were picked from plate L2.1b (30.07.10)
DT(B0015) in pSB3c5, PCR-tube 3a-h*
- 3a, -b were picked from plate L1.2a (30.07.10)

- 3c, -d were picked from plate L2.1c (30.07.10)

- 3e, -f were picked from plate L2.1b (30.07.10)

- 3g, -h were picked from plate L2.2a (30.07.10)
̈́* On these plates were many red colonies, this might be because no extraction was done after the cutting, which would result in un-cut plasmids to be pressent.
Pre-mix x 25
87.5 ul water
62.5 ul 10 x TAQ buffer
25 ul MgCl2
25 ul VF2
25 ul VR
12.5 ul 10mM dNTP
3 ul TAQ (we've got a new TAQ stock which is twice as strong as the previous, so now we only use 1/8 TAQ of the amount in the protocol. ((1/8 x 1 ul) x 24))
PCR Program:
Progress
|
Temp (celcius)
|
Time (min) FlhDC
|
Time (min) DT
|
Start
|
94
|
2
|
2
|
Denaturing
|
94
|
1
|
1
|
Annealing
|
55
|
1
|
1
|
Elongation
|
72
|
1.5
|
0.5
|
GOTO 2
|
|
|
|
End
|
72
|
3
|
3
|
Hold
|
4
|
|
|
Results:
DT:
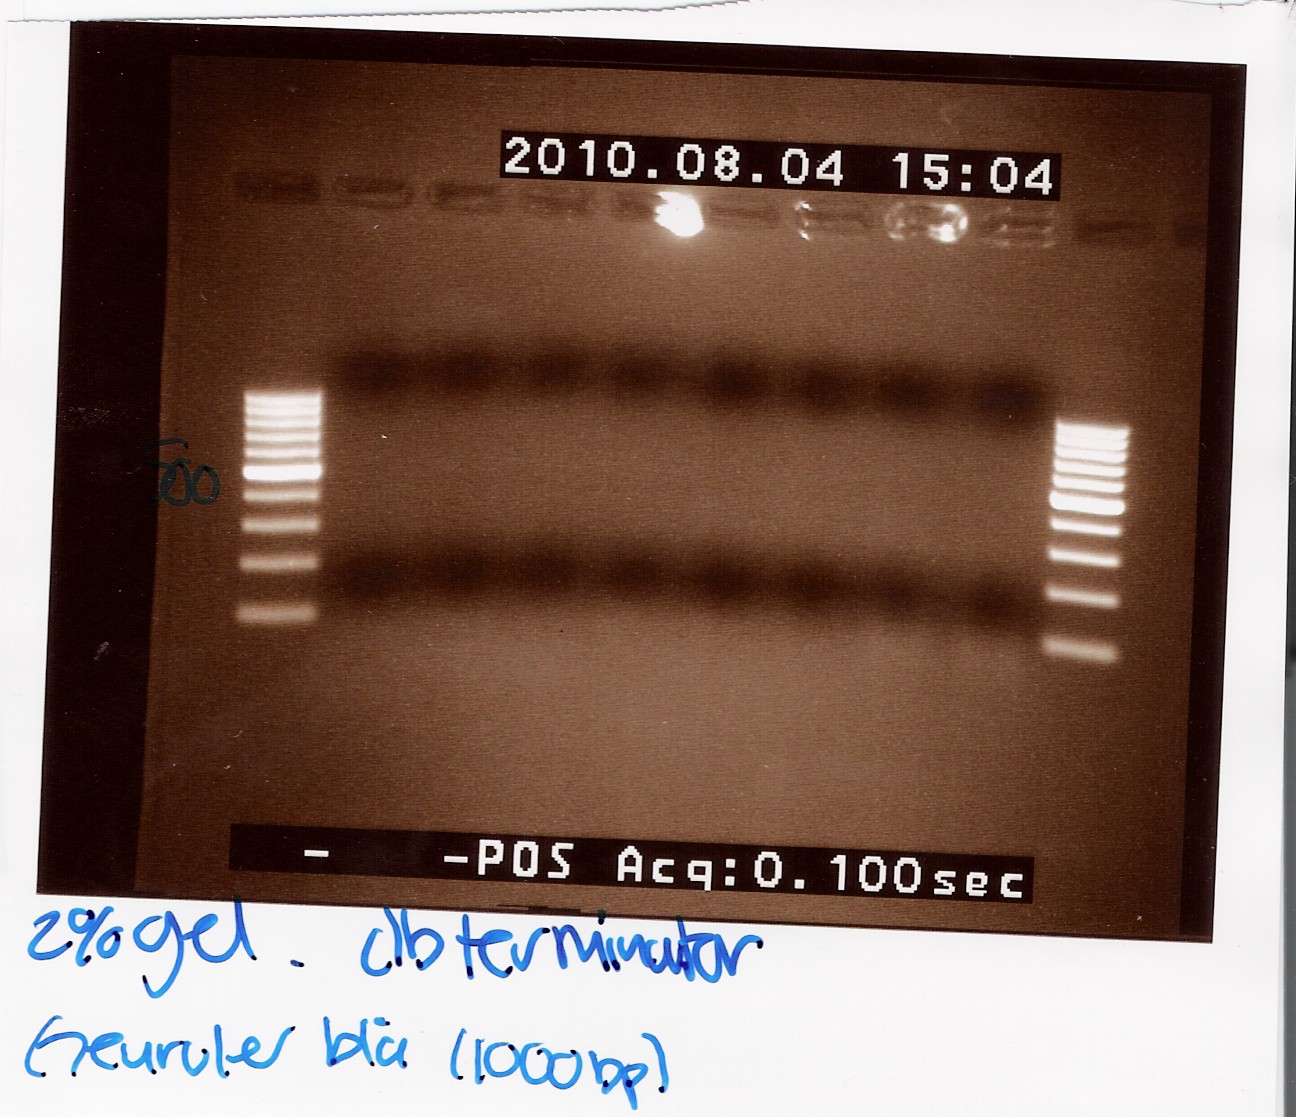
The double terminator was run on a 2% gel with a 100-1000 ladder. The gel shows no DNA at all!
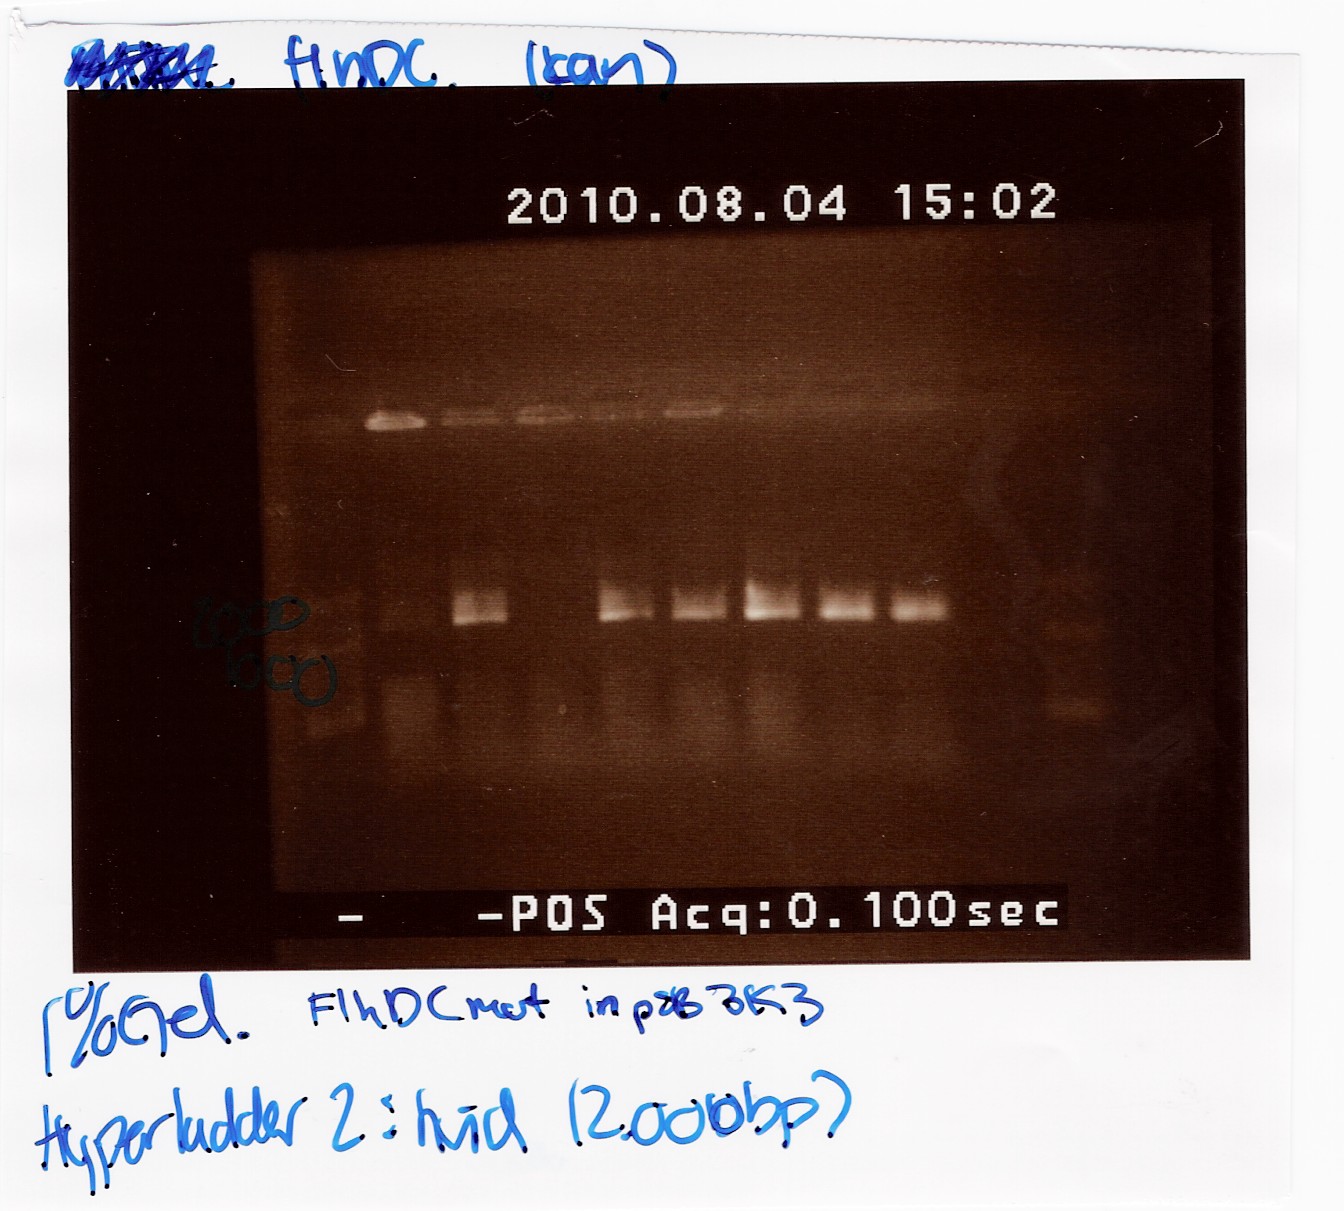
 FlhDCmut in pSB3k3:'
This was run on a 1% gel with a 50-2000bp ladder. The light in this picture is bad, but it does show high concentration of DNA in six of the eight ligations. The bands are positioned above 1000bp which is expected since the FlhDCmut gene with VF2-VR is 1248bp.
 FlhDCmut in pSB1c3:
Colony PCR of pSB3T3 w RFP(J04450)
Done by: Pernille
Date: August 10th
Protocol: CP1.1
Notes: The experiment was done with Taq will the purpose only was to check if the RFP was amplificated when using the primers VR og VF2. The PRC program used was c.f. the protocol but the elongation time was 1min and 30 sec while the biobrick in the pSB3T3 plamid are 1319bp long. For the PCR i used the mini prep product from freeze tube 29.
Results:
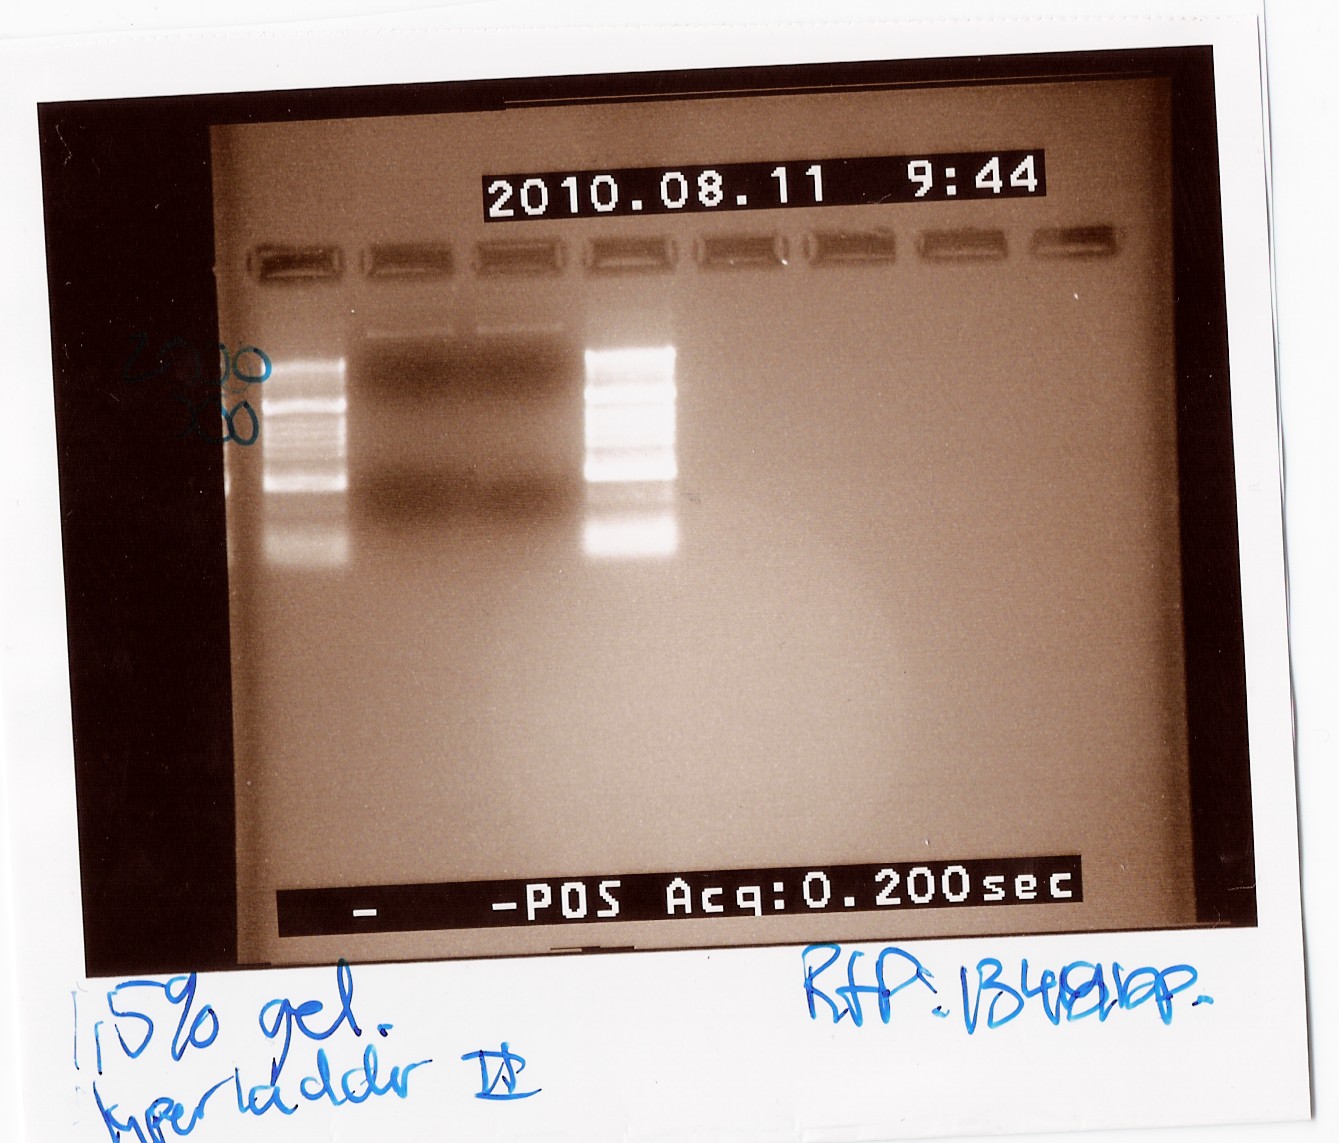
Unfortunately there was no band around 1400bp and therefore the amplification was not succeed. the upper band is probably the plamid.
--Pernm07 08:58, 11 August 2010 (UTC)
Colony PCR of pSB3C5 w RFP(J04450)
Done by: Pernille
Date: August 11th
Protocol: CP1.1
Notes: The experiment was done with Taq will the purpose only was to check if the RFP was amplificated when using the primers VR og VF2. The PRC program used was c.f. the protocol but the elongation time was 1min and 30 sec while the biobrick in the pSB3T3 plamid are 1319bp long. For the PCR i used the mini prep product from freeze tube 30.
Results:
Group: Photosensor
Restriction digest of PUC19 and the photosensor in pKJ606 with Nde1
Start date: 2/08 End date: 2/08
Methods: Restriction digest, gel electrophoresis
Protocol:RD1.1
Experiment done by: LC
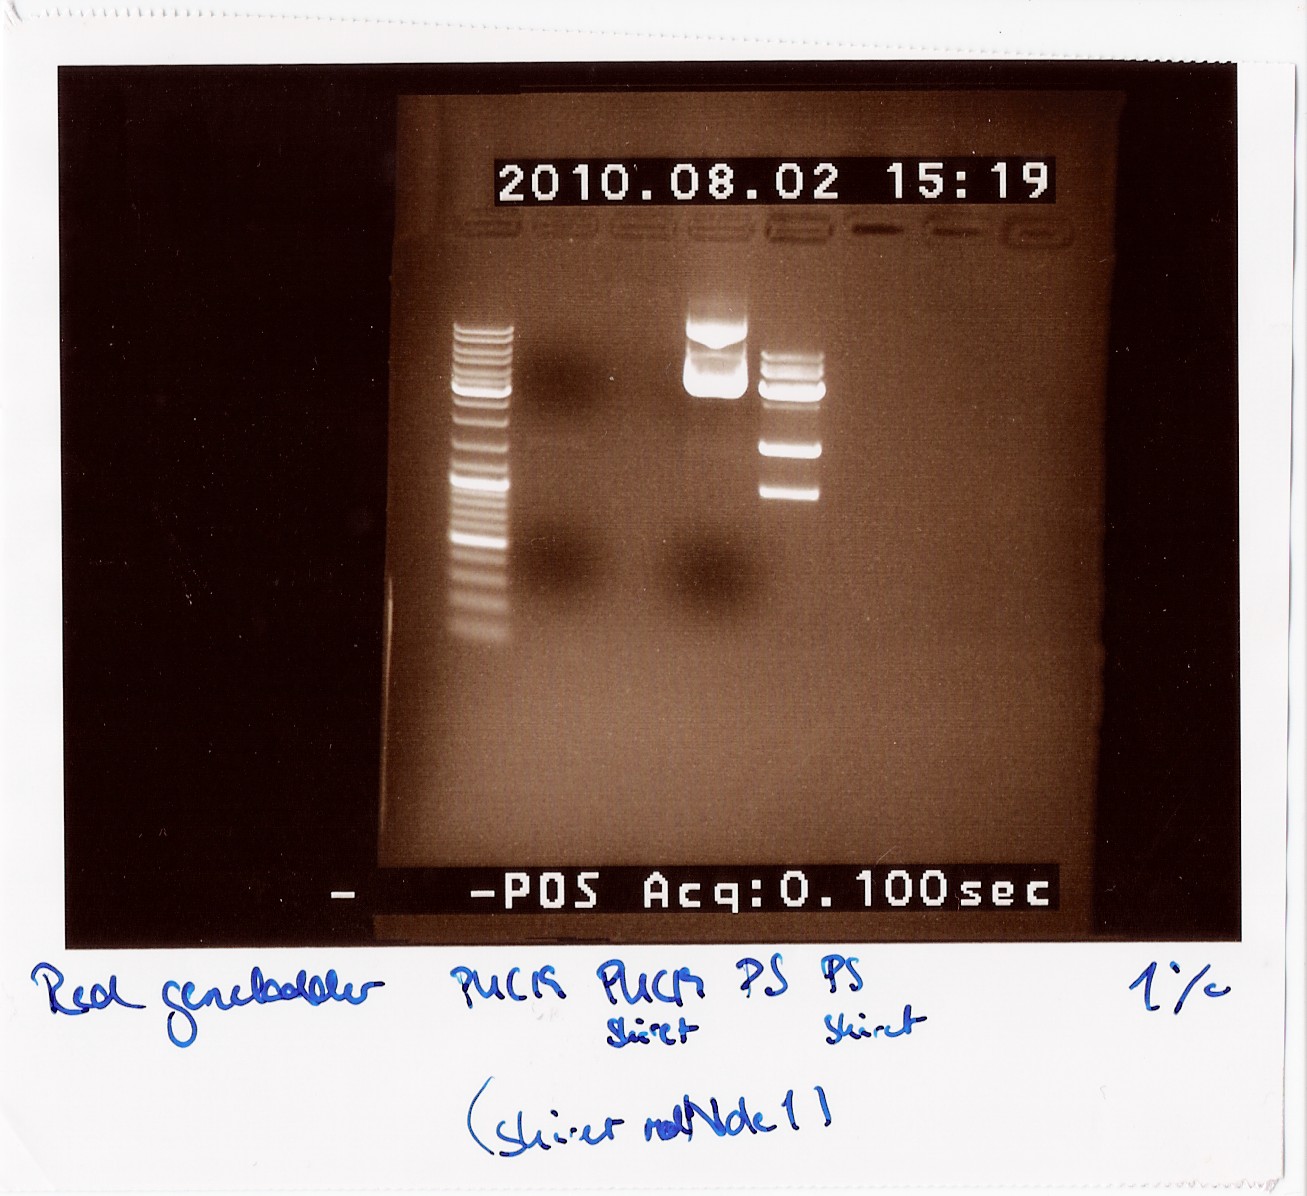
Notes: Since all PCR attempts with VF2 and VR had failed until now, we wanted to see if there was an insert at all in the physical DNA we received. Therefore we cut PUC19 and the photosensor to compare their lengths to each other, since the photosensor should be longer than PUC19 uncut and the cut photosensor should consist of two pieces, a 900 - 1000 BP piece and a 3600 BP piece.
Loading order:
1: PUC19 uncut
2: PUC19 cut
3: Photosensor uncut
4: Photosensor cut
Results:
Analysis:
We can clearly see that the photosensor uncut is longer than the uncut PUC19. We can also see multiple bands on the cut photosensor, which are the expected lengths. This indicates that the photosensor gene should be inserted between VF2 and VR, so we are still unsure why the PCR is not working.
Dreamtaq Green PCR Master Mix (2X) PCR on photosensor with VF2 and VR
Start date: 2/08 End date: 2/08
Methods: PCR, gel electrophoresis
Protocol: Dream TAQ Green PCR Master Mix protocol (modified)
Experiment done by: LC
Notes: Instead of a 50 µl reaction we ran a 25 µl reaction. It was mixed like this:
| Dream TAQ Master
Mix
|
12,5 µl
|
VF2
|
1 µl
|
VR
|
1 µl
|
Template
|
0,5 µl
|
Water
|
10 µl
|
We used a miniprep of the photosensor as template DNA, hence the small amount of template. The PCR program used was as follows:
Step
|
Temperature
|
Time
|
Number of cycles
|
Initial denaturation
|
95°
|
1 - 3 min
|
1
|
Denaturation
|
95°
|
1 min
|
30
|
Annealing
|
55°
|
1 min
|
30
|
Extension
|
72°
|
3 min
|
30
|
Final extension
|
72°
|
3 min
|
1
|
Results:
Analysis:
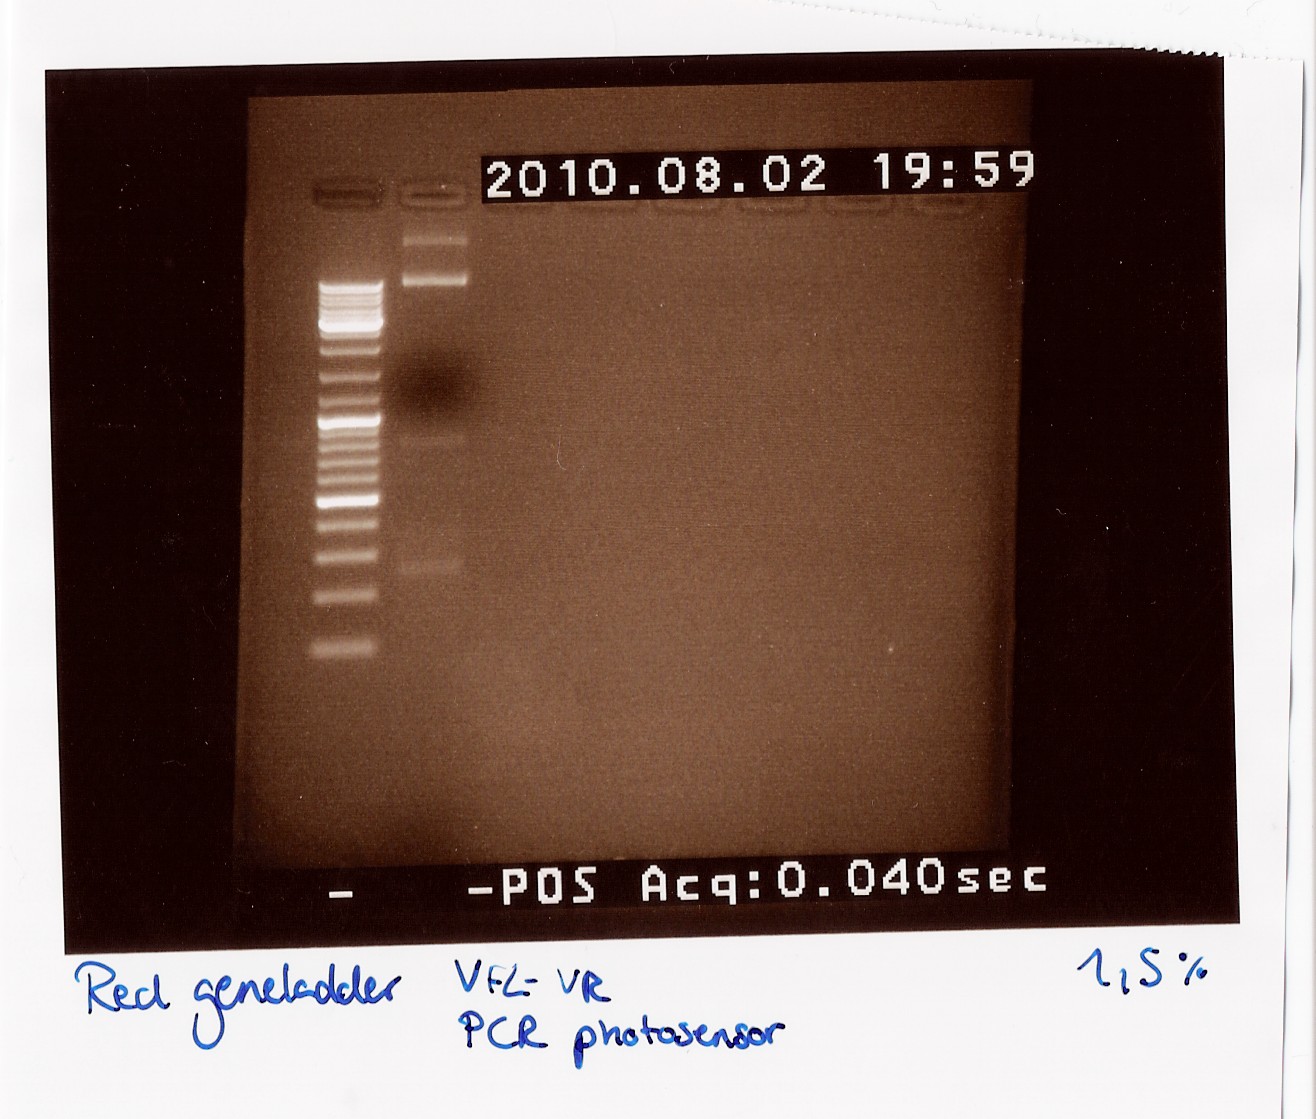
We got bands at 270 BP, 850 BP (the distance between VF2 and VR without insert) and two bands very high up in the gel (probably the template which did not get amplified and could not run through the 1,5% gel).
 "
"


