Team:Newcastle/5 August 2010
From 2010.igem.org
Swoodhouse (Talk | contribs) |
Swoodhouse (Talk | contribs) (→Solution for the problem) |
||
| Line 65: | Line 65: | ||
| - | [[Image:Newcastle 050810 PCR 100bp ladder.jpg]] | + | [[Image:Newcastle 050810 PCR 100bp ladder.jpg|500px]] |
{{Team:Newcastle/footer}} | {{Team:Newcastle/footer}} | ||
Revision as of 15:19, 5 August 2010

| |||||||||||||
| |||||||||||||
Contents |
Gel Electrophoresis for the Amplified Fragments of rocF
Aim
The aim of the experiment is to perform gel electrophoresis for all the 6 PCR reactions which took place yesterday 4th August, 2010 and thus confirm that all 6 PCR reactions were successful.
Materials and Protocol
Please refer to: Gel electrophoresis.
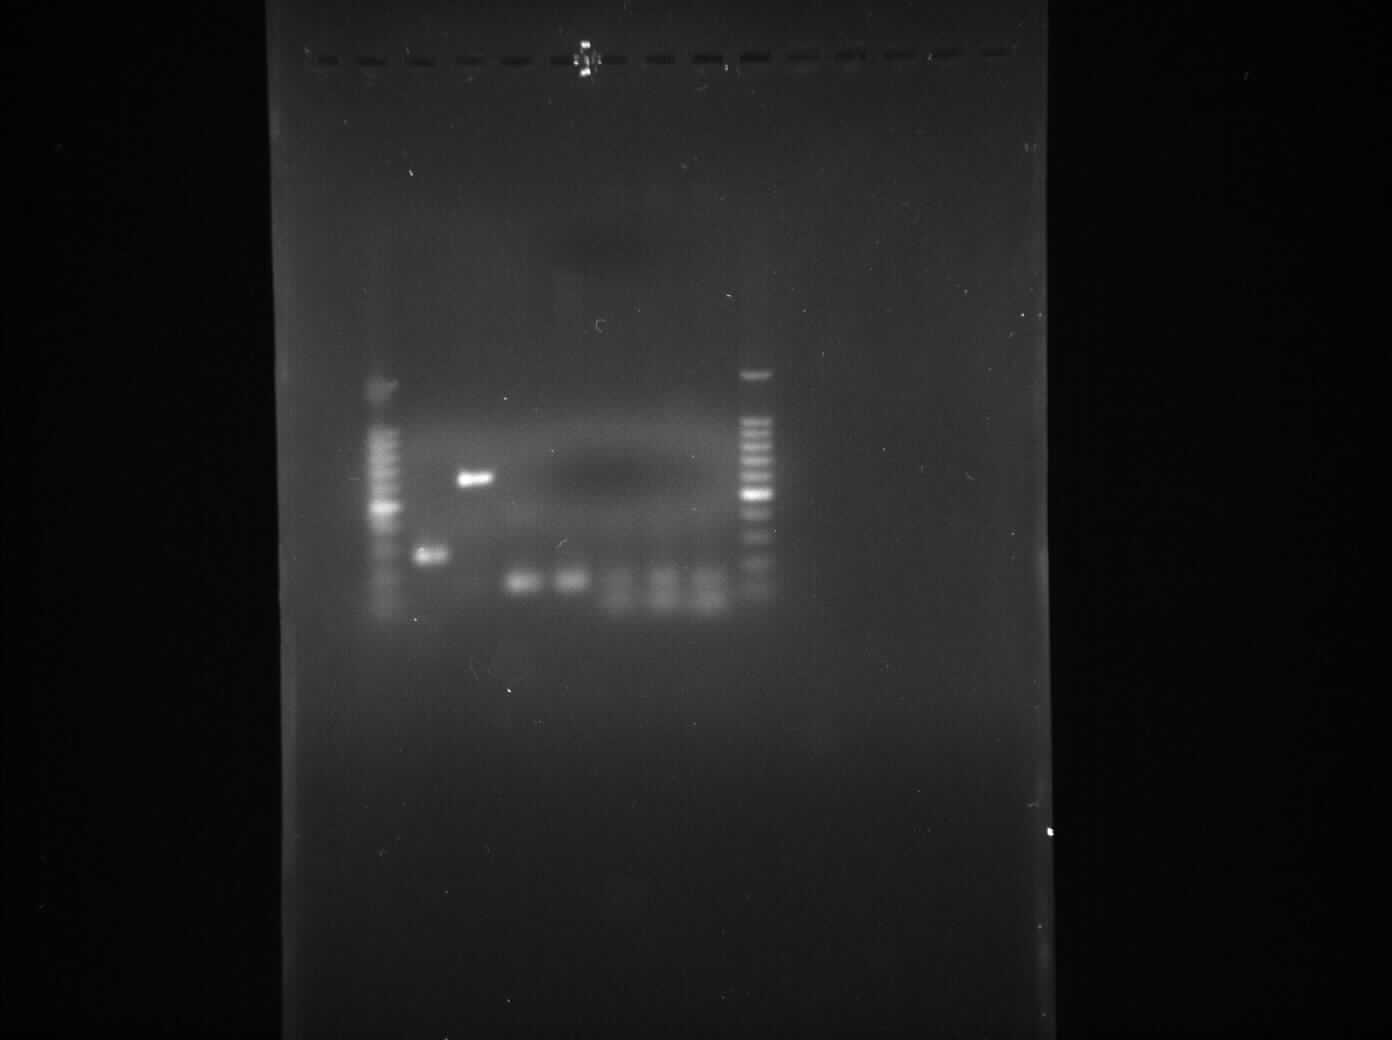
Result
- Lane 1: 1kb DNA ladder
- Lane 2: Extraction of pSB1C3 plasmid (No. 1)
- Lane 3: Extraction of pSB1C3 plasmid (No. 2)
- Lane 4: Extraction of pSB1C3 plasmid (No. 3)
- Lane 5: Extraction of pSB1C3 plasmid (No. 4)
- Lane 6: Extraction of plasmid containing lacI (No. 1)
- Lane 7: Extraction of plasmid containing lacI (No. 2)
- Lane 8: Extraction of pSB1AK3 plasmid containing double terminator (No. 1)
- Lane 9: Extraction of pSB1AK3 plasmid containing double terminator (No. 2)
| pSB1C3
(No. 1) | pSB1C3
(No. 2) | pSB1C3
(No. 3) | pSB1C3
(No. 4) | lacI
(No. 1) | lacI
(No. 2) | Double terminator
(No. 1) | Double terminator
(No. 2) |
|---|---|---|---|---|---|---|---|
| 44.0 µl/ml | 19.9 µl/ml | 25.0 µl/ml | 30.8 µl/ml | 10.0 µl/ml | 44.2 µl/ml | 9.2 µl/ml | 39.7 µl/ml |
Table 1: Nanodrop spectrophotometer experiment result. Table represents the amount of plasmid present in µl/ml quantity.
Discussion
We found bands in the lane 2, 3, 4, 5 and 6 showing the presence of plasmid in E. coli DH5α cells. The ideal concentration of DNA calculated using nanodrop experiment is 150 µg/ml but in the table 1, where all the values have been less than 150 µg/ml which shows that even though there is plasmid present in the cells but it is present in very low amount. Also while doing nanodrop experiment, we measured 260/280 nm ratio for all the samples came out to be between 2.0 to 2.4 approximately which shows that there is a high RNA contamination in the samples.
Conclusion
This experiment shows that there is plasmid present in the E. coli DH5α cells but they are present in a very low amount and having high RNA contamination possibly due to the following reasons:
- P1 buffer which contains RNAse might be contaminated.
- RNAse enzyme might have gotten inactive.
Solution for the problem
- If P1 buffer of the Qiagen miniprep kit is contaminated, then use a different kit. We have Promega miniprep kit which will be used tomorrow.
- If RNAse enzyme is inactive, then add extra RNAse into the P1 buffer. We would be adding 10 µl in the P1 buffer solution.
 
|
 "
"
