Team:TU Delft/Project/alkane-degradation/results/alkane hydroxylase
From 2010.igem.org
(→Resting-cell assays) |
|||
| Line 6: | Line 6: | ||
====Resting-cell assays==== | ====Resting-cell assays==== | ||
| - | The [https://2010.igem.org/Team:TU_Delft#page=Notebook/protocols&anchor=Resting-cell_assays_for_E.coli resting cell assays] were performed on our recombinant AH-carrying ''E.coli'' K12 cells ([http://partsregistry.org/Part:BBa_K398014 BBa_K398014]). 100 micromoles of octane was added to 6 mL of growth-stalled cells (1.5 mg cell dry weight total) and incubated at 37 degrees with shaking | + | The [https://2010.igem.org/Team:TU_Delft#page=Notebook/protocols&anchor=Resting-cell_assays_for_E.coli resting cell assays] were performed on our recombinant AH-carrying ''E.coli'' K12 cells ([http://partsregistry.org/Part:BBa_K398014 BBa_K398014]). 100 micromoles of octane was added to 6 mL of growth-stalled cells (1.5 mg cell dry weight total) and incubated at 37 degrees with shaking over night. The organic phase was [https://2010.igem.org/Team:TU_Delft#page=Notebook/protocols&anchor=Ethyl_acetate_extraction_protocol extracted] using EtOAc and analysed by [https://2010.igem.org/Team:TU_Delft#page=Notebook/protocols&anchor=General_gas_chromatography_program_for_alkanes_and_alkanols gas chromatography]. |
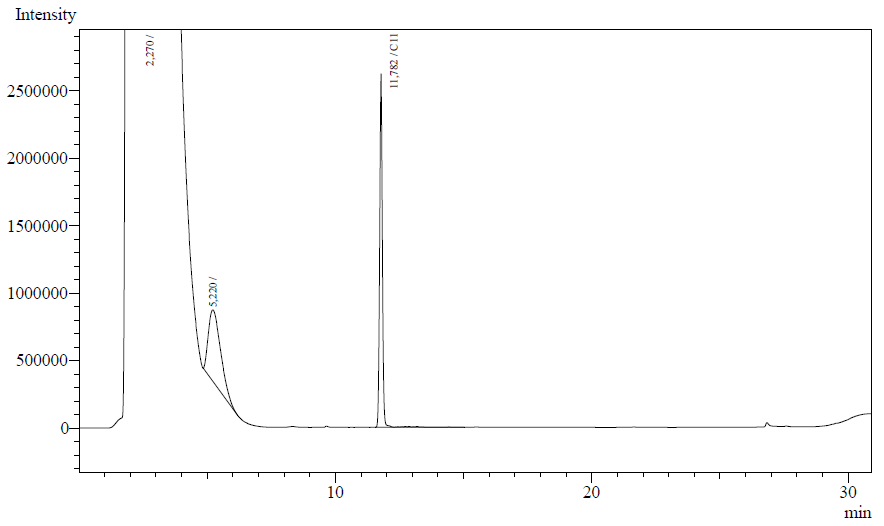
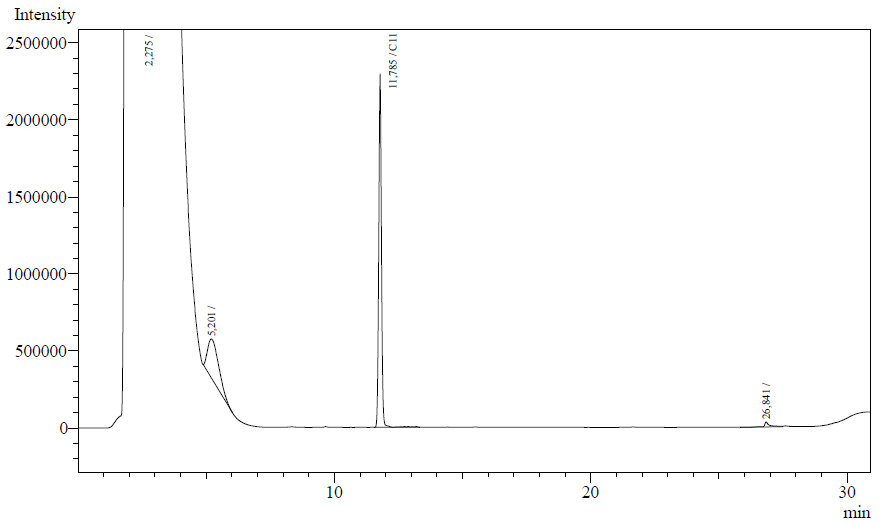
The following are examples of typical chromatographs obtained: | The following are examples of typical chromatographs obtained: | ||
| Line 33: | Line 33: | ||
|} | |} | ||
| - | The surface areas of the peaks correspond to the amount of molecules present in the sample. Due to the fact that many factors play a role in establishing an equilibrium between the aqueous and organic phase once the EtOAC is added, it's general procedure to add an internal standard to the EtOAc. In our experiment we decided to use a 0.1% vol/vol of undecane in EtOAc. The <b>ratio</b> between the surface areas of octane and undecane can now give an indication of the amount of octane still present in the sample and be very useful for comparisons between | + | The surface areas of the peaks correspond to the amount of molecules present in the sample. Due to the fact that many factors play a role in establishing an equilibrium between the aqueous and organic phase once the EtOAC is added, it's general procedure to add an internal standard to the EtOAc. In our experiment we decided to use a 0.1% vol/vol of undecane in EtOAc. The <b>ratio</b> between the surface areas of octane and undecane can now give an indication of the amount of octane still present in the sample and be very useful for comparisons between chromatograms. |
| - | The following table contains the average ratio of the hexadecane/undecane surface areas. | + | The following table contains the average ratio of the hexadecane/undecane surface areas. ''E.coli'' K12 strain #1 and #2 are positive colonies taken from the same plate. |
{| style="color:black; background-color:white;" cellpadding="5" cellspacing="0" border="1" | {| style="color:black; background-color:white;" cellpadding="5" cellspacing="0" border="1" | ||
| Line 74: | Line 74: | ||
|} | |} | ||
| - | From the | + | From the measurements it is clearly seen that the amount of octane is reduced for AH-carryign strains #1 and #2. The ratio of octane to the internal reference undecane is significantly different from the blank and negative control. Using a two-point calibration method, with 0 == 0 and the ratio found for the blank (0.898) set to the initial octane amount (16.2 uL, 99.7 umol), we can estimate the enzymatic activity of the AH-system. We know the reaction time (12 h.) and the mg of protein for each sample (using the conversion factor 0.41g/L/OD). See the table below for details. |
====Conclusions==== | ====Conclusions==== | ||
Revision as of 22:02, 27 October 2010
Characterization of the alkane hydroxylase system
Growth analysis
We attempted to culture our recombinant AH-carrying E.coli K12 strains ([http://partsregistry.org/Part:BBa_K398014 BBa_K398014]) on 1% v/v octanol or 1% v/v dodecane. Negligible growth was observed.
Resting-cell assays
The resting cell assays were performed on our recombinant AH-carrying E.coli K12 cells ([http://partsregistry.org/Part:BBa_K398014 BBa_K398014]). 100 micromoles of octane was added to 6 mL of growth-stalled cells (1.5 mg cell dry weight total) and incubated at 37 degrees with shaking over night. The organic phase was extracted using EtOAc and analysed by gas chromatography.
The following are examples of typical chromatographs obtained:
The peaks shown in the chromatographs belong to the following compounds:
| Retention time [min] | Compound |
| ~2.2 | Ethyl acetate (solvent) |
| ~5.2 | Octane (substrate) |
| ~11.8 | Undecane (internal standard, 0.1% v/v of solvent) |
The surface areas of the peaks correspond to the amount of molecules present in the sample. Due to the fact that many factors play a role in establishing an equilibrium between the aqueous and organic phase once the EtOAC is added, it's general procedure to add an internal standard to the EtOAc. In our experiment we decided to use a 0.1% vol/vol of undecane in EtOAc. The ratio between the surface areas of octane and undecane can now give an indication of the amount of octane still present in the sample and be very useful for comparisons between chromatograms.
The following table contains the average ratio of the hexadecane/undecane surface areas. E.coli K12 strain #1 and #2 are positive colonies taken from the same plate.
| Strain | Ratio octane/undecane | Standard deviation [%] | Octane converted [umol] | Protein [mg] | Enzymatic activity [U/mg protein] |
| Blank | 0.832 | 6.16 | 0.00 | 0.00 | 0.00 |
| E.coli K12 negative control | 0.821 | 13.3 | 1.34 | 1.51 | 1.23E-3 |
| E.coli K12 strain #1 (AH-system) | 0.652 | 14.4 | 21.6 | 1.70 | 1.77E-2 |
| E.coli K12 strain #2 (AH-system) | 0.439 | 3.96 | 47.0 | 1.46 | 4.49E-2 |
From the measurements it is clearly seen that the amount of octane is reduced for AH-carryign strains #1 and #2. The ratio of octane to the internal reference undecane is significantly different from the blank and negative control. Using a two-point calibration method, with 0 == 0 and the ratio found for the blank (0.898) set to the initial octane amount (16.2 uL, 99.7 umol), we can estimate the enzymatic activity of the AH-system. We know the reaction time (12 h.) and the mg of protein for each sample (using the conversion factor 0.41g/L/OD). See the table below for details.
Conclusions
We've succeeded in characterizing the activity of the alkane hydroxylase system using gas chromatography. By comparing peak ratios we were able to estimate the specific enzymatic activity of the system. The lack of an octanol peak in the GC-graphs above could be caused by the octanol being trapped by the cell, and thus not showing up in the organic (EtOAc) phase. Another likely explanation is that the octanol is readily converted by an aspecific alcohol dehydrogenase native to the E.coli K12 strain. In the future we would like to perform a resting-cell assay using P. putida and determine the enzymatic activity needed to support growth. A comparison of this natural-degrader value with the biological activity we've found of 0.045 U/mg would give more information on the growth feasibility of a strain carring the AH-system BioBrick on octane. Furthermore, a study could be done on the AH-system over time to find out more information on the kinetics of the system.
 "
"


