Team:BCCS-Bristol/Wetlab/difference soil
From 2010.igem.org
| Line 18: | Line 18: | ||
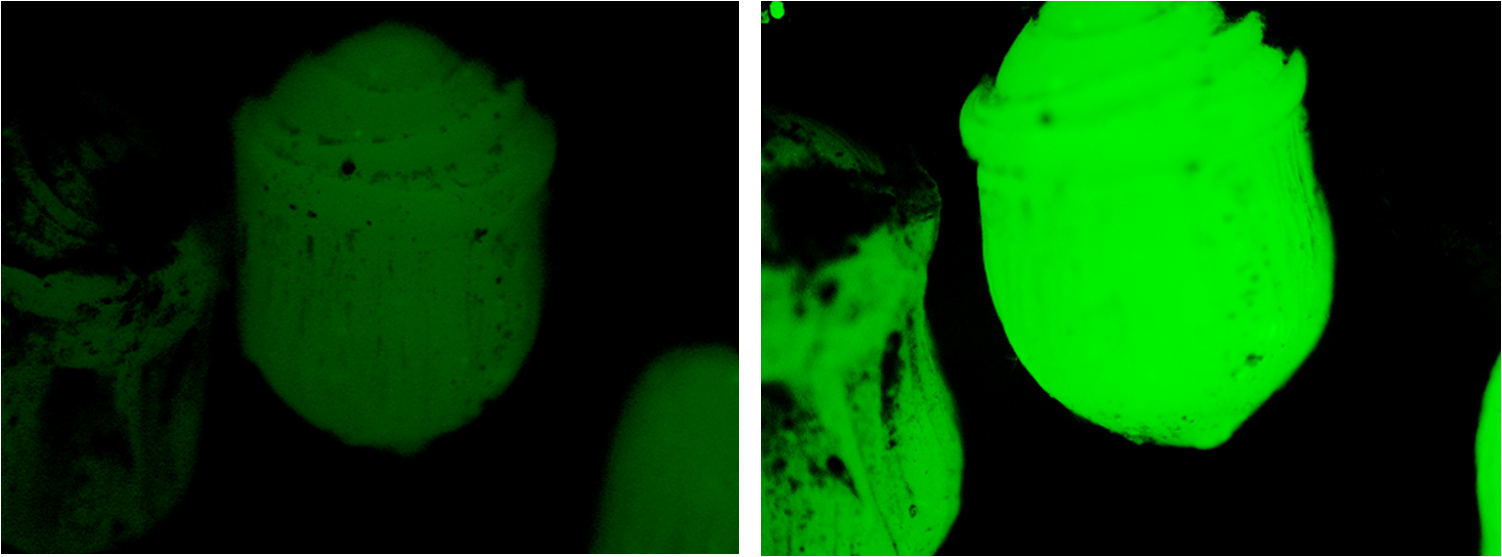
We were pleased to note that the beads subjected to nitrogen were fluorescing considerably more than they had been 24 hours earlier, as is evident in the figure below. | We were pleased to note that the beads subjected to nitrogen were fluorescing considerably more than they had been 24 hours earlier, as is evident in the figure below. | ||
| - | |||
[[Image:Bead diff.png|centre|500px]] | [[Image:Bead diff.png|centre|500px]] | ||
| - | |||
ImageJ analysis of the data indicates an increase in fluorescence by a factor of 2.16; an extremely satisfying result. | ImageJ analysis of the data indicates an increase in fluorescence by a factor of 2.16; an extremely satisfying result. | ||
Unfortunately, we realised it was not possible to compare different beads due to probable differences in the number of bacteria encapsulated. It was for this reason that we decided to implement our ratio method. | Unfortunately, we realised it was not possible to compare different beads due to probable differences in the number of bacteria encapsulated. It was for this reason that we decided to implement our ratio method. | ||
Latest revision as of 19:03, 27 October 2010
iGEM 2010
Testing Beads in Soil
Motivation and Experiments
Having determined the beads were functional in solution, we then wanted to examine their behaviour on soil.
Beads encapsulating MG1655 transformed with BBa_K381001 were placed on soil saturated with 6mL of ddH2O and soil saturated in 6mL of 20mM of Potassium Nitrate. These beads were immediately photographed using the stereomicroscope and a CCD, then left for 24 hours under conditions mimicking day progression (light/ dark oscillations).
The same beads were then photographed again and the images analysed using the [http://rsbweb.nih.gov/ij/ ImageJ software package].
Results
We were pleased to note that the beads subjected to nitrogen were fluorescing considerably more than they had been 24 hours earlier, as is evident in the figure below.
ImageJ analysis of the data indicates an increase in fluorescence by a factor of 2.16; an extremely satisfying result.
Unfortunately, we realised it was not possible to compare different beads due to probable differences in the number of bacteria encapsulated. It was for this reason that we decided to implement our ratio method.
 "
"
