Team:Heidelberg/Notebook/Methods
From 2010.igem.org
(→Plate reader measurements) |
(→Microscopy) |
||
| Line 218: | Line 218: | ||
=== Microscopy === | === Microscopy === | ||
| - | + | We used microscopy to measure GFP and BFP fluorescence intensity. Fluorescence was first evaluated using the Leica DM IRB epifluorescence microscope. Only cells which were transfected successfully were measured. First, the cells were washed with 1x PBS and detached from the plate using trypsin. 30µl trypsin was added to each well, incubated for ten minutes at room temperature. Cells were resuspended in 170µl 1%BSA in PBS and replicates for each condition were pooled into 24 well plates. 100-150µl were used for confocal microscopy. | |
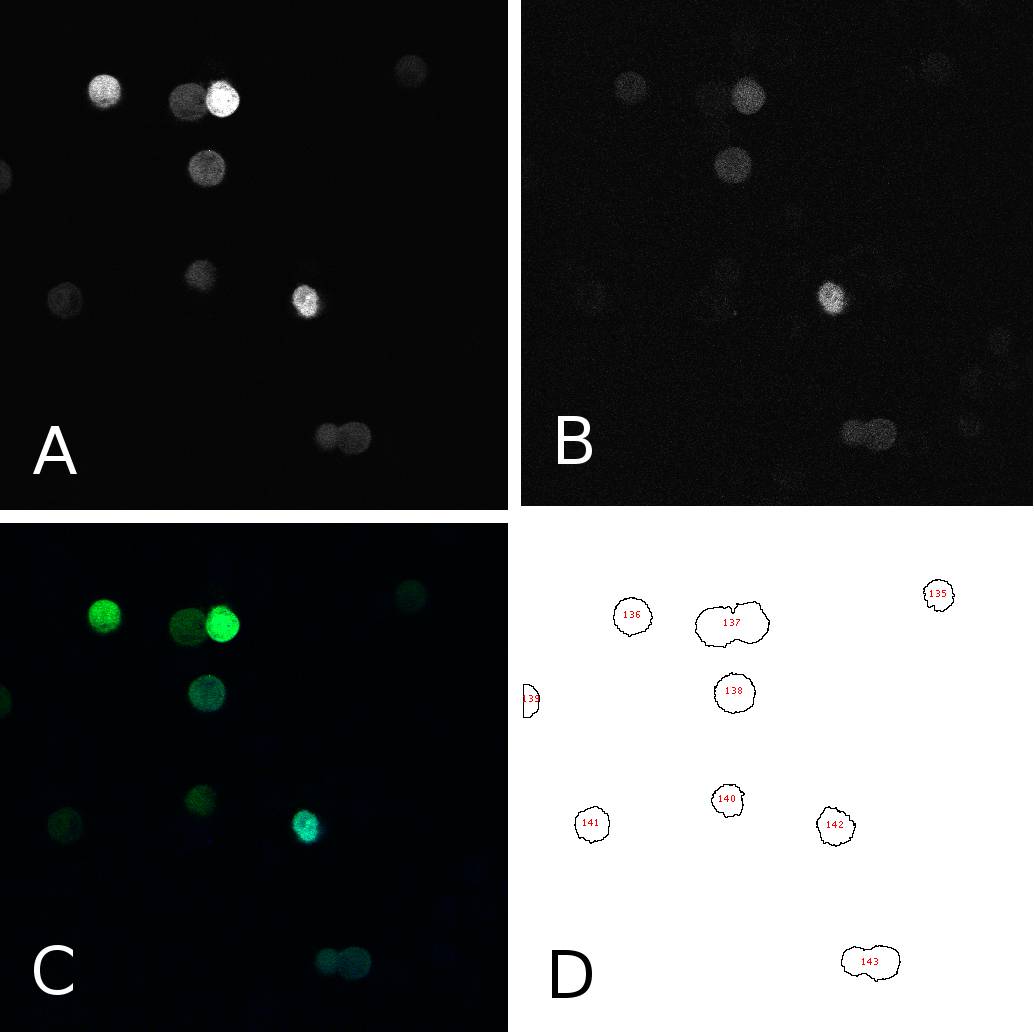
Single images were obtained using the Leica TCS SP5 confocal microscope and camera with the Leica AF6000 imaging software. GFP fluorescence was excited by Argon 488nm laser and measured at 520-560nm, BFP fluorescence was excited by UV laser at 405nm and measured at 440-460nm. Pictures were taken sequentially line by line in three different channels for GFP, BFP and bright field. | Single images were obtained using the Leica TCS SP5 confocal microscope and camera with the Leica AF6000 imaging software. GFP fluorescence was excited by Argon 488nm laser and measured at 520-560nm, BFP fluorescence was excited by UV laser at 405nm and measured at 440-460nm. Pictures were taken sequentially line by line in three different channels for GFP, BFP and bright field. | ||
| Line 225: | Line 225: | ||
[[Image:panel.jpg|thumb|400px|center|'''HeLa cells two days after transfection with miMeasure''' (A) fluorescence signal GFP channel, 8bit; (B) fluorescence signal BFP channel, 8bit; (C) merge of channels A and B, RGB (D) cells after segmentation and automated cell counting and annotation]] | [[Image:panel.jpg|thumb|400px|center|'''HeLa cells two days after transfection with miMeasure''' (A) fluorescence signal GFP channel, 8bit; (B) fluorescence signal BFP channel, 8bit; (C) merge of channels A and B, RGB (D) cells after segmentation and automated cell counting and annotation]] | ||
| - | To analyze the fluorescence of single cells, we segmented the images using ImageJ. In 8bit pictures, we set the threshold for each channel to 50, thereby filtering the background. This | + | To analyze the fluorescence of single cells, we segmented the images using ImageJ. In 8bit pictures, we set the threshold for each channel to 50, thereby filtering the background. This allowed us to annotate cells automatically using the “analyze particles” tool. Then we were able to get the fluorescence intensity for each single cell on each channel (GFP or BFP) as an 8bit output, i.e. a value between 50 and 255. Panel 1 shows an example of one such image in different channels and after segmentation. From the data thus obtained, we calculated the GFP:BFP ratios for each cell using a simple algorithm. This enables us to visualize the mean of these ratios in a bar plot or to use all the data for linear regression curve calculation. |
* Consumables and Chemicals | * Consumables and Chemicals | ||
| Line 238: | Line 238: | ||
ImageJ version 1.43<br> | ImageJ version 1.43<br> | ||
<br> | <br> | ||
| + | |||
=== Dual Luciferase Assay === | === Dual Luciferase Assay === | ||
We measured the knockdown of firefly luciferase using the [http://www.promega.com/tbs/tm046/tm046.pdf Promega Dual Luciferase Reporter Assay]. | We measured the knockdown of firefly luciferase using the [http://www.promega.com/tbs/tm046/tm046.pdf Promega Dual Luciferase Reporter Assay]. | ||
Revision as of 22:25, 26 October 2010

|
|
||||||||||||||||||||||||||||||||||||||||||||||||||||
 "
"
