Team:Imperial College London/Modelling
From 2010.igem.org
(Difference between revisions)
(Updating amplification diagrams) |
(Updating the AIP threshold grpah) |
||
| Line 48: | Line 48: | ||
{| style="background:#e7e7e7;text-align:center;font-family: helvetica, arial, sans-serif;color:#555555;margin- top:5px;padding: 2px;" cellspacing="5"; | {| style="background:#e7e7e7;text-align:center;font-family: helvetica, arial, sans-serif;color:#555555;margin- top:5px;padding: 2px;" cellspacing="5"; | ||
|- | |- | ||
| - | | | + | |[[Image:AIP_concentration_vs_time.png|400px]] |
| - | + | ||
| - | + | ||
|- | |- | ||
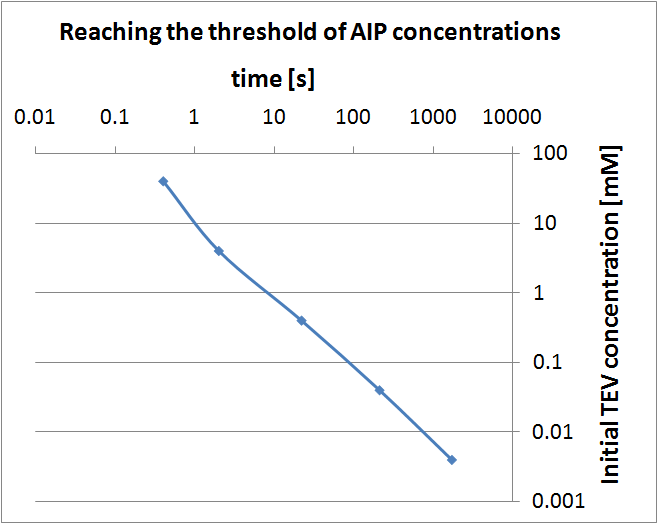
|Graph showing when threshold AIP concentration is reached <br/>(for different initial TEV concentrations). Notice log-log scale. | |Graph showing when threshold AIP concentration is reached <br/>(for different initial TEV concentrations). Notice log-log scale. | ||
Revision as of 14:53, 21 October 2010
| Temporary sub-menu: Output Amplification Model; Surface Protein Model; Wet-Dry Lab Interaction; Dry Lab Diary; |
| Introduction to modelling |
In the process of designing our construct two major questions arose which could be answered by computer modelling:
|
| Results & Conclusions |
Output Amplification Model
|
 "
"


