Team:TU Delft/Project/solubility/results
From 2010.igem.org
(→Results) |
|||
| Line 30: | Line 30: | ||
The total volume of sample at the end after completion of the isolation protocol was 3 mL. The protein concentration was determined by Bradford analysis and showed that the control contained 19 mg mL<sup>-1</sup> and the AlnA sample contained 16 mg mL<sup>-1</sup>. | The total volume of sample at the end after completion of the isolation protocol was 3 mL. The protein concentration was determined by Bradford analysis and showed that the control contained 19 mg mL<sup>-1</sup> and the AlnA sample contained 16 mg mL<sup>-1</sup>. | ||
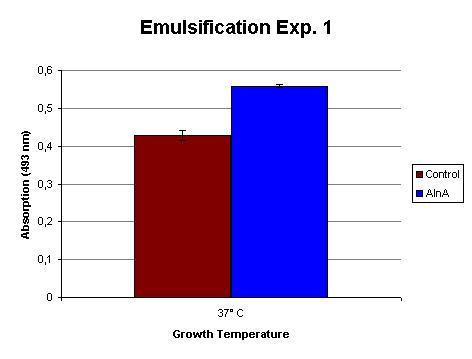
| - | The emulsification capacity of the samples was determined using our emulsifier assay. 0.75 mg protein was used in the assay displayed in Figure 2. The increase in absorption by the AlnA sample indicates a higher amount of Sudan II that is in solution, thus a higher emulsification by the proteins. | + | The emulsification capacity of the samples was determined using our emulsifier assay. 0.75 mg protein was used in the assay displayed in Figure 2. The 30% increase in absorption by the AlnA sample indicates a higher amount of Sudan II that is in solution, thus a higher emulsification by the proteins. A statistical T test shows that this is a significant increase (p = 3 x 10<sup>-3</sup>). |
[[Image:TU_Delft_Emuls_assay_exp1.jpg|thumb|400px|center|''Figure 2'': Emulsification of Sudan II by the isolated proteins from the control and AlnA culture. The measurements are corrected for background absorption caused by the sample itself and dissolved Sudan II without the addition of protein. The assay was done in triplo.]] | [[Image:TU_Delft_Emuls_assay_exp1.jpg|thumb|400px|center|''Figure 2'': Emulsification of Sudan II by the isolated proteins from the control and AlnA culture. The measurements are corrected for background absorption caused by the sample itself and dissolved Sudan II without the addition of protein. The assay was done in triplo.]] | ||
Revision as of 11:33, 20 October 2010
Hydrocarbon Solubility Results & Conclusions
Our goal was to enhance the solubility of alkanes in water. Therefore we constructed a new part that expresses the emulsifier protein AlnA after induction by IPTG. By using our own emulsification assay we measured the increase in hydrophobic compounds in the water phase.
Results
For the production of large amounts of protein, 1 L shake flasks cultures were induced with IPTG after the OD measuremnts started to show the start of the exponential phase. The experiment was done 3 seperate times.
Experiment 1
This was the first time the experiment was done in a large volume (1 L) and carried out at 37 C. The OD measurements at the induction time point and harvest are shown in Table 1.
| # | Culture | OD600 at induction | OD600 at harvest |
| 1 | Control (J13002) 37 C | 0.367 | 0.882 |
| 2 | AlnA (K398206) 37 C | 0.434 | 0.880 |
The total volume of sample at the end after completion of the isolation protocol was 3 mL. The protein concentration was determined by Bradford analysis and showed that the control contained 19 mg mL-1 and the AlnA sample contained 16 mg mL-1.
The emulsification capacity of the samples was determined using our emulsifier assay. 0.75 mg protein was used in the assay displayed in Figure 2. The 30% increase in absorption by the AlnA sample indicates a higher amount of Sudan II that is in solution, thus a higher emulsification by the proteins. A statistical T test shows that this is a significant increase (p = 3 x 10⁻³).
Experiment 2
The second experiment was carried out at 37 C and 30 C. This was done, because it was expected that IPTG causes a stronger induction at lower temperatures. The OD measurements at the induction time point and harvest are shown in Table 2.
| # | Culture | OD600 at induction | OD600 at harvest |
| 1 | Control (J13002) 30 C | 0.073 | 0.451 |
| 2 | Control (J13002) 37 C | 0.088 | 0.810 |
| 3 | AlnA (K398206) 30 C | 0.060 | 0.393 |
| 4 | AlnA (K398206) 37 C | 0.067 | 0.624 |
Conclusions
jadie jadie jadie
 "
"
