Team:Heidelberg/Project/miMeasure
From 2010.igem.org
(→Abstract) |
(→Abstract) |
||
| Line 10: | Line 10: | ||
Recent advances in gene therapy approaches have seen rising importance of small RNA molecules. The identification and characterization of miRNAs and their respective binding sites are therefore becoming crucial for innovative applications. In order to exploit the miRNA ability to target and regulate specific genes, we constructed a measurement standard not only able to characterize existing miRNAs but also to validate potential synthetic miRNAs for new therapeutic approaches. The synthetic miRNAs we have created are inert to endogenous targets and thus applicable for gene regulation without direct side effects. This opens new possibilities for precise gene expression tuning, especially in quantitative means. | Recent advances in gene therapy approaches have seen rising importance of small RNA molecules. The identification and characterization of miRNAs and their respective binding sites are therefore becoming crucial for innovative applications. In order to exploit the miRNA ability to target and regulate specific genes, we constructed a measurement standard not only able to characterize existing miRNAs but also to validate potential synthetic miRNAs for new therapeutic approaches. The synthetic miRNAs we have created are inert to endogenous targets and thus applicable for gene regulation without direct side effects. This opens new possibilities for precise gene expression tuning, especially in quantitative means. | ||
Our [https://2010.igem.org/Team:Heidelberg/Parts#final_constructs miMeasure] construct plasmid (see sidebar) normalizes knockdown of the green fluorescent protein (EGFP) to the blue fluorescent protein (EBFP2). This allows for an accurate study of binding site properties, since both fluorescent proteins are combined in the same construct and driven by the same [http://partsregistry.org/Part:BBa_K337017 bidirectional promoter]. Another advantage is that any desired binding site can be cloned easily into the miMeasure plasmid with the [http://dspace.mit.edu/handle/1721.1/45139 BB-2 standard]. As the binding site is inserted downstream of EGFP, the regulation of EGFP expression is to be expected. | Our [https://2010.igem.org/Team:Heidelberg/Parts#final_constructs miMeasure] construct plasmid (see sidebar) normalizes knockdown of the green fluorescent protein (EGFP) to the blue fluorescent protein (EBFP2). This allows for an accurate study of binding site properties, since both fluorescent proteins are combined in the same construct and driven by the same [http://partsregistry.org/Part:BBa_K337017 bidirectional promoter]. Another advantage is that any desired binding site can be cloned easily into the miMeasure plasmid with the [http://dspace.mit.edu/handle/1721.1/45139 BB-2 standard]. As the binding site is inserted downstream of EGFP, the regulation of EGFP expression is to be expected. | ||
| - | The knockdown percentage of each modified binding site can be calculated by the ratio of EGFP to EBFP2. The ratio is obtained from linear regression analysis and therefore the knock-down efficiency can be determined by various basic methods e.g. [https://2010.igem.org/Team:Heidelberg/Notebook/Material_Methods#Microscopy microscopy] or [https://2010.igem.org/Team:Heidelberg/Notebook/Material_Methods# | + | The knockdown percentage of each modified binding site can be calculated by the ratio of EGFP to EBFP2. The ratio is obtained from linear regression analysis and therefore the knock-down efficiency can be determined by various basic methods e.g. [https://2010.igem.org/Team:Heidelberg/Notebook/Material_Methods#Microscopy microscopy] or [https://2010.igem.org/Team:Heidelberg/Notebook/Material_Methods#Flow_cytometry flow cytometry]. |
==Introduction== | ==Introduction== | ||
Revision as of 22:26, 27 October 2010

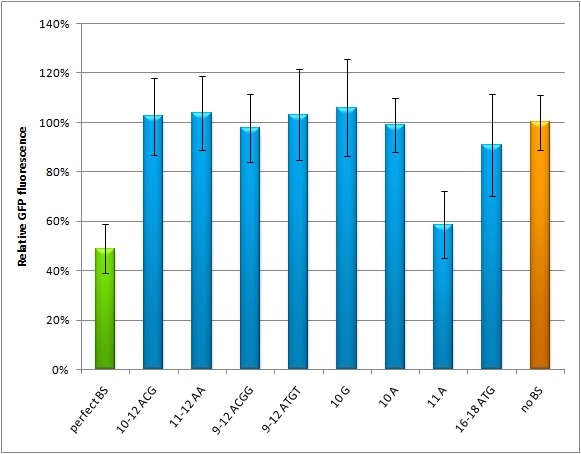
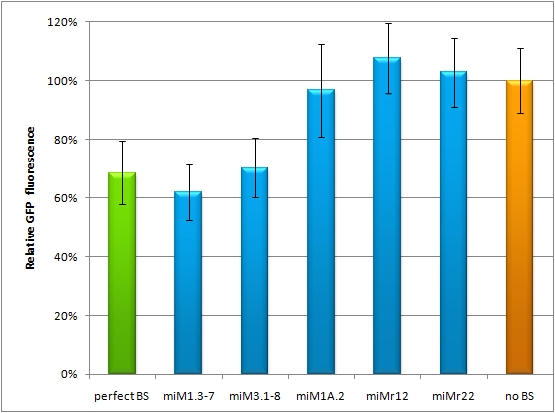
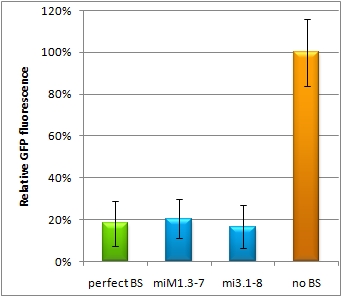
miMeasureAbstractRecent advances in gene therapy approaches have seen rising importance of small RNA molecules. The identification and characterization of miRNAs and their respective binding sites are therefore becoming crucial for innovative applications. In order to exploit the miRNA ability to target and regulate specific genes, we constructed a measurement standard not only able to characterize existing miRNAs but also to validate potential synthetic miRNAs for new therapeutic approaches. The synthetic miRNAs we have created are inert to endogenous targets and thus applicable for gene regulation without direct side effects. This opens new possibilities for precise gene expression tuning, especially in quantitative means. Our miMeasure construct plasmid (see sidebar) normalizes knockdown of the green fluorescent protein (EGFP) to the blue fluorescent protein (EBFP2). This allows for an accurate study of binding site properties, since both fluorescent proteins are combined in the same construct and driven by the same [http://partsregistry.org/Part:BBa_K337017 bidirectional promoter]. Another advantage is that any desired binding site can be cloned easily into the miMeasure plasmid with the [http://dspace.mit.edu/handle/1721.1/45139 BB-2 standard]. As the binding site is inserted downstream of EGFP, the regulation of EGFP expression is to be expected. The knockdown percentage of each modified binding site can be calculated by the ratio of EGFP to EBFP2. The ratio is obtained from linear regression analysis and therefore the knock-down efficiency can be determined by various basic methods e.g. microscopy or flow cytometry. IntroductionMicro RNAs regulate mainly the translation of their target genes by preferably interacting with regions in the 3’ untranslated region (UTR) of their target mRNA. Base-pairing with the miRNA binding site (BS) causes formation of diverse miRNA-mRNA duplexes [http://2010.igem.org/Team:Heidelberg/Project/miMeasure#References (reviewed by Fabian et al., 2010)]. The BS consists of a seven nucleotide long seed region that is perfectly matched to the miRNA, and surrounding regions that matched partially. The seed region is defined as being the minimal required base-pairing that can regulate the mRNA. Apart from the seed region, binding can be unspecific, creating mismatches and bulges. The position and properties of the bulges seem to play a central role in miRNA binding and therefore knockdown efficiency [http://2010.igem.org/Team:Heidelberg/Project/miMeasure#References (reviewed by Bartel et al., 2009)]. Since we were going to use synthetic miRNA BS in our genetherapeutic approach, we had to find a way to study their effects in a standardized manner that would be comparable and reproducible. One goal of the iGEM Team Heidelberg 2010 was to test the effects of changes in BS sequences on expression control. Thereby miRNA BS should be characterized. To standardize our measurements of knockdown according to BS specificity, we had to come up with a new standard that is independent from the endogenous cell machinery. We decided to bring synthetic miRNAs into play, hence we engineered BS for them creating an artificial regulatory circuit. Of course there are also differences that arise through the availability of the enzymes involved in the miRNA pathway that may differ slightly from cell to cell. Therefore, we also measured the knockdown achieved by the perfect binding site and set this as 100% knockdown efficiency. Ideally, the miRNA would be stably expressed in the cell line, but a uniform co-transfection also leads to an even distribution of synthetic shRNA-like miRNAs (shRNA miRs). Additionally, miRNA levels can be adjusted by differing transfection ratios. The main purpose of our measurement standard, miMeasure, is to express two nearly identical but discernible proteins: one of them tagged with a BS, the other one unregulated (even though the possibility exists to clone in a reference binding site). The two reporters are expressed by a bidirectional CMV promoter to make sure their transcription rate is comparable. We used a destabilized version of GFP, dsEGFP and a dsEBFP2 that was derived from the same sequence (Ai et al., 2007). Thus, we could make sure that both proteins exhibit the same synthesis and degradation properties, making them directly comparable. Hereby, we can also neglect the difference between mRNA and protein knockdown and can take the fluorescence of the marker protein as a direct, linear output of mRNA down-regulation. We included a BBb standard site into our plasmid, which allows to clone BS behind the GFP. If co-transfected with the corresponding shRNA miR, GFP will be down-regulated, while BFP expression is maintained. The ratio of GFP to BFP expression can be used to conclude the knockdown efficiency (in percent, compared to perfect binding site=100% and no binding site=0%) of the BS. Having destabilized marker proteins with a turnover time of two hours enables us not only to avoid accumulation of marker proteins, which would make the knockdown harder to observe, but also to conduct time-lapse experiments. In the future, this could be for example a way to observe dynamic activity patterns of endogenous miRNAs. ResultsAnalysis of Randomized Binding Sites Against Synthetic miRNAConfocal microscopy measurementsWe used microscopy analysis to determine the EGFP expression in relation to EBFP2. EBFP2 serves as a normalization for transfection efficiency. Nine miMeasure constructs with different binding sites were designed. Those were cloned downstream of EGFP behind the miMeasure construct, whereas the EBFP2 expression stays unaffected. The GFP/BFP-ratio stand for the level of GFP-expression normalized to one copy per cell. We modified binding sites for the synthetic miRNA by introducing random basepairs surrounding the seed region as described above, thereby changing the knockdown efficiency. In figure 1 we plotted the knockdown percentage of our constructs. The miMeasure construct and negative control were co-transfected with either shRNA miRsAg expressed from a CMV promoter on pcDNA5 or an inert synthetic RNA as control in 1:4 ratio, respectively.
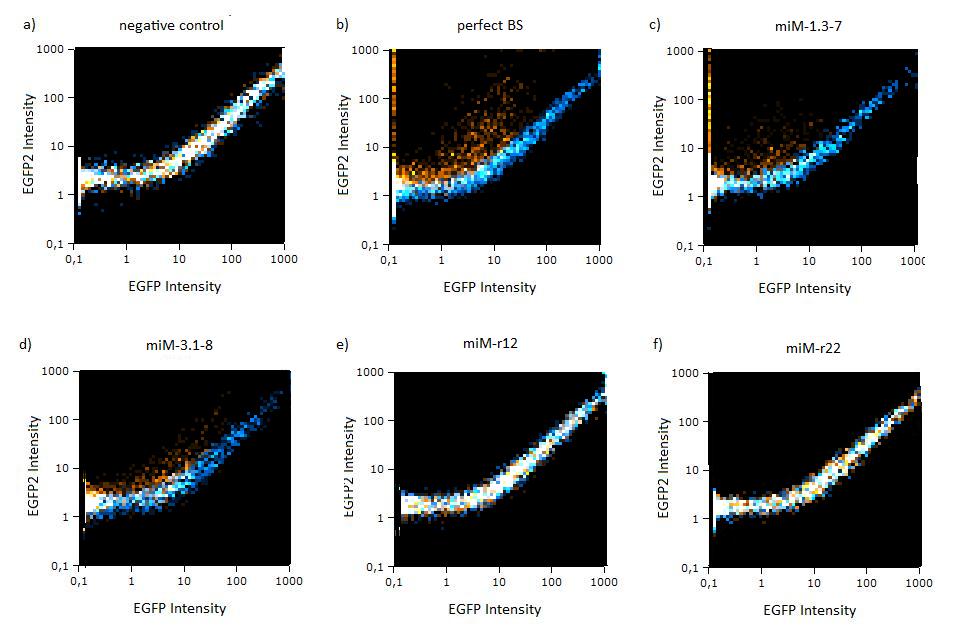
Flow cytometry measurementsHela cells transfected with the constructs (described above) are also taken for flow cytometry. Each measuremnet contains 10000 cells. The cells are plotted on a logarithmic scale in relation to EGFP and EBFP2 intensity. Each dot represents one fluorescent cell. The dots are colour coded, so that the orange dots represent cells cotransfected with different miMeasure constructs and the miRsAg and the blue one represent cells cotransfected with non-specific miRNA (miR-155), respectively. So the blue set of measurements represent the negative control. Both population of dots make up a line on the logarithmic scale, which shows the correlation of EGFP and EBFP2 very well. The cotransfection with miR-155 is therefore the negative control. If the two different coloured dots overlap, they become white. Thus both lines overlap almost completely in the negative control, whereas the orange line shifts to the left for the miMeasure construct with the perfect binding site. All the other constructs are like the negative control. Both coloured lines are more scattered on the linear scale, although the shifting of the orange dots are more visible for the construct containing the perfect binding site. All the other constructs have the same range of scattering as the negative control.  GFP/BFP correlation of single transfected Hela cells according to flow cytometry analysis on a logarithmic scale different binding sites for miRsAg cotransfected with miRsAg or with mi-R155, respectively. The orange dots represent the cotransfected cells with miRsAg and the blue dots the cotransfected cells with miR-155. Hela cells were used.  GFP/BFP correlation of single transfected Hela cells according to flow cytometry analysis on a linear scale different binding sites for miRsAg cotransfected with miRsAg or with mi-R155, respectively. The orange dots represent the cotransfected cells with miRsAg and the blue dots the cotransfected cells with miR-155. Hela cells were used. Analysis of miRaPCR Generated Binding Sites Against a Natural miRNAThe miRaPCR generates binding sites out of rationally designed fragments. These are aligned with each other by chance, whereby different spacer regions are inserted randomly in between. It has been suggested that having more than one binding site of for the same miRNA behind each other can lead to stronger down-regulation than a single one. If imperfect binding sites are aligned, it is also supposed to be stronger than a single one. This is what we tested using MiRaPCR for effortless assembly of binding site fragments. For our experiments, we took advantage of the high abundance of miRNA 122 in liver cells and tested different combinations of binding sites created by miRaPCR. We transfected HeLa and HuH7 cells with the constructs described in table 2. Since HuH7 cells express miR-122, the constructs will be affected in the HuH7 cells without cotransfecting any miRNAs, whereas miR-122 were cotransfected for the HeLa cells in 2:1 ratio. The result shows the ratio between GFP and BFP normalized to the negative control (miMeasure constructs without binding sites). The miMeasure constructs were also compared to the expression of miMeasure containing one perfect binding site for miRNA 122. The transfected HeLa are also imaged with the epifluorescent microscope. Large amount of cells in the negative control (miMeasure with perfect binding site cotransfected with miR-155, see a)are green, whereas most cells with the miMeasure construct containing the perfect binding sites (see b) are blue.  epifluorescent microscopy image (10x) of Hela cells transfected with miMeasure miMeasure with a perfect binding site is a) cotransfected with miR-155, which has no specificity to miR-122, b) cotransfected with miR-122, which is complementary to the perfect binding site. EGFP is regulated by miR-122, EBFP2 is unregulated and serves as transfection control.
The Huh7 cells were also transfected with the 4 different constructs. Here a cotransfection with miR-122 is not necessary, since Huh7 cells express miR-122 themselves. The knock-down of the perfect binding sites are stronger than the knock-down in the Hela cells. Here the knock-down efficiency is 80% for the perfect binding site and the aligned constructs.
Flow cytometryThe same constructs in Hela cells were analyzed by flow cytometry, too. Here the orange dots also represent the miMeasure construct transfected with the specific miRNA and the blue dots make up the negative control. The orange dots from the construct containing the perfect and the aligned binding sites have lower EGFP expression compared to EBFP2 expression, since the EGFP trend doesn't correspond to the EBFP2 trend, but shifts to the laft. The orange dots rise with the fluorescence intensity and collapses to zero, when the EBFP2 intensity is high. For the other constructs the EGFP range fully corresponds with the EBFP2 range. The linear plot shows the orange and blue dots in more distinct lines. The orange dots from the construct containing the perfect and aligned binding sites assemble along the y-axis, where the EGFP fluorescence intensity is zero. For the other construct the EGFP line fully overlap with the EBFP2.
 EGFP2/EBFP correlation of single transfected Hela cells according to flow cytometry analysis different binding sites for miR122 cotransfected with miR-122 or with miR-155, respectively. The orange dots represent the cotransfected cells with miR122 and the blue dots the cotransfected cells with miR-155. Hela cells were used. 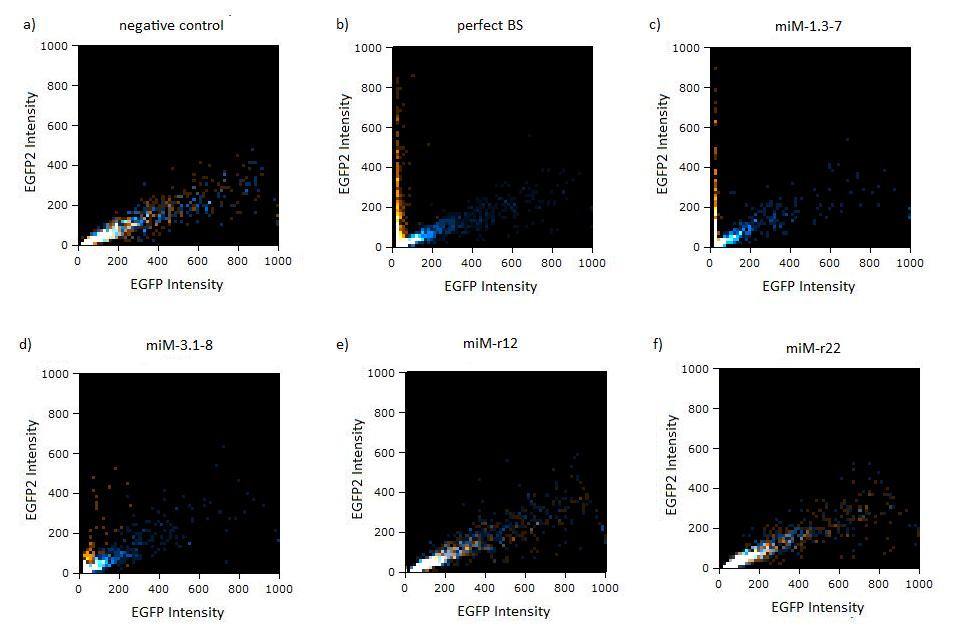 EGFP/EBFP2 correlation of single transfected Hela cells according to flow cytometry analysis different binding sites for miR122 cotransfected with miR-122 or with miR-155, respectively. The orange dots represent the cotransfected cells with miR122 and the blue dots the cotransfected cells with miR-155. Hela cells were used. Analysis of endogenous miRNAHepG2, another liver cell line, is also transfected with the constructs containing the perfect and the aligned constructs for miR-122. The cotransfection with miR-155 serves again as a negative control. For this cell line there was only a slight knock-down observed for all of the constructs, it is much less compared to the HuH7 cell line, where the knock-down ranges from 20-40%.
The EGFP/EBFP2 ratio from each transfected HuH7 cell is calculated for 52 cells. The cells were transfected with the construct carriying the three aligned perfect binding sites against miR-122. The EGFP/EBFP2 ratio in each cell is different and ranges from 0.1 to 6. DiscussionMethodsThe fluorescence of GFP and BFP can be compared using different methods, for example automated fluorescence plate reader systems, flow cytometry or manual and automated fluorescence microscopy. ReferencesAi HW, Shaner NC, Cheng Z, Tsien RY, Campbell RE. Exploration of new chromophore structures leads to the identification of improved blue fluorescent proteins. Biochemistry. 2007 May 22;46(20):5904-10. Bartel DP. MicroRNAs: target recognition and regulatory functions. Cell. 2009 Jan 23;136(2):215-33. Fabian MR, Sonenberg N, Filipowicz W. Regulation of mRNA translation and stability by microRNAs. Annu Rev Biochem. 2010;79:351-79.
|
||||||||||||||||||||||||||||||||||||||||
 "
"

