Binding Site Design - August
01/08/2010
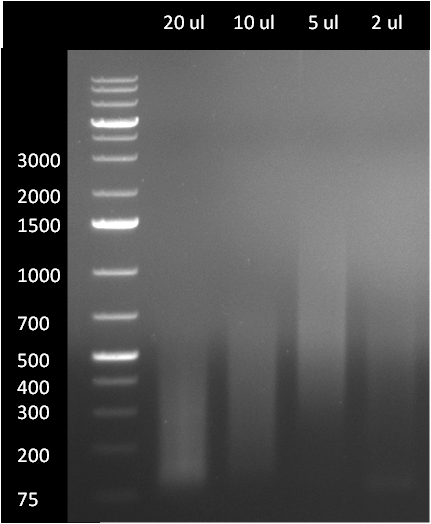 Gel1: diraPCR product analyzed on 1 % agarose gel (see gel1). The second, 25 cycle PCR was performed with different amounts of 12 cycle PCR product, resulting in different product ranges
- diraPCR product from previous day was PCR purified by applying the Qiagen PCR purification Kit (elution in 32 ul nuclease-free water)
- in parallel, 5 ul of PCR product were analyzed on a 1 % agarose gel; interestingly, the diraPCR product range can obviously be controlled by applying different amount on 12 cycle PCR product in the 25 cycle PCR. When 5 ul, 10 ul or 20 ul of 12 cycle PCR product were applied in the second PCR, the resulting product ranges where in between 100-400, 300-700 and 500-2000 respectively. When 2 ul or a lower amount of 12 cycle PCR product was applied, the product the subsequent 25 cycles was hardly visible.
- PCR-purified product was digested with EcoRI and PstI and run on a preperative 1 % agarose gel (100 V/ 1 h) (see gel2).
- The 200, 400 and 700 bp band of the lanes, appearing brightes under the UV light, were cut out of the gel and gel purified applying the Qiagen gel purification kit
- a single colony from the pSB1A3 transformation (previous day) was picked and used for inocculating two 5 ml cultures (LB-Amp)
- cultures were incubated for 8 h at 37 °C
- subsequently, 200 ul of the first culture were used for inocculating a 200 ml overnight culture for maxiprep (LB-Amp)
- 4 ml of the second culture were pelleted and used for MiniPrep (Qiagen); elution in 40 ul nuclease free water
- 31 ul of the Miniprep product were digested with EcoRI and PstI and loaded on an preperative agarose gel; as control, 5 ul of undigested vector and 10 ul of each the digestion product of the 200, 400 and 700 bp bands (see above) were loaded as well (see gel3). The linearized vector has two additional bands at around 1.3 and 3.5 kb, which were not expected. Explanations could be the formation of dimers or even the contamination of the registry-well with a different construct.
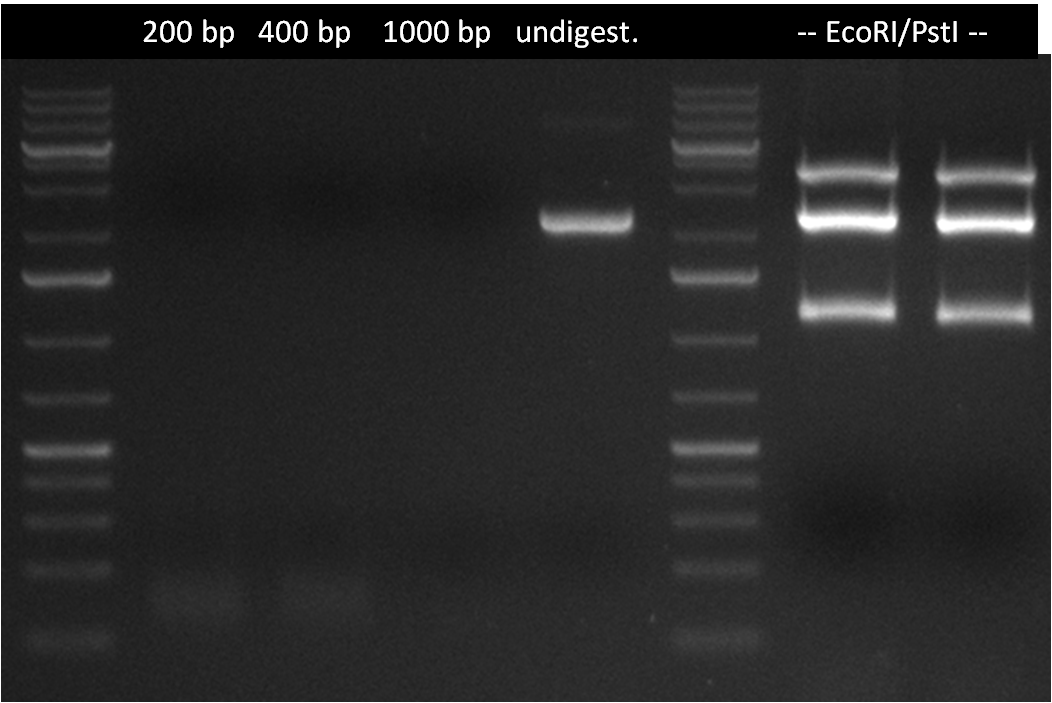 Gel3: 200, 400 and 1000 bp band show only weak product bands. The uncut vector has, as expected, a size of ~2.1 kb; however, after cutting, a 1.3 kb and a 3.5 kb appear in addition to the expected 2.1 kb band of linearized vector. 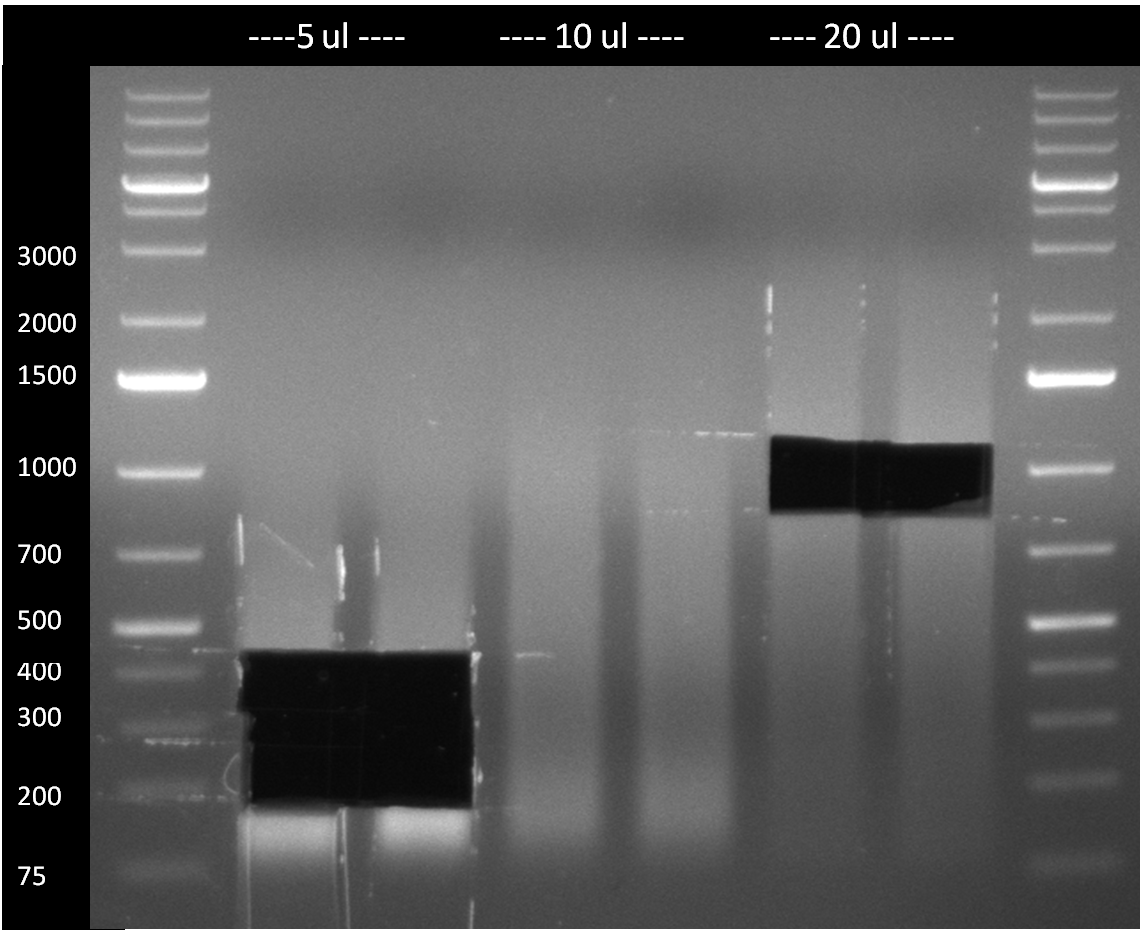 Gel2: the 200, 400 and 700 bp band of the brightest lanes were cut out
02/08/2010
- transformation of the cloning that has been done on the previous day (raPCR hsa-mir-886_3p binding site pattern)
- maxiprep of pSB1A3 (culture was inocculated on the previous day); elution was done with 1 ml water (miliQ, autoclaved)
- digestion of 2 times 2 ug of pSB1A3 maxiprep DNA with EcoRI and PstI overnight at 4 °C
- picking 20 colonies from the tranformed plates (tranformation on this day); 5 colonies of each the 200 and 400 bp band construct, 10 colonies of the 1000 bp construct for:
- a) colony PCR (24 ul of water, 0.5 ul of each standards sequencing primer VF and VR, 25 ul of mastermix and bakterial colony)
- b) inocculation of overnight miniprep LB cultures with the same, picked colonies
03/08/2010
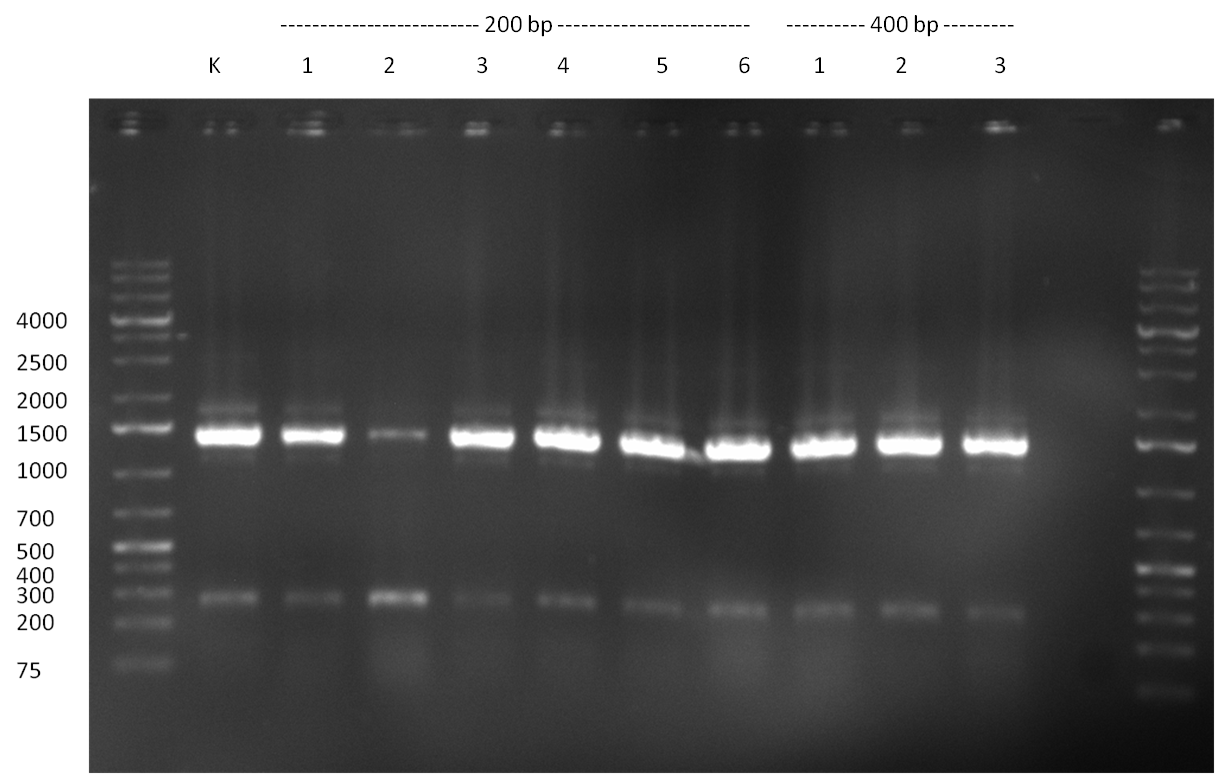 Colony PCR; the length of the cloned binding site patterns is indicated (200, 400 or 1000 bp) as well as the number of the clone that was picked; K: negative control 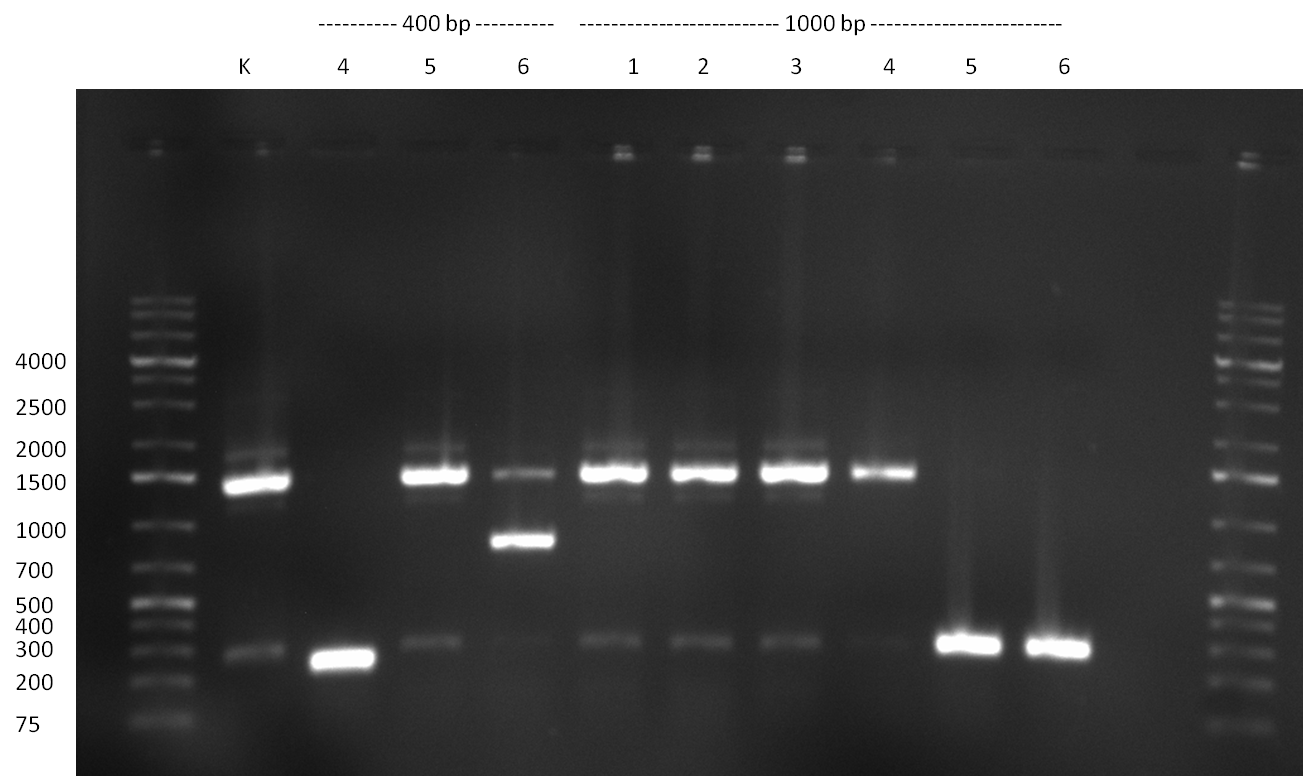 Colony PCR; the length of the cloned binding site patterns is indicated (200, 400 or 1000 bp) as well as the number of the clone that was picked; K: negative control - loading colony PCR samples from the previous day on 1 % analytic agarose gel; sample 6 (400 bp) seems positive
diraPCR for constructing hsa-886-3p binding site patterns
the diraPCR was pipetted according to the following protocol in three repeats:
- 1 ul of each binding site oligo
- 0.5 ul of each stop oligo
- 25 ul of Phusion MasterMix
- add water to final volume of 50 ul
each of the three 12 cycle PCR repeats were performed according to the standard miRACLE PCR protocol
the three 12x repeats (1,2,3) were each split into two (1A, 1B, 2A, 2B, 3A, 3B) and the 25 cycle PCR was performed according to the standard miRACLE PCR protocol
after PCR purification the subsequent PCR reaction was pipetted as follows:
- 10 of 12 cycle PCR product
- 0.5 ul of each stop oligo
- 25 ul of Phusion MasterMix
- add water to final volume of 50 ul
 Gel: the 200, 400 and 1000 bp band of the brightest lanes were cut out
04/08/2010
- Samples from the 12cycle and 25cycle PCR were resolved on the 1% agarose gel.
12cycle PCR: 1ul of 5x loading dye + 2.5ul of purified DNA
25cycle PCR: 1ul of 5x loading dye + 5ul of PCR mixture
gel map:
1kbLadder - 12x(1)- 12x(2)- 12x(3)- DNAladderMix - 1A - 1B - 2A - 2B - 3A - 3B
- Miniprep of the positive clone (400 bp, nr.6 ) from the previous day; sample is send for sequencing with standard primers VF2 and VR --> result is negative
05/08/2010
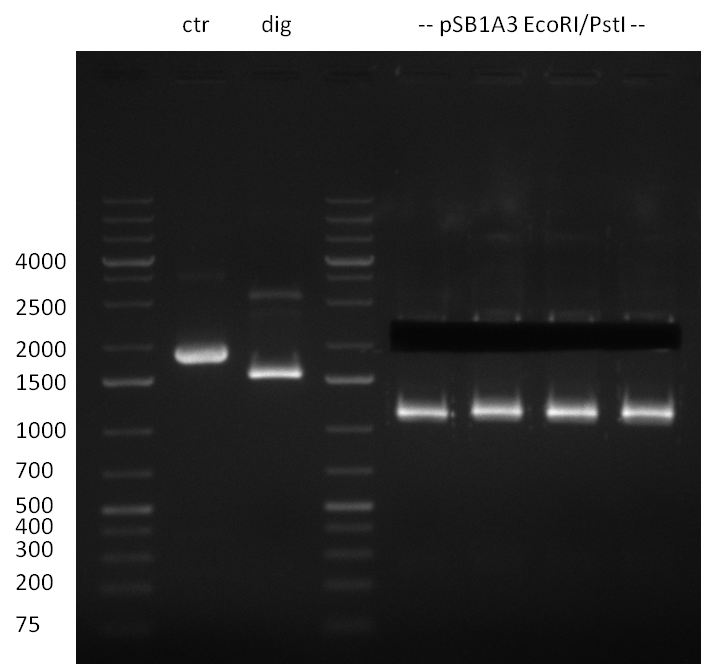 Digestion of the positive clone (previous day) and preperative digestion of vector pSB1A3; Ctr: Test Digestion of Vector pSB1A3, dig: Digestion of positive, no insert is dropping out (negative); 2.1 kb vector band was cut out, but unexpected ~1.2 kb band occured again. Therefor the vector was wasted
- digestion of pSB1A3 with EcoRI and PstI according to the following protocol (6 repititions):
- 6 ul (2 ug) of pSB1A3
- 3 ul of NEB Buffer EcoRI
- 3 ul of 10x BSA
- 0.5 ul of each enzyme
- 17 ul of nuclease-free water
Digestion is performed o/n @ 4 °C
- repitition of colony-PCR with the cloned constructs from the 02/2010; 6 colonies (of each the 200, 400 and 1000 bp cloning plate) and a negative control were picked. A colony PCR was performed according to the protocol described on the 03/2010 and miniprep cultures were inocculated.
- Inocculation of 200 ml maxiprep LB cultures of the plasmids pSi Fluor 2, pSi Fluor 2(star) and pSi RcSRRE
06/08/2010
- Maxiprep of the cultures inocculated the previous day was performed according to the Qiagen Maxiprep Protocol. Afterwards, DNA concentration and purity was measured using the nanodrop:
- pSiRcSRRE - 468.5ng/ul (260/280 - 1.870)
- pSiFluor2 - 274ng/ul (260/280 - 1.870)
- pSiFluor2* - 225ng/ul (260/280 - 2.885)
07/08/2010
- second strand synthesis PCR: for the microRNAs hsa-miR-886-3p, hsa-miR-769-5p, hsa-miR-299-3p, hsa-miR-365, hsa-miR-886-5p, hsa-miR-548a-5p, hsa-miR-487a, hsa-miR-122 we constructed two oligos each. One oligo contained a perfectly matching binding site for the corresponding miRNA, the second one had randomized oligos introduced at positions 9-12. Second strand synthesis was performed according to the protocol described here (Link). The PCR product was purified by applying the Qiagen Nucleotide Removal Kit (elution in 37 ul water). 3 ul of the purified PCR product was then analyzed on an 2 % agarose gel, run for 65 min @ 135 V (Gel 1 and 2).
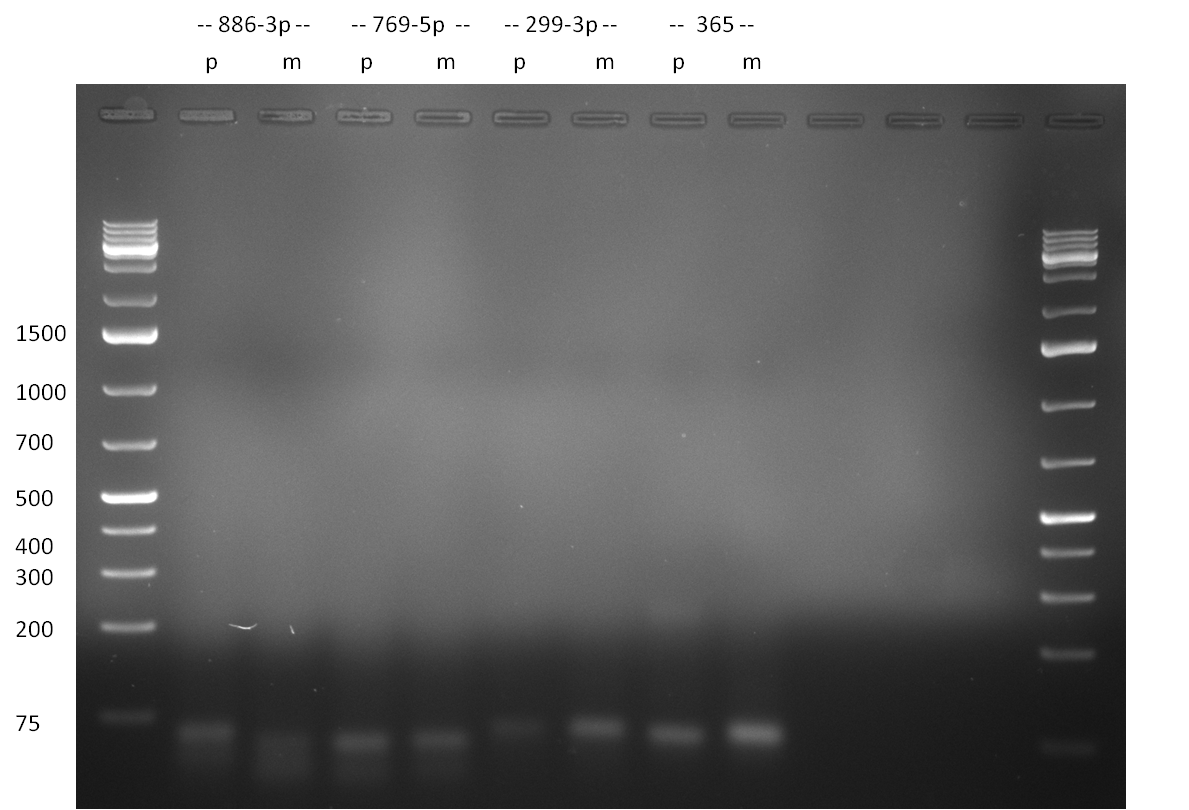 Gel 1: Purified PCR product for single binding site and single binding site library design. The band at ~45 bp corresponds to the expected binding site length; microRNAs are indicated, as well as perfect (p) and 9-12 mutated (m) single binding sites 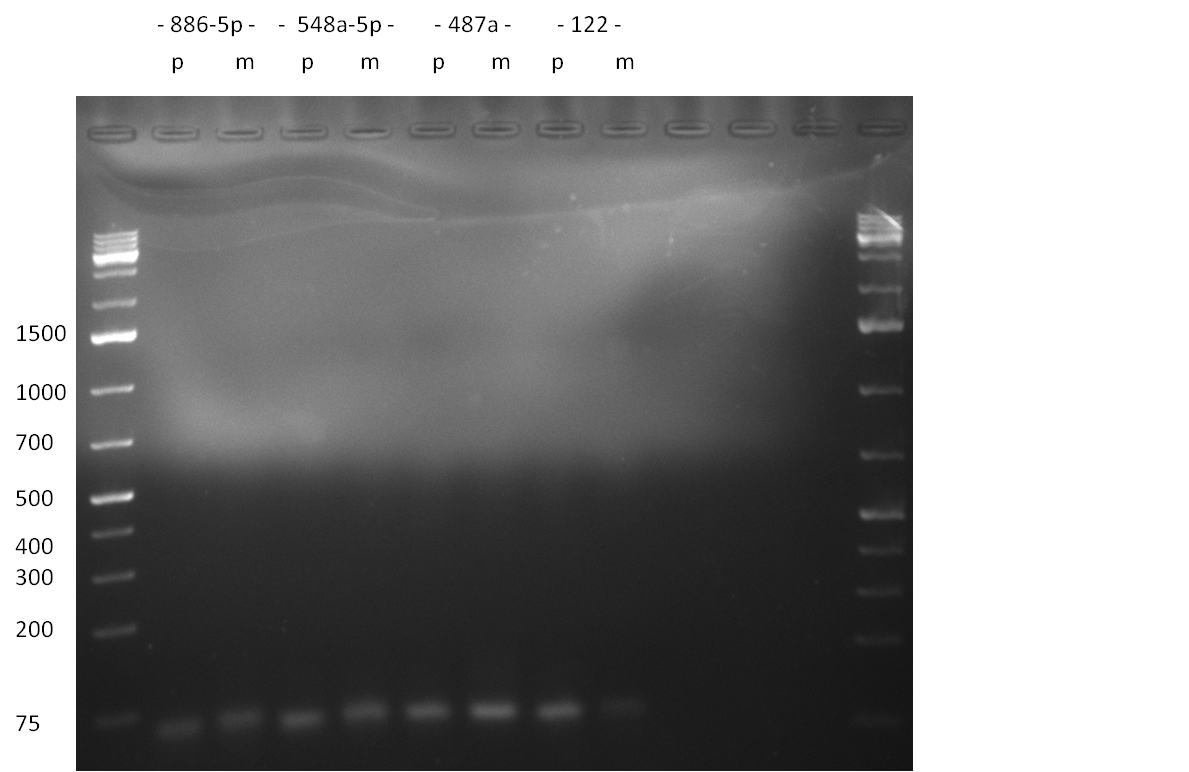 Gel 2: Purified PCR product for single binding site and single binding site library design. The band at ~45 bp corresponds to the expected binding site length; microRNAs are indicated, as well as perfect (p) and 9-12 mutated (m) single binding sites
- Digestion of pSB1A3, pSB1T3 and pSB1C3 (linearized ready-to-use version from 2010 spring distribution, 750 ng each) with EcoRI and PstI according to the following protocol:
- 15 ul vector, 24 ul water, 5 ul BSA, 5 ul NEB Buffer EcoRI, 0.5 ul of each EcoRI and PstI; incubation for 1 h @ 37 °C
- heat inactivation for 20 min @ 80 °C
- adding of 0.5 ul SAP (shrimp acidic phosphatase) and DpnI
- incubation for 1 h @ 37 °C
- Digestion of pSB1A3 (Maxiprep) with EcoRI and PstI according to the following protocol:
- 3 ul (1 ug) vector, 36 ul water, 5 ul BSA, 5 ul NEB Buffer EcoRI, 0.5 ul of each EcoRI and PstI; incubation for 1 h @ 37 °C
- heat inactivation for 20 min @ 80 °C
- adding of 0.5 ul SAP, incubation for 1 h @ 37 °C
- Digestion of purified PCR product for the single bindig sites according to the following protocol:
- 30 ul DNA, 9 ul water, 5 ul BSA, 5 ul NEB Buffer EcoRI, 0.5 ul of each EcoRI and PstI; incubation for 1 h @ 37 °C
- purification of DNA by applying a Qiagen Nucleotide Removal Kit (elution in 37 ul water)
- The digestion procuts were analyzed on a 2 % agarose gel, run for 35 min @ 135 V (gel 3 and 4)
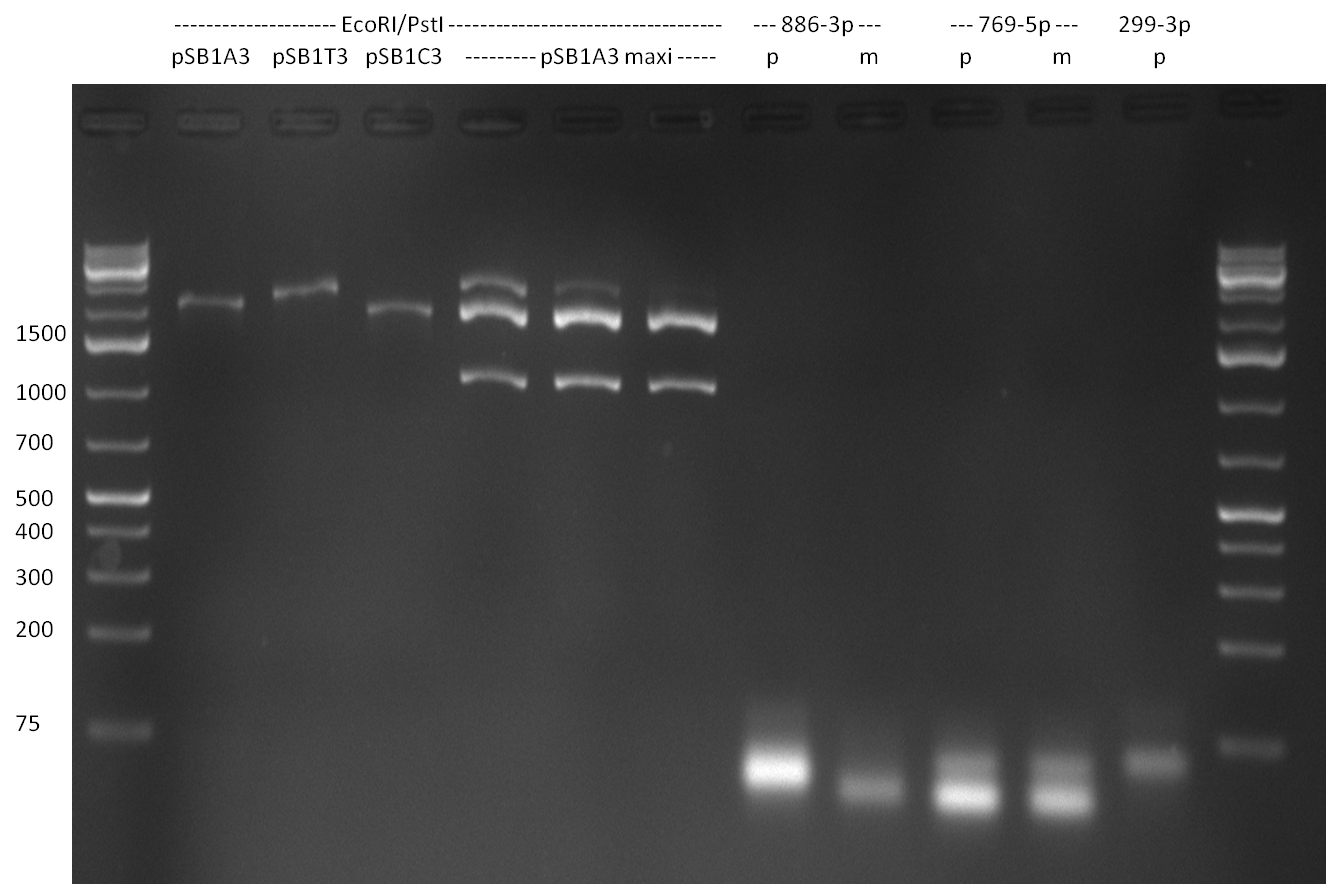 Gel 3: digested ready-to-use plasmids (EcoRI and PstI cut) and single binding site digestion products; microRNAs are indicated, as well as perfect (p) and 9-12 mutated (m) single binding sites 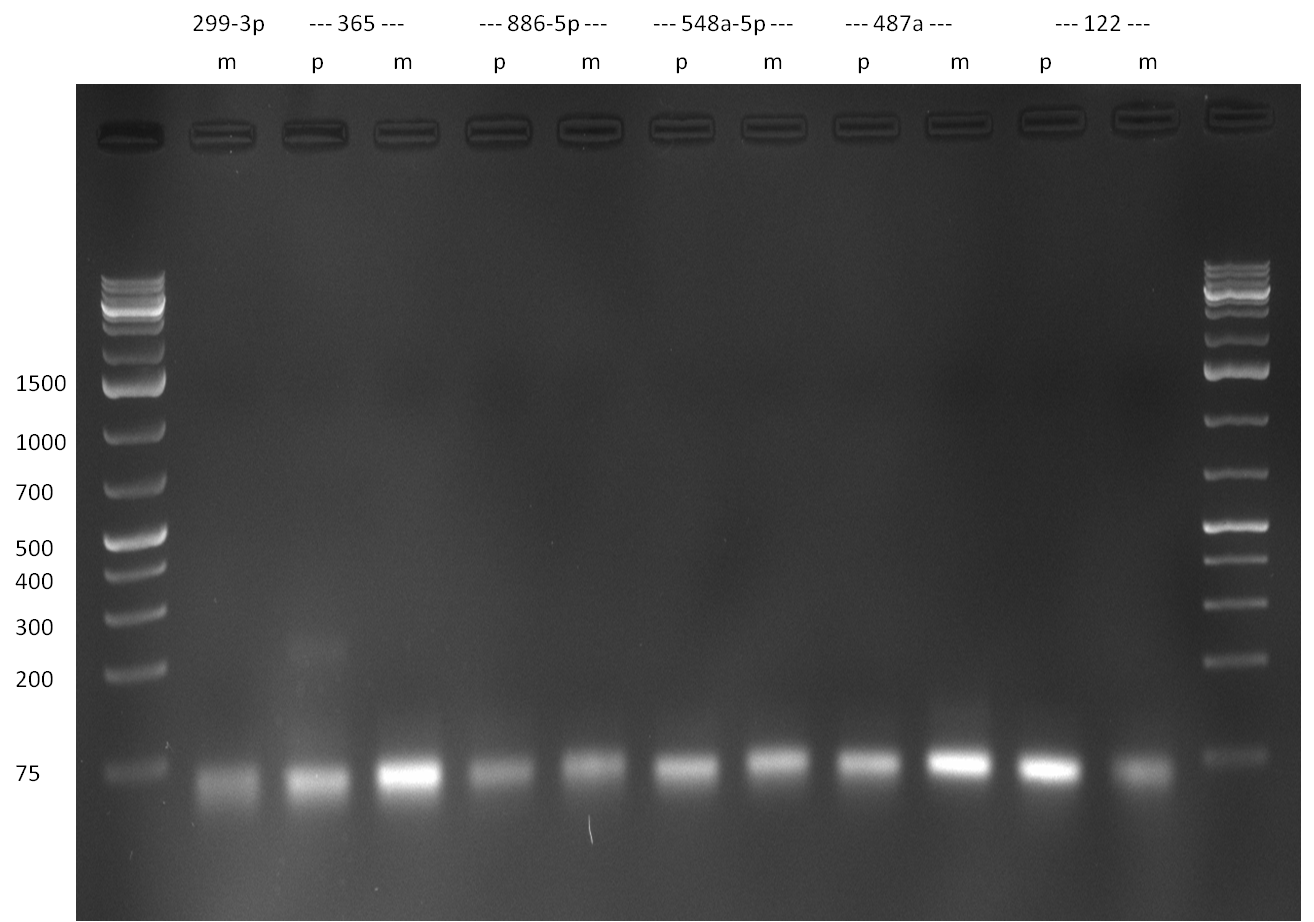 Gel 4: single binding site digestion products cut EcoRI and PstI; microRNAs are indicated, as well as perfect (p) and 9-12 mutated (m) single binding sites
08/08/2010
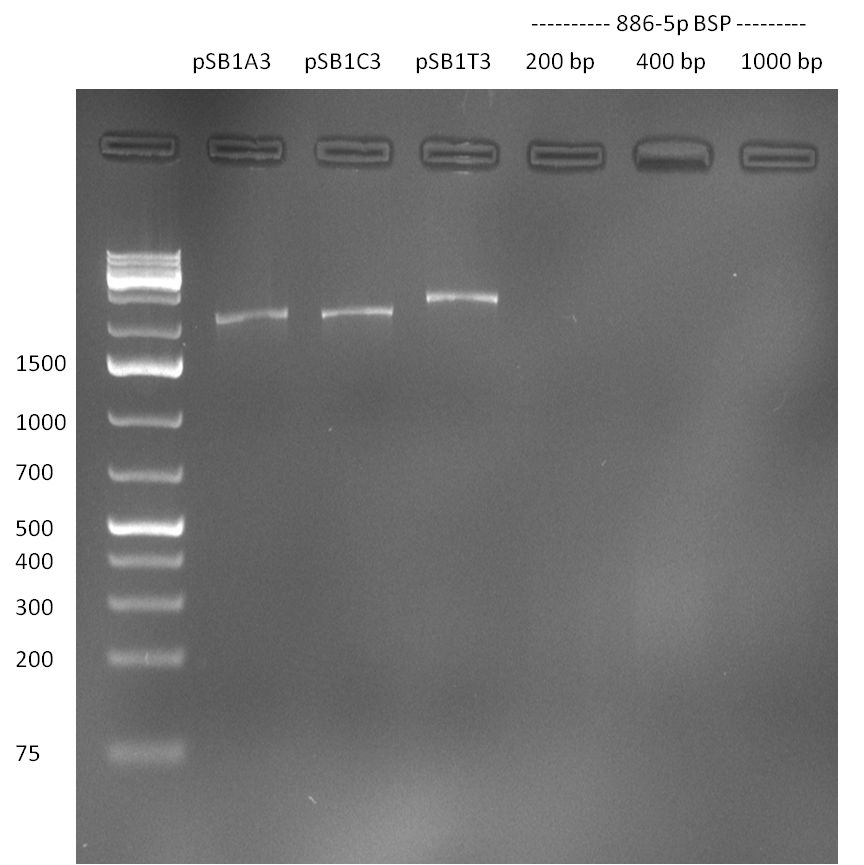 Analysis of purified vector and 200, 400 & 1000 bp insert; vector band is clearly visible as well as a faint band for the 200 and 400 bp BSP. For the other samples, the DNA concentration is too low for analysis on an agarose gel
- digestion of mir-886-5p binding site patterns (purified PCR product) madu on the 05/2010 according to the following protocol:
- 200 bp band: 20 ul of vector, 5 ul of BSA, 5 ul of NEB Buffer EcoRI
- purification of single binding site and vector digestion products (previous day) on a 2 % agarose gel (run for 35 min @ 100 V).
- Ligation of single bindig sites and binding site pattern into pSB1A3 was performed according to the following protocols:
- single binding sites (16 and 17): 6 ul of pSB1A3 (~60 ng) vector, 1 ul of single binding site insert, 10 ul water, 2 ul ligase buffer, 1 ul T4 ligase
- 200 bp binding site pattern: 6 ul of pSB1A3, 4 ul of Insert (~ 30 ng), 2 ul of ligase buffer, 1 ul ligase, 7 ul water
- 400 bp binding site pattern: 6 ul of pSB1A3, 5 ul of Insert (~40 ng), 2 ul of ligase buffer, 1 ul of ligase, 6 ul of watetr
- control: 6 ul pSB1A3, 2 ul ligase buffer, 1 ul ligase, 11 ul water
Ligation reaction was incubated at 19 °C for 5 h; 10 ul of each ligation reaction was transformed into E. coli Top10 according to the standard transformation protocol.
09/08/2010
- transformation of pSB1C3 standard assebly vector from the registry (according to the resitry standard protocl)
- Picking of Colonies from the privious days' cloning for inocculating miniprep LB cultures and for performing colony PCR; The colony-PCR was performed according to the following protocol:
for single binding sites:
- 25 ul MasterMix
- 24 ul water
- 0.5 ul of each primer (VF2 and SBSSSS_PstI)
- colony picked
for binding site patterns:
- 25 ul MasterMix
- 24 ul water
- 0.5 ul of each primer (miRaPCR_Stop_fw(EcoRI) and miRaPCR_Stop_rev(PstI))
- colony picked
PCR was performed according to the standard colony PCR protocol
10/08/2010
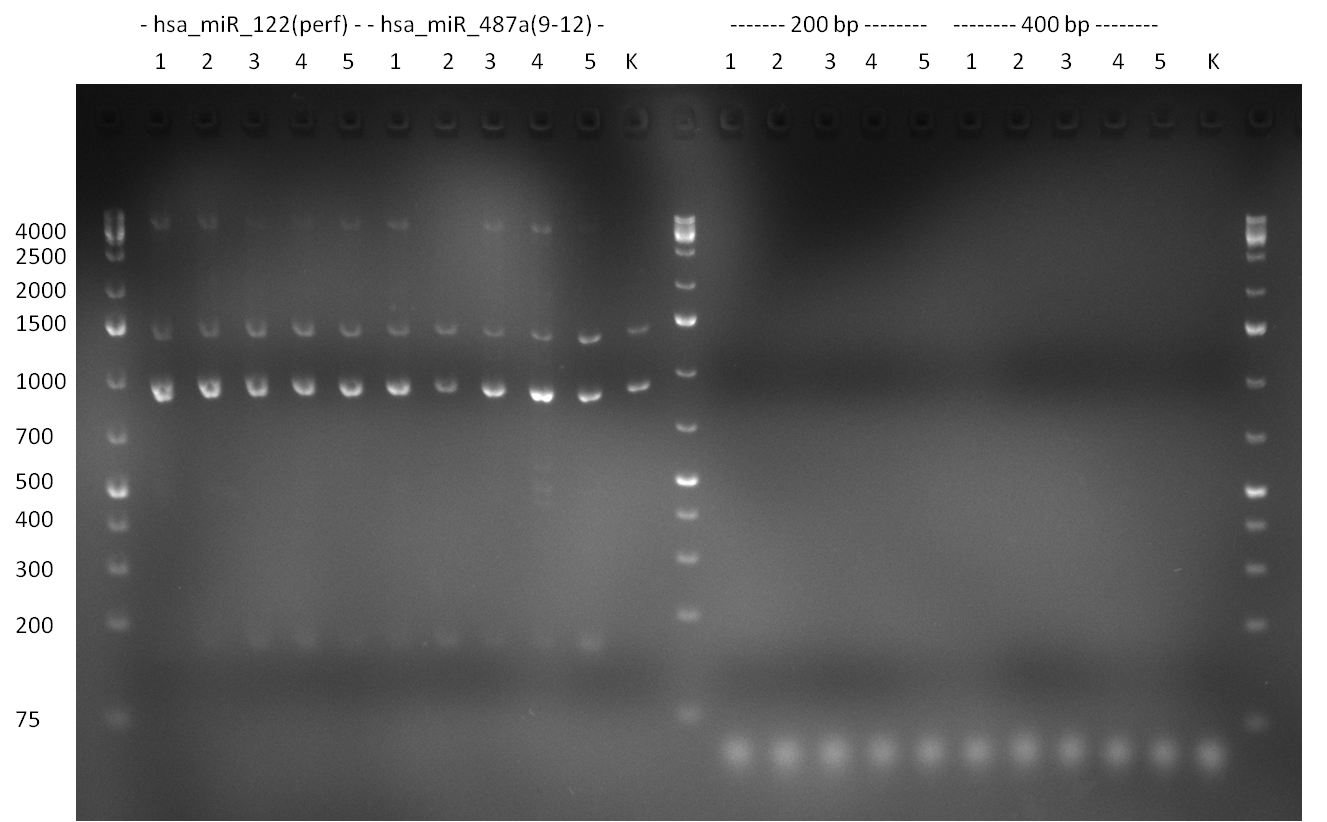 Colony PCR of single binding site cloning and binding site pattern cloning analyzed on a 1.5 % agarose gel. 9 of 10 single binding site colonies (2-10) show the right band. The binding site pattern doen't show a any band at all, possibly due to primer dimers. - The colony-PCR from the previous day (for single binding site and binding site pattern cloning) was analyzed on a 1.5 % agarose gel. For single binding site, 90 % of the colonies were positive, showing the right band at ~ 170 bp. The negative control was also negative, indicating the PCR worked fine wihtout any contamination. For the binding site patterns, all samples were negative, not showing any band 300 bp upwards. It is assumed, that this might be due to the fact, that the raPCR primes can form strong dimers, making the delicate colony PCR not work properly.
- Digest of pSi plasmid was done sequntially and also simultaneously.
- Simultaneous reaction:
- Nhe1 and Not1 added together in NEB2 buffer (Nhe1 activity - 100%; Not1 activity 50%)for 2.5 hours @37°C;inactivation at 65°C for 20min. The mixture was then treated with SAP for 1hr and stored on ice overnight
- Sequential reaction:
- Nhe1 andded in NEB2 buffer (100%activity expected) for 2.5hrs @37°C; inactivation @65°C for 20min and stored on ice overnight
- Gel analysis on 0.8%agarose:
- Ladder mixes were tested on the same gel. Lane 1 contained DNA Ladder Mix,lane 5 contained DNA Ladder High Range and lane 9 contained 1kb DNA Ladder Plus which proved to be most effective for this setup.
- Lanes 2,3 and 4 contained products of sequential reaction
- Lanes 6,7 and 8 contained products of simultaneous reaction
- Gel extraction protocol was followed for lines ~5.5kb (final volume 30ul in water) and NanoDrop analysis showed following results:
- Sequential: 5.9ng/ul
- Simultaneous: 9.6ng/ul
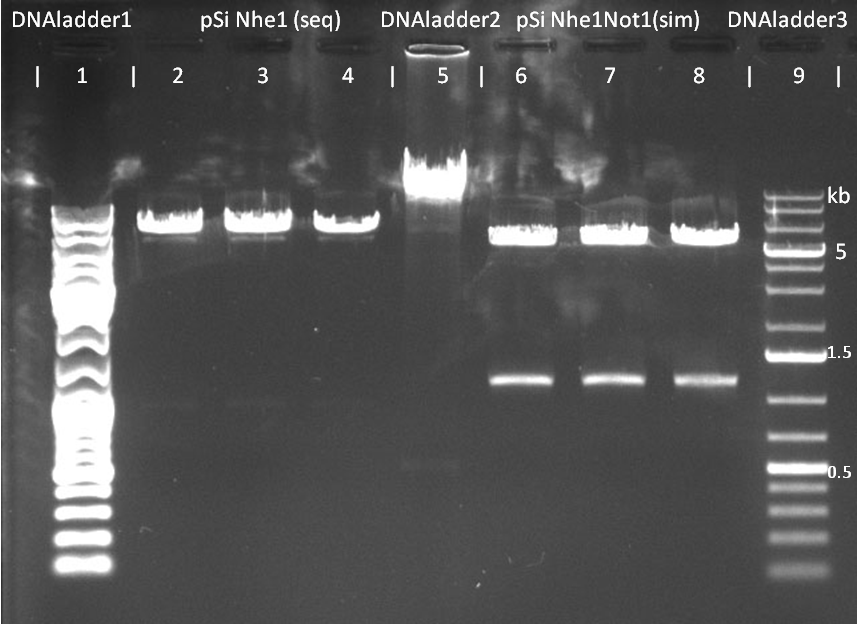 Digestion products of pSi plasmid after 45min at 100V on 0.8%agarose. Lanes 1,5 and 9 used for testing the DNA ladders. Lanes 2,3 and 4 are from sequential digest by Nhe1. Lanes 6,7 and 8 are from simultaneous digest by Nhe1 and Not1 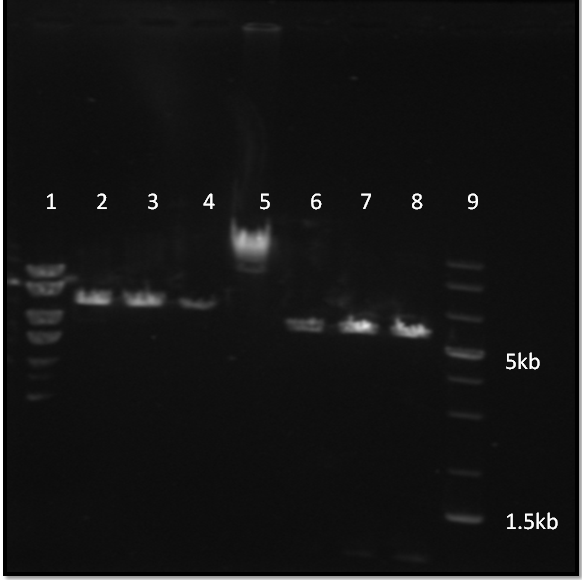 The same gel after 45+90mins
11/08/2010
- Picking of 5 additional colonies of the transformation (binding site patterns) from the plates containing the 200 bp and 400 bp constructs from 09/2010; Performing standard colony PCR using the standard sequenzing primers VF2 and VR. Negative colonies (not containing any binding site pattern, but just religated vector) should show a band at ~290 bp. In parallel, miniprep LB cultures were inocculated using the same, picked colonies.
- although the bands seem too short, the colonies nr. 4, 5 (!), 8 and 10 of the 400 bp band seem positive (gel picture). Minipreps were performed applying the Qiagen Miniprep Kit and were sen for overnight sequenzing (@ GATC).
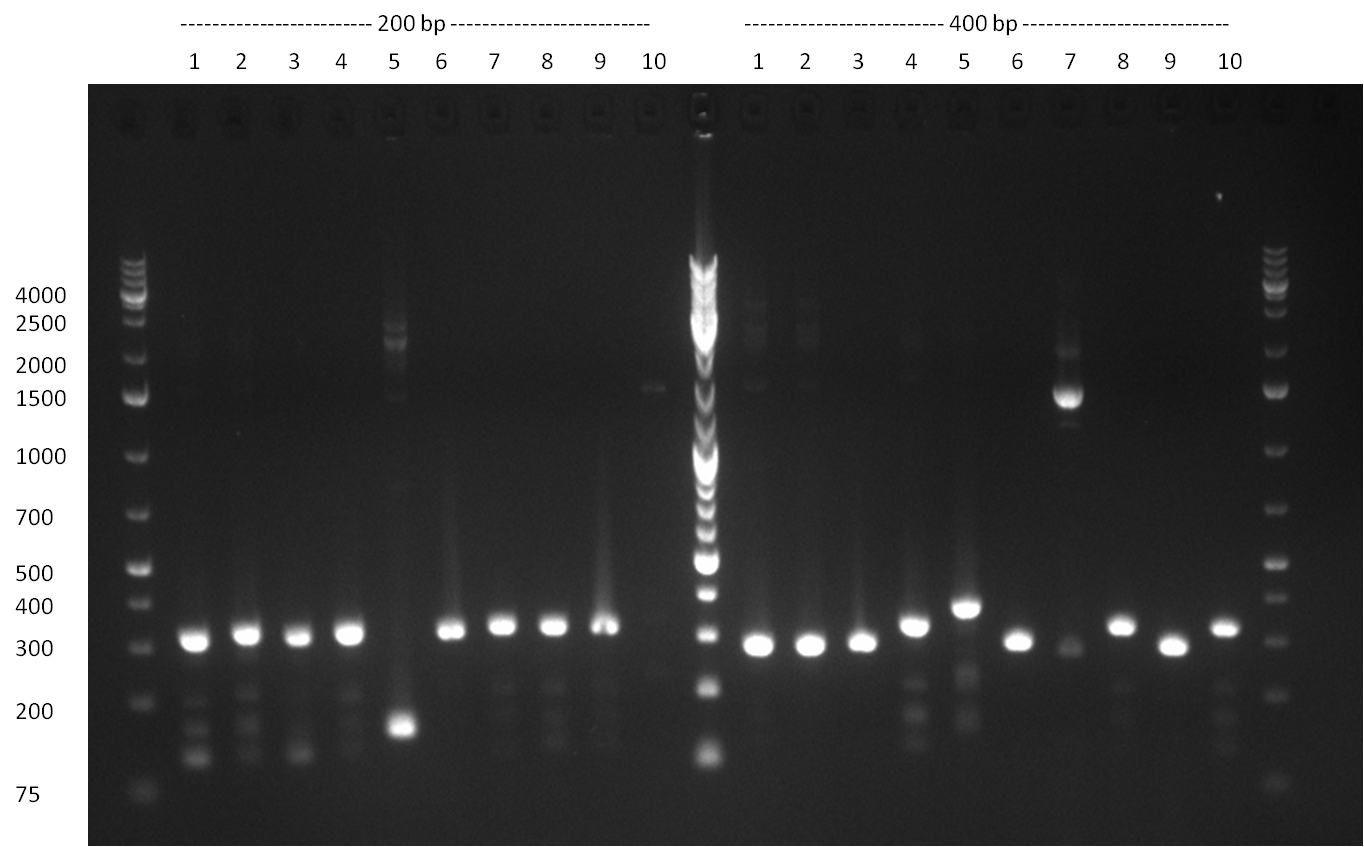 Result of the colony PCR. The 400 bp binding site pattern samples nr. 4, 5, 8 and 10 were positive and send for sequencing 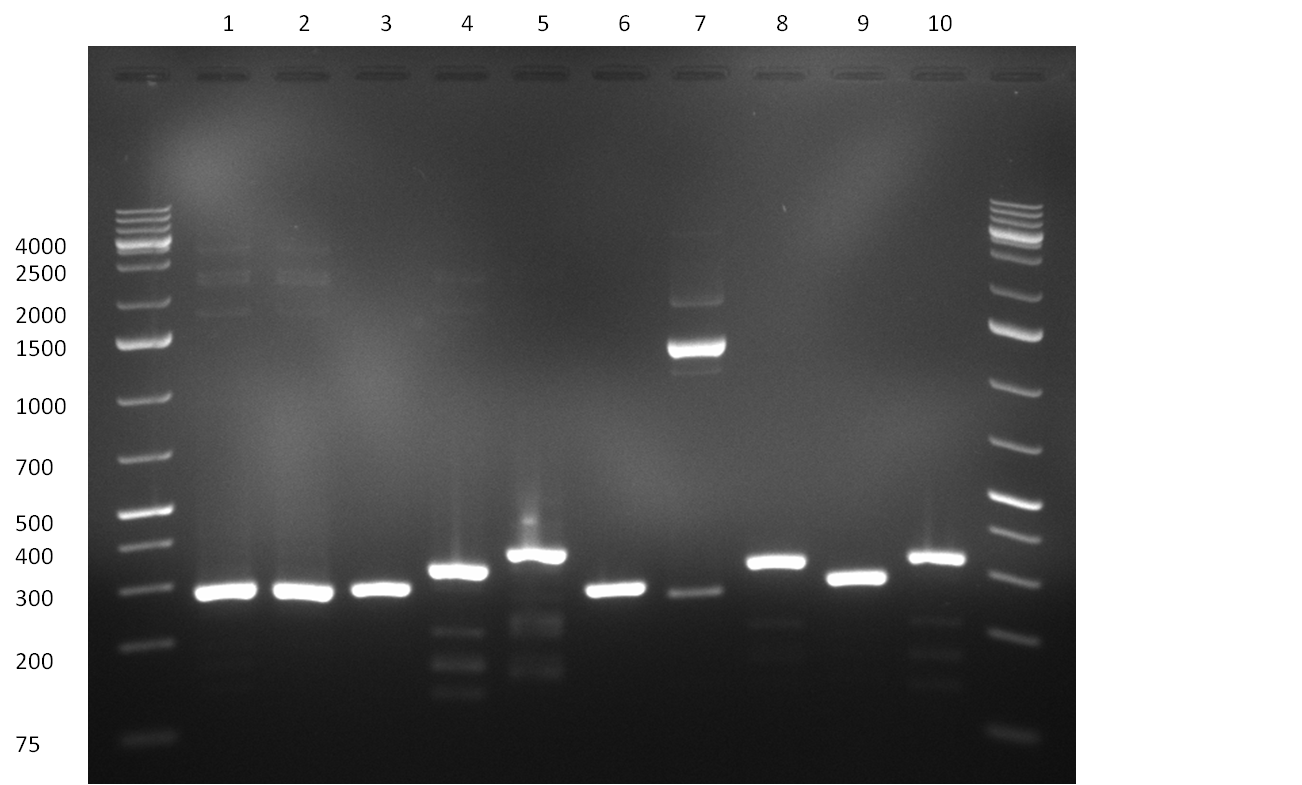 Result of colony PCR. The 400 bp colony-PCRs (nr. 1-10) were loaded on a gel again for further specification of the band length
|


 "
"


