Results
Photosensor
Motility assay
In this experiment, we shone blue light on one half of the plate while the other half was in the dark. We then placed one colony in each half and observed their motility pattern after 24 hours. We did this for three different strains of E. coli: DH5alpha, Wildtype Mg1655 and Mg1655 containing a plasmid with our photosensor constitutively on. See the results for yourself: Light shone on the right half of the plates, the left half was in the dark.
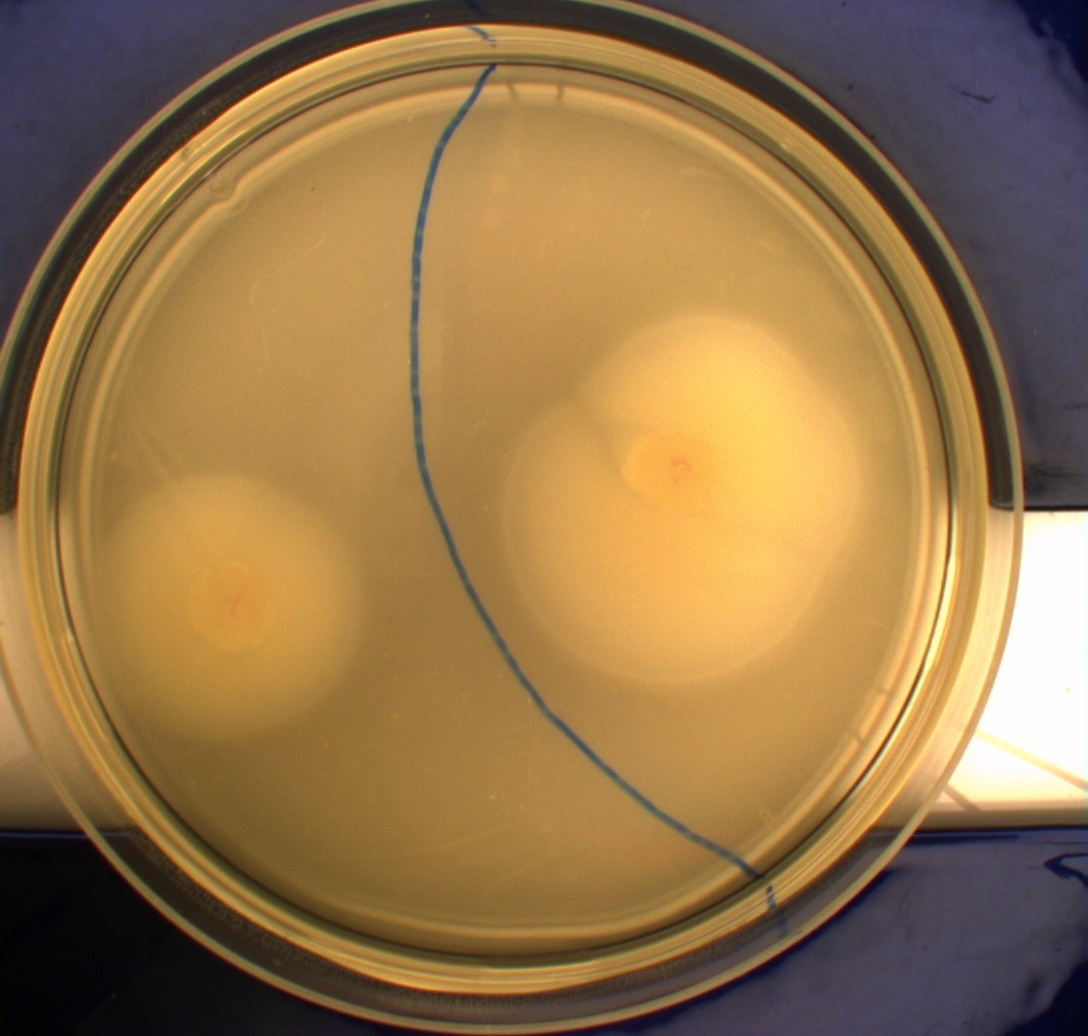
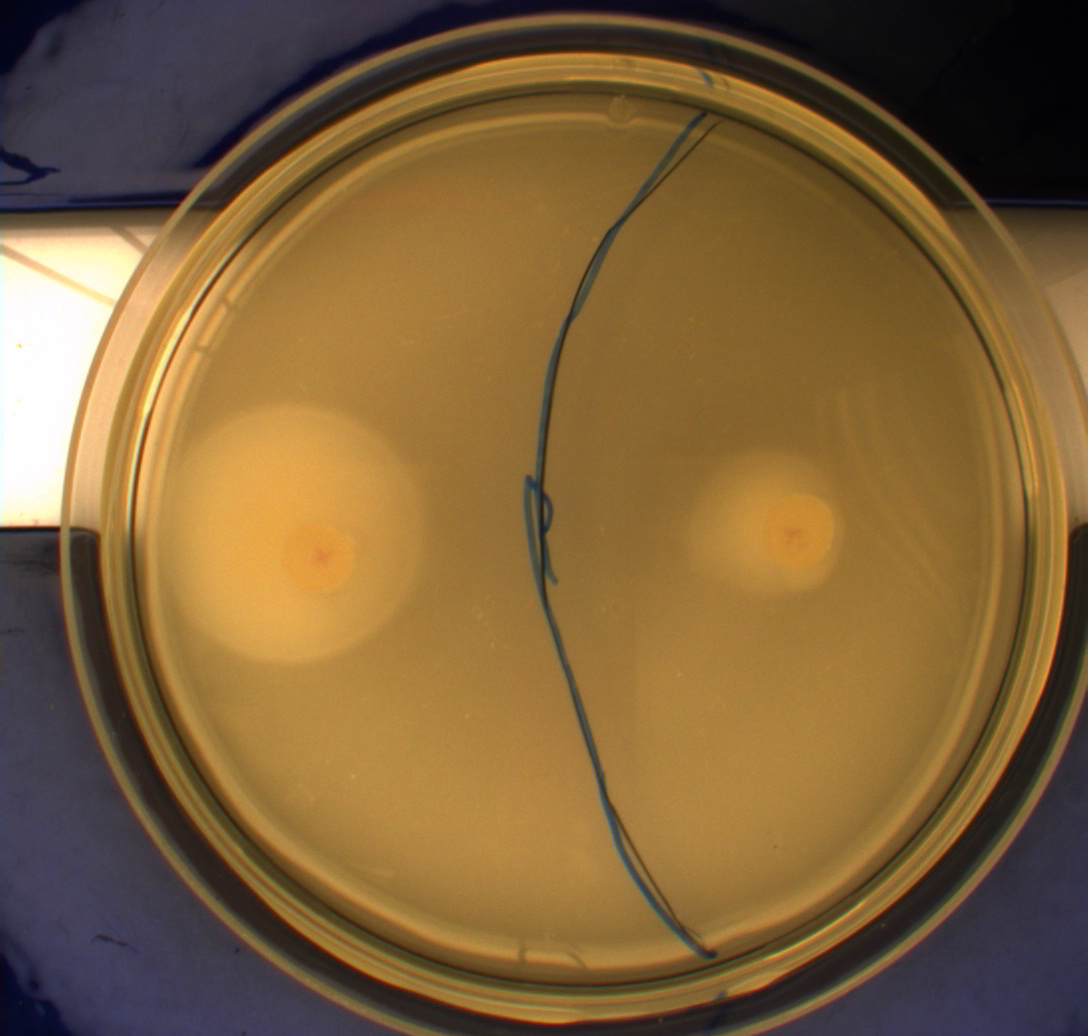
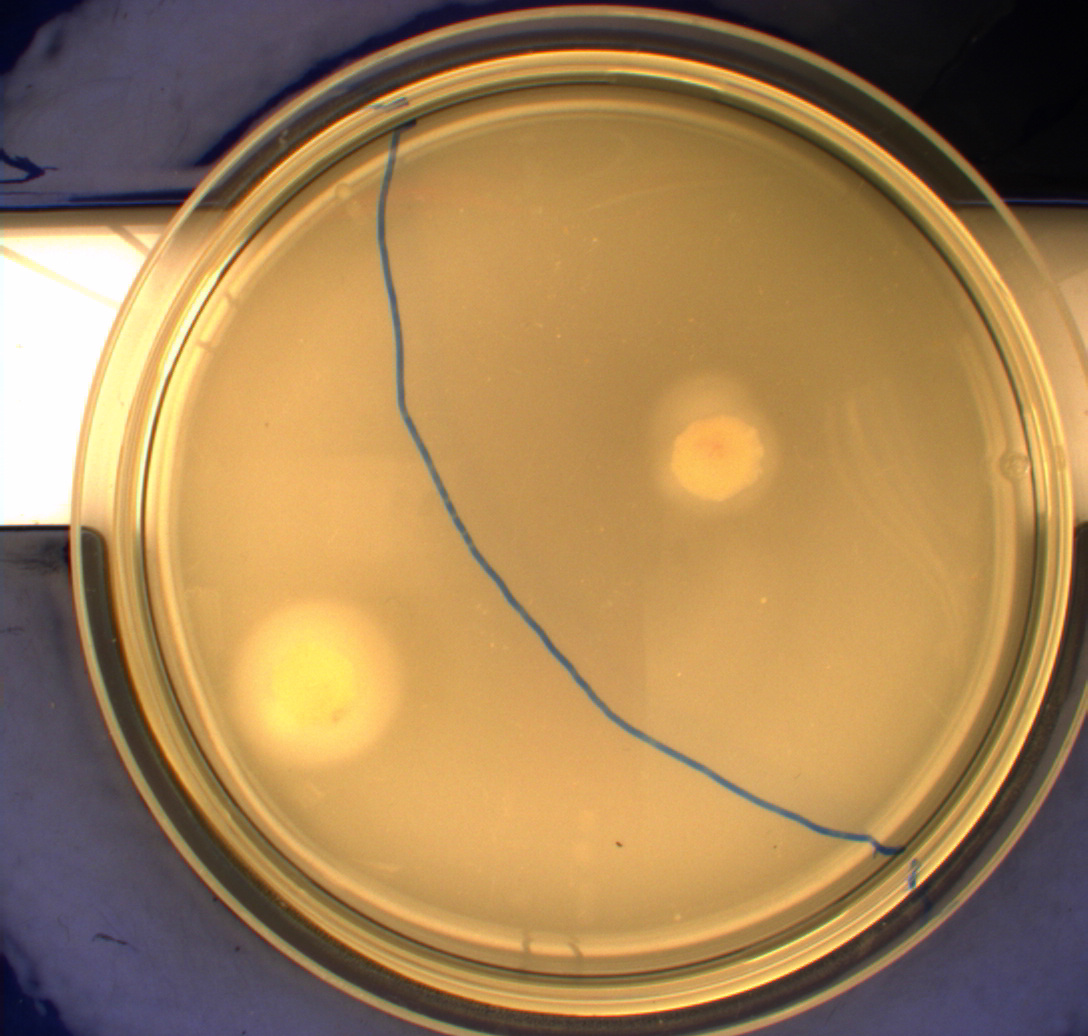
Interpreting these results is not totally obvious since the effect of different motility patterns can be counter intuitive in semisolid agar. An explanation as to how different motility patterns show up on semisolid agar plates is explained by Englert et al. in the book "Microfluidic techniques for the analysis of bacterial chemotaxis":
Polymerized agar consists of chains of extended polymers permeated by water-filled channels. At low agar concentrations (0.25– 0.4% semisolid agar) the channels are sufficiently large that the bacteria can swim through them. In the absence of chemoeffectors, cells conduct a 3D random walk through the agar matrix much as they would in liquid and spread out randomly from the point of inoculation. Since the cells are typically growing, the result is an expanding colony that forms within the agar. This “pseudotaxis” occurs in the absence of any tactic behavior. Mutant cells that only swim smoothly get trapped cul de sacs in the agar matrix (16), and their colonies do not expand significantly faster than those of nonmotile cells.
This means that if the photosensor leads to a reduced tumbling rate when exposed to blue light, it should look a lot like the colony of DH5alpha which was exposed to blue light. This is exactly the case which proves that the photosensor has an effect on the tumbling rate of the bacteria. The photosensor colony in the dark behaved like the Mg1655 colony in the dark and spread out. This is normal as cells that do not tend to either tumble or run a lot, will spread the most.
Video microscopy results
Bacteria containing the photosensor will exhibit a lowered tumbling rate when exposed to blue light (wavelengths around 350nm - 450nm). This was analysed with the help of video microscopy and the open source software [http://db.cse.ohio-state.edu/CellTrack/ "CellTrack"]. The individual cells' trajectory was tracked and their speed measured. The tracking results are as follows:
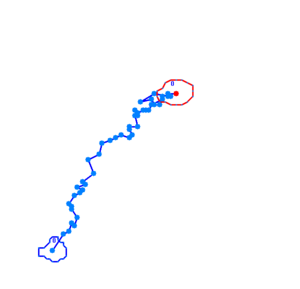
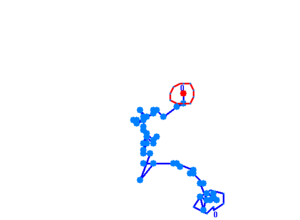
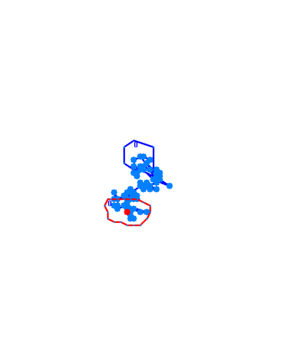
The phototaxic bacteria move more in a straight line when exposed to bluelight, as can be seen when comparing the trajectories of the three bacteria given earlier. These were taken from a batch of 10 cells tracked per sample.
Stability assay
| Stability assay. |
|
|
|
|
|
|
|
|
|
| 0
generations |
Dilution number |
Colonies counted on
plate |
Cfu |
PS-chlor/PS+chlor |
| PS1 +
chlor |
6 |
168 |
8.4E+09 |
100 |
| PS1 -
chlor |
6 |
157 |
7.85E+09 |
|
| PS2 +
chlor |
6 |
192 |
9.6E+09 |
100 |
| PS2 -
chlor |
6 |
216 |
1.08E+10 |
|
| 20
generations |
|
|
|
|
| PS1 +
chlor |
6 |
157 |
7.85E+09 |
59.24528302 |
| PS1 -
chlor |
6 |
265 |
1.325E+10 |
|
| PS2 +
chlor |
6 |
130 |
6.5E+09 |
63.41463415 |
| PS2 -
chlor |
6 |
205 |
1.025E+10 |
|
| 40
generations |
|
|
|
|
| PS1 +
chlor |
6 |
143 |
7.15E+09 |
95.97315436 |
| PS1 -
chlor |
6 |
149 |
7.45E+09 |
|
| PS2 +
chlor |
6 |
168 |
8.4E+09 |
92.81767956 |
| PS2 -
chlor |
6 |
181 |
9.05E+09 |
|
| 60
generations |
|
|
|
|
| PS1 +
chlor |
6 |
147 |
7.35E+09 |
89.63414634 |
| PS1 -
chlor |
6 |
164 |
8.2E+09 |
|
| PS2 +
chlor |
6 |
134 |
6.7E+09 |
104.6875 |
| PS2 -
chlor |
6 |
128 |
6.4E+09 |
|
| 80
generations |
|
|
|
|
| PS1 +
chlor |
6 |
127 |
6.35E+09 |
136.5591398 |
| PS1 -
chlor |
6 |
93 |
4.65E+09 |
|
| PS2 +
chlor |
6 |
99 |
4.95E+09 |
104.2105263 |
| PS2 -
chlor |
6 |
95 |
4.75E+09 |
|
| 100
generations |
|
|
|
| PS1 +
chlor |
5 |
130 |
650000000 |
125 |
| PS1 -
chlor |
5 |
104 |
520000000 |
|
| PS2 +
chlor |
5 |
124 |
620000000 |
118.0952381 |
| PS2 -
chlor |
5 |
105 |
525000000 |
|
| Number of generations |
PS1 |
PS2 |
PS
(average) |
Standard
deviations |
| 0 |
100 |
100 |
100 |
0 |
| 20 |
59.24528 |
63.41463 |
61.32995858 |
2.948176455 |
| 40 |
95.97315 |
92.81768 |
94.39541696 |
2.231257632 |
| 60 |
89.63415 |
104.6875 |
97.16082317 |
10.64432845 |
| 80 |
136.5591 |
104.2105 |
120.3848331 |
22.87392395 |
| 100 |
125 |
118.0952 |
121.547619 |
4.882403965 |
Flagella
Motility assay
Exp. 1

pSB1C3-FlhDCmutCP(LA+chlor).

pSB3K3-FlhDCmutCP(LA+Kan)
The purpose of this experiment is to see if the cells containing pSB1C3-K343004 move farther than the wild type cells. This would be an indication of hyperflagellation.
For the motility experiments we added 5ul of an ON culture to petridishes containing motility agar (LB media with 0.3% agar) instead of regular LA (Luria agar). This semifluid media lets the bacteria swimm more easily.
The plates were left in an incubator (37 degrees) for 24 hours.
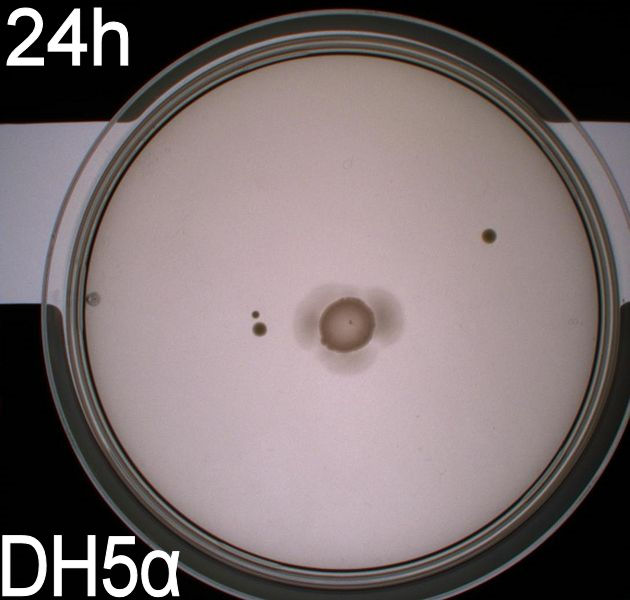
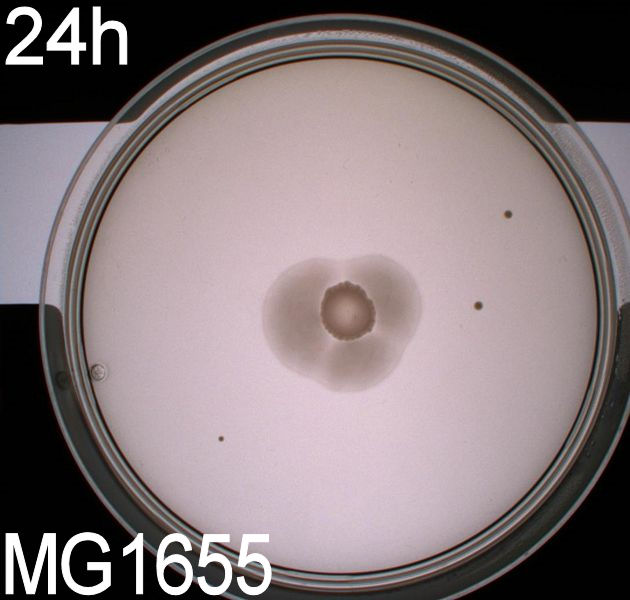
The picture number one to the left is of E. coli strain DH5alpha that does not express flagella and therefor movement in the media should be minimal. Picture number two is of the wild type E. coli strain MG1655, this strain has abour 8-10 flagella per cell. These cells are expected to move farther than the DH5alpha. Picture number three is of E. Coli strain MG1655 with pSB1C3-K343004. Picture number four is of E. coli strain MG1655 with pSB3K3-K343004.
pSB1C3 is a high copy plasmid while pSB3K3 is a low-medium copy plasmid. The pictures show that the cells with pSB3k3-K343004 moves farther than cells containing pSB1C3-K343004. The promoters in K343004 is a constitutive promoter (tetR repressable promoter), bacterias containing a high copy plasmid with a constitutive promoter is forced to This indicates a lower
Plates one and two did not contain antibiotics, and therefore contamination colonies are seen.
Retinal
UV-vis spectrophotometer determination of beta-carotene production
In this experiment cells were prepared and harvested according to protocol [1]. This experiment was performed with four different strains of E. coli:
Wildtype Top10
Wildtype MG1655
Top10 containing PSB1A2 with constitutively active K274210
MG1655 containing PSB1A2 with constitutively active K274210
The measurements were performed on cells both in the exponential and stationary phase. The resulting graphs are presented below:
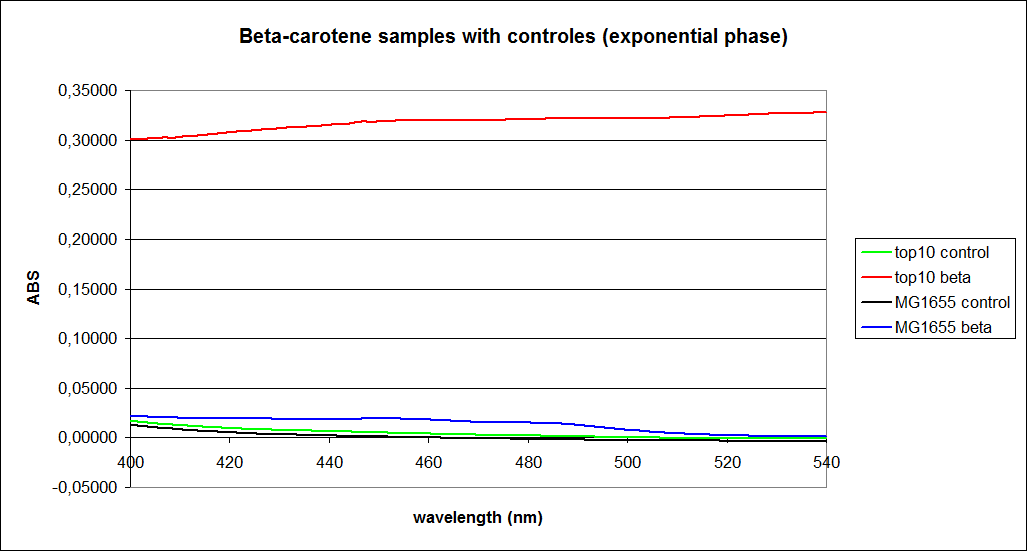
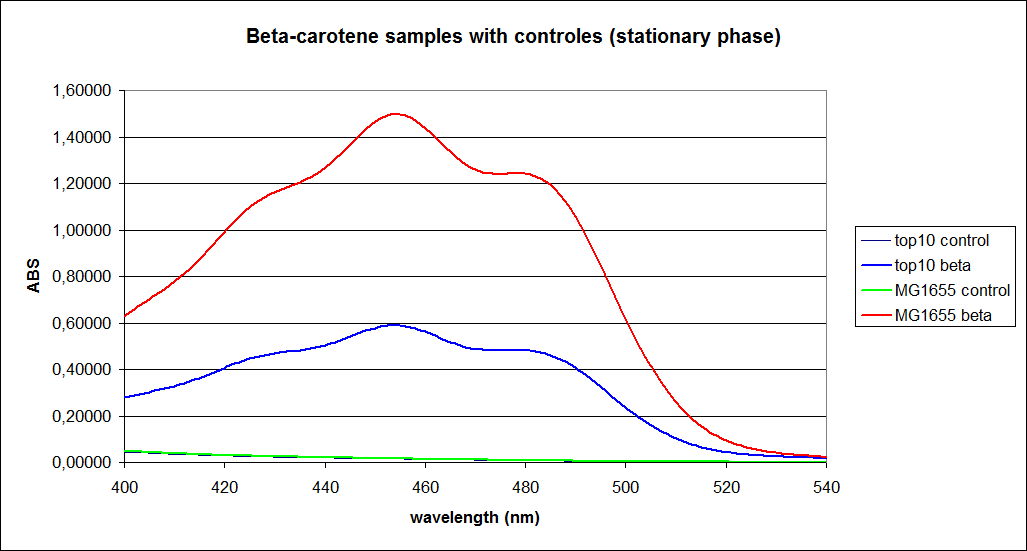
In order to assess the results, a series of standard dilutions of beta-carotene were made. The concentrations were 1mM, 100 µM, 50 µM, 25 µM, 10 µM, 5 µM, 1 µM, 100 nM and 10 nM. The standard dilutions were also measured on the spectrophotometer. The resulting graphs are presented low:
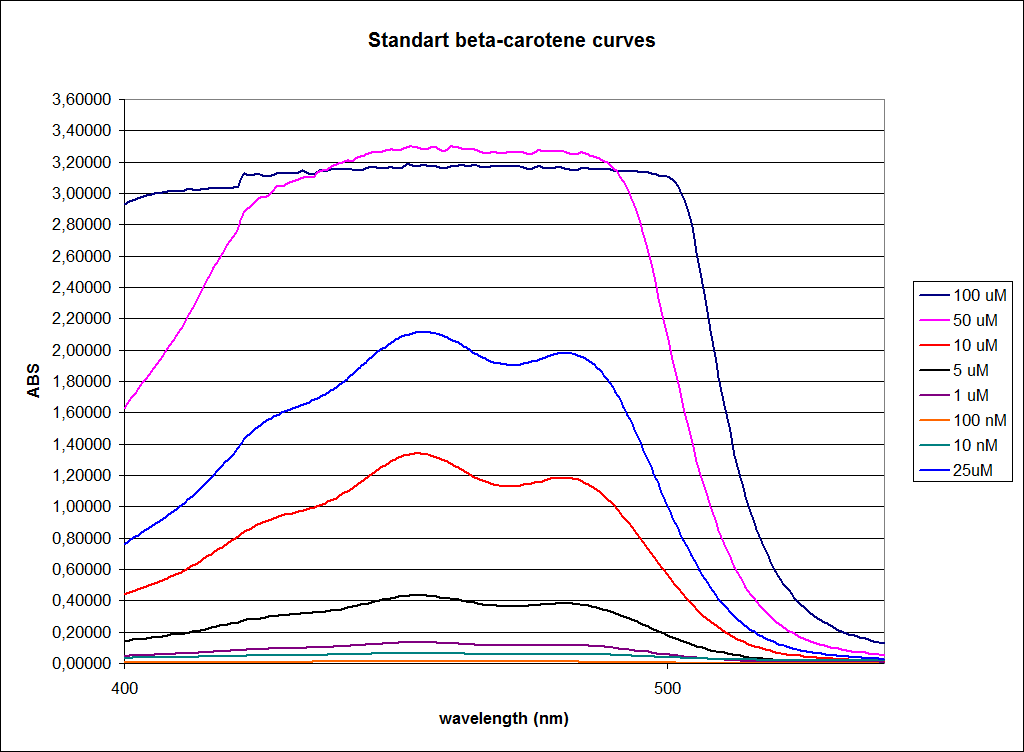
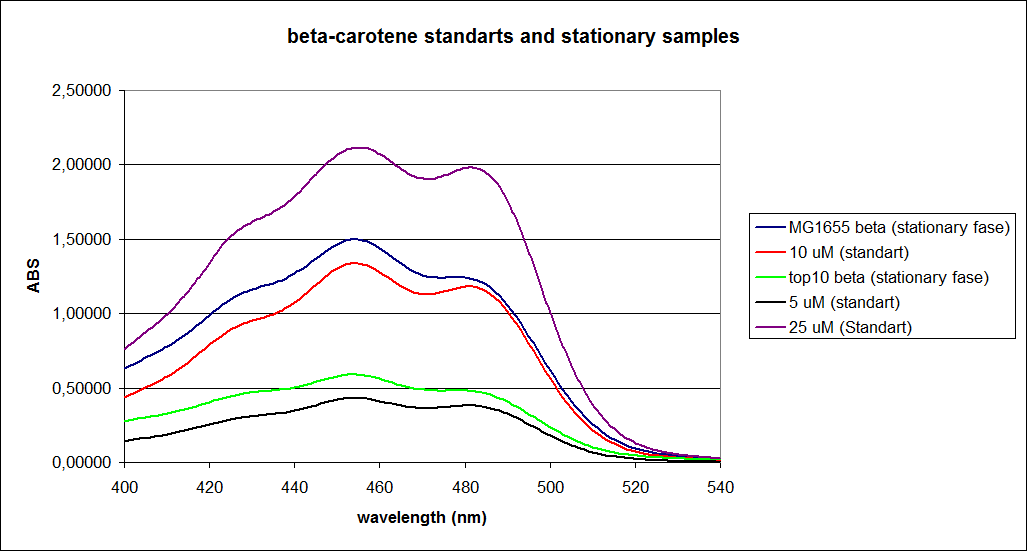
When combining the graphs of the samples and the standard dilutions, it is clear that the spectres are uniform. This similarity of the spectres indicates that the cells actually do produce beta-carotene. The graphs also give a qualitative indication of the amount of beta-carotene produced by the MG1655 and the Top10 E. coli cells. The resulting graphs are presented below:
OD measurment of MG1655
|
Mg1655 |
|
PS in pSB3T5 |
PS in pSB1C3 |
flhDC in pSB3K3 |
|
flhDC
in pSB1C3 |
|
NinaB in pSB1C3 |
| Hours |
1 |
2 |
1 |
2 |
1 |
2 |
1 |
2 |
1 |
2 |
1 |
2 |
| 0 |
0.024 |
0.026 |
0.028 |
0.03 |
0.024 |
0.024 |
0.028 |
0.027 |
0.028 |
0.027 |
0.027 |
0.027 |
| 1 |
0.082 |
0.03 |
0.058 |
0.06 |
0.059 |
0.063 |
0.069 |
0.077 |
0.052 |
0.051 |
0.084 |
0.072 |
| 2.5 |
0.58 |
0.65 |
0.42 |
0.45 |
0.48 |
0.44 |
0.52 |
0.6 |
0.38 |
0.34 |
0.31 |
0.54 |
| 3 |
1.14 |
1.16 |
0.99 |
0.91 |
0.94 |
0.94 |
1.06 |
1.16 |
0.84 |
0.78 |
1.04 |
1.03 |
| 3.83 |
1.54 |
1.66 |
1.52 |
1.31 |
1.38 |
1.37 |
1.54 |
1.72 |
1.33 |
1.25 |
1.91 |
1.45 |
| 5 |
4.4 |
4.3 |
3.2 |
3.4 |
4.2 |
3.3 |
4.2 |
2.2 |
3.9 |
4 |
3.9 |
3.9 |
| 6 |
4.7 |
4.7 |
2.8 |
4.3 |
4.2 |
3.1 |
4.7 |
4.4 |
3.8 |
5 |
3.4 |
4.7 |
| 7 |
4 |
3.8 |
3.3 |
3.8 |
4.2 |
3.2 |
4.3 |
4.7 |
4.9 |
4.5 |
3.7 |
3.9 |
| 8 |
5.5 |
6.1 |
3.9 |
4 |
3.5 |
6.8 |
4.2 |
4.8 |
5.4 |
5.3 |
4.6 |
4.6 |
| 9 |
4.1 |
4.1 |
3.4 |
2.6 |
3.6 |
4.7 |
2.6 |
3.1 |
3.7 |
3.1 |
2.6 |
3.6 |
| 10 |
4.6 |
6.1 |
5 |
4.8 |
7.8 |
4.5 |
5 |
6 |
5.3 |
5.3 |
4.4 |
4.7 |
| 11 |
5.1 |
6.2 |
4.7 |
4 |
6.1 |
7.1 |
6.6 |
8.3 |
6.6 |
6.4 |
6.2 |
4.1 |
| 12 |
5.1 |
5 |
3 |
4.4 |
4.4 |
3.9 |
4 |
4.8 |
5 |
5.3 |
4 |
4.7 |
| 24 |
5.2 |
5.6 |
3.3 |
5.4 |
6.4 |
5.8 |
4.6 |
6.4 |
7.1 |
7.4 |
5.6 |
5.2 |
 "
"


