Team:Washington/Gram Positive/Test
From 2010.igem.org
(→CapD_CP runs on a gel as one clean band) |
(→The circular permutation didn't result in a loss of activity) |
||
| Line 52: | Line 52: | ||
[[Image:Washington_CapD_CapD_CP.jpg|thumb|400px|right| '''Table 1. Kinetic properties determined for a Michaelis-Menton profile of CapD and CapD_CP, as described in our protocols section.''']] | [[Image:Washington_CapD_CapD_CP.jpg|thumb|400px|right| '''Table 1. Kinetic properties determined for a Michaelis-Menton profile of CapD and CapD_CP, as described in our protocols section.''']] | ||
| + | |||
| + | |||
In the table 1 (on the right), we show the kinetic paramters for CapD and CapD_CP as determined using our [https://2010.igem.org/Team:Washington/Protocols/EnzymeAssayCapD| enzyme assay]. | In the table 1 (on the right), we show the kinetic paramters for CapD and CapD_CP as determined using our [https://2010.igem.org/Team:Washington/Protocols/EnzymeAssayCapD| enzyme assay]. | ||
Revision as of 01:31, 21 October 2010
Contents |
Construction of CapD_CP
CapD_CP runs on a gel as one clean band
Depicted in Figure 1 is a gel comparing purified capD and capD_cp. This demonstrates one of the major advantages of CapD_CP,in addition to the fact that it is easy to express, it comes out in one clean band and is easy to quantify.
CapD shows three bands, while the lower two bands are the expected pieces that occur after the enzyme undergoes self cleavage, the upper band is of unclear origin. Its mass corresponds to what would either be the unprocessed, inactive and monomeric form of the enzymes or the dimeric form that didn't denature. This ambiguity makes the amount of active CapD enzyme difficult to quantify.
CapD_CP is expressed at EXACTLY the correct molecular weight
In Figure 2 (below) we show the mass spec conformation of the molecular weight of CapD_CP. As expected, the N-terminal methionine is cleaved off by the native E. coli methionine aminopeptidase, resulting in a high level of pure active enzyme.
The circular permutation didn't result in a loss of activity
In the table 1 (on the right), we show the kinetic paramters for CapD and CapD_CP as determined using our enzyme assay. Due to the heterogenous mix of active (processed) and inactive (unprocessed) protein, the kcat is difficult to quantify. The data we obtained suggests that the kinetic parameters of CapD and CapD_CP are within error of each other. Therefore the circular permutation of CapD did not have a negative effect on catalytic activity, suggesting that auto-processing is not required for catalysis but simply a regulatory feature.
Catalytic Residue knock-outs show that CapD_CP is catalyzing the reaction as expected
Before we could predict which mutations increase hydrolysis capability, we needed to validate that the circularly permuted version of CapD had measurable activity for further assessments. We also hypothesized a threonine residue in the catalytic site of CapD_CP plays an important role in the catalysis reaction and mutating it will eliminate all enzymatic activity. Thus using FoldIt we created two mutants, T2V and T2A, to act as negative controls and ran an enzyme assay to confirm our hypothesis. The result shown in figure 3 (below) of this assay confirmed our hypothesis that CapD_CP has enzymatic activity compared to the two catalytic knockouts. The relatively flat activity curves of the knockout mutants confirmed the hypothesis of the threonine's role in the catalytic site.
Designing CapD_CP to be a better Hydrolase
Screening Mutant Libraries
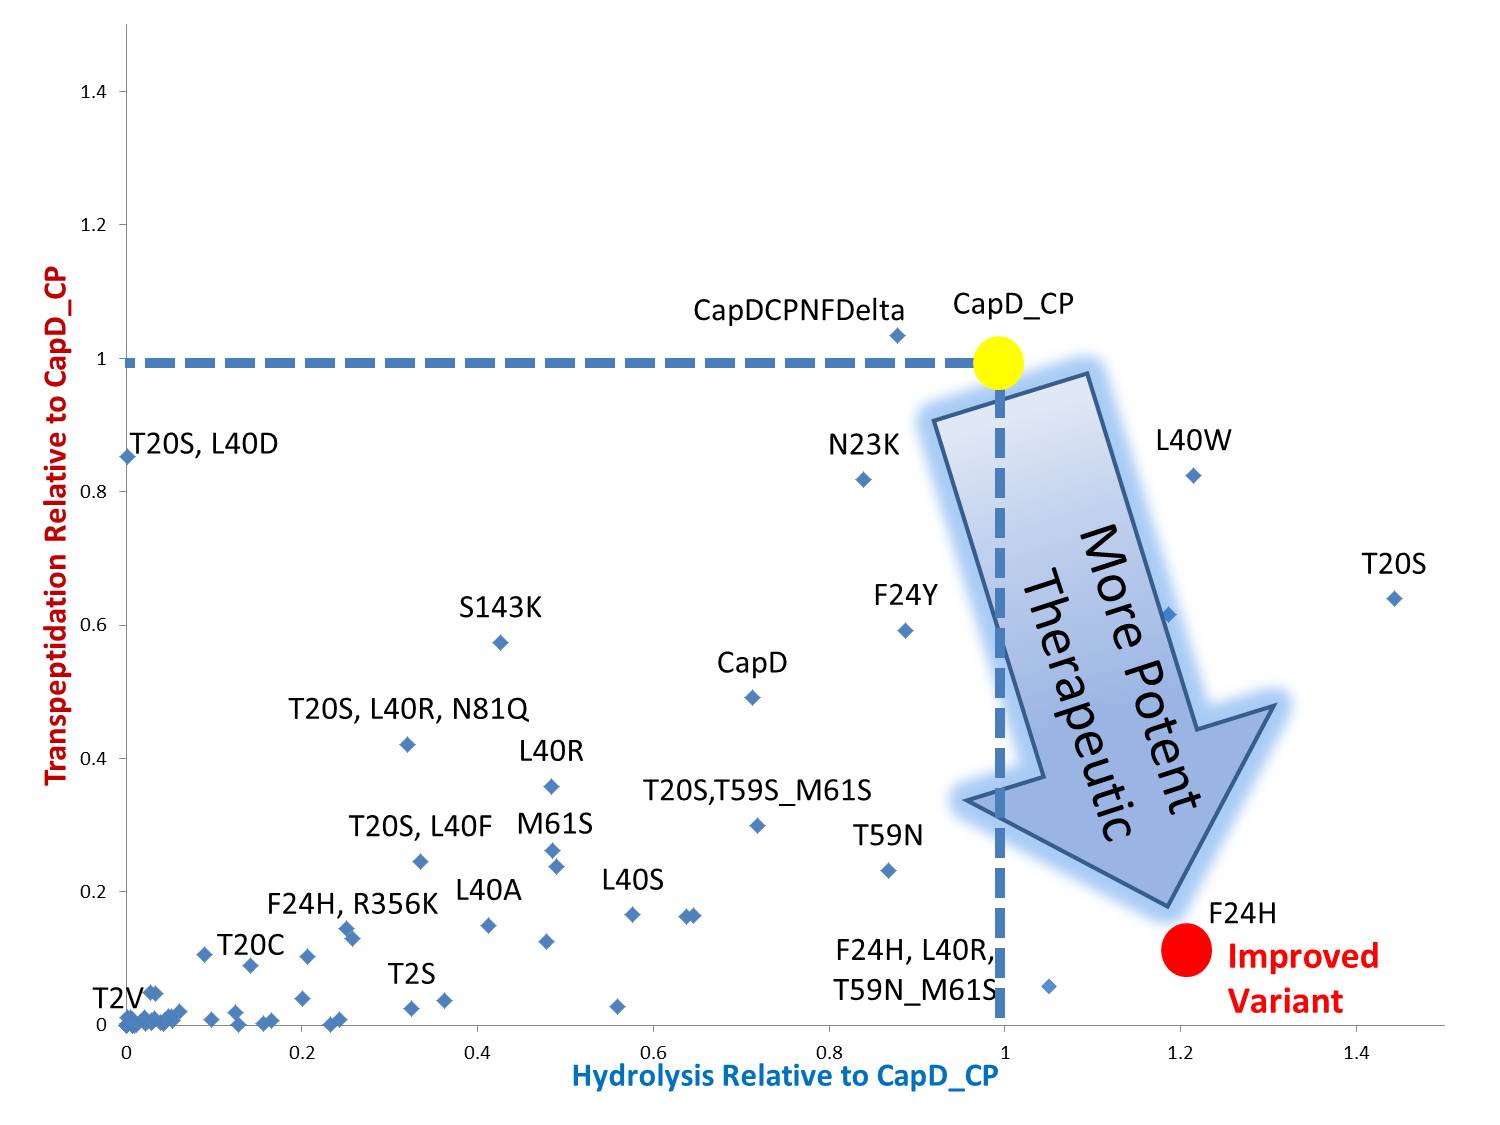
By standardizing the activity slope of each design relative to CapD_CP, a scatterplot easily portrays the qualities of each mutant. Several designs show negative catalytic curves similar to the catalytic knockouts. Some immediately show a negative activity curve meaning decrease in transpeptidation, hydrolysis, or both. F24H and L24H,L40R,T59N_M61S are promising mutants hydrolase design.
Characterization of best hits
blah blah blah
 "
"


