Team:SDU-Denmark/project-r
From 2010.igem.org
(Difference between revisions)
m (→Results) |
(→Results) |
||
| Line 22: | Line 22: | ||
| - | == | + | === Video microscopy results === |
| + | <br> | ||
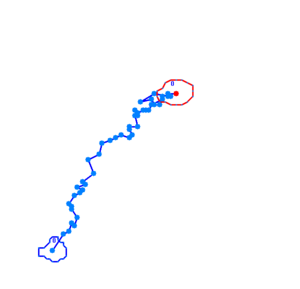
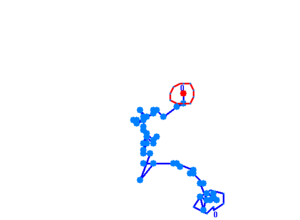
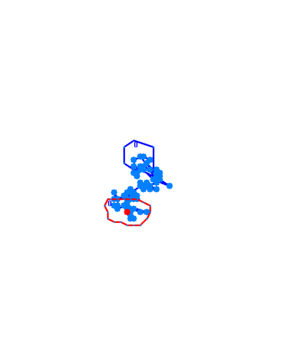
Bacteria containing the photosensor will exhibit a lowered tumbling rate when exposed to blue light (wavelengths around 350nm - 450nm). This was analysed with the help of video microscopy and the open source software [http://db.cse.ohio-state.edu/CellTrack/ "CellTrack"]. The individual cells trajectory was tracked and their speed measured. The tracking results are as follows: | Bacteria containing the photosensor will exhibit a lowered tumbling rate when exposed to blue light (wavelengths around 350nm - 450nm). This was analysed with the help of video microscopy and the open source software [http://db.cse.ohio-state.edu/CellTrack/ "CellTrack"]. The individual cells trajectory was tracked and their speed measured. The tracking results are as follows: | ||
<br> | <br> | ||
| Line 32: | Line 33: | ||
== Retinal == | == Retinal == | ||
| - | == | + | === UV-Vis spectrophotometer determination of beta-carotene production === |
| + | <br> | ||
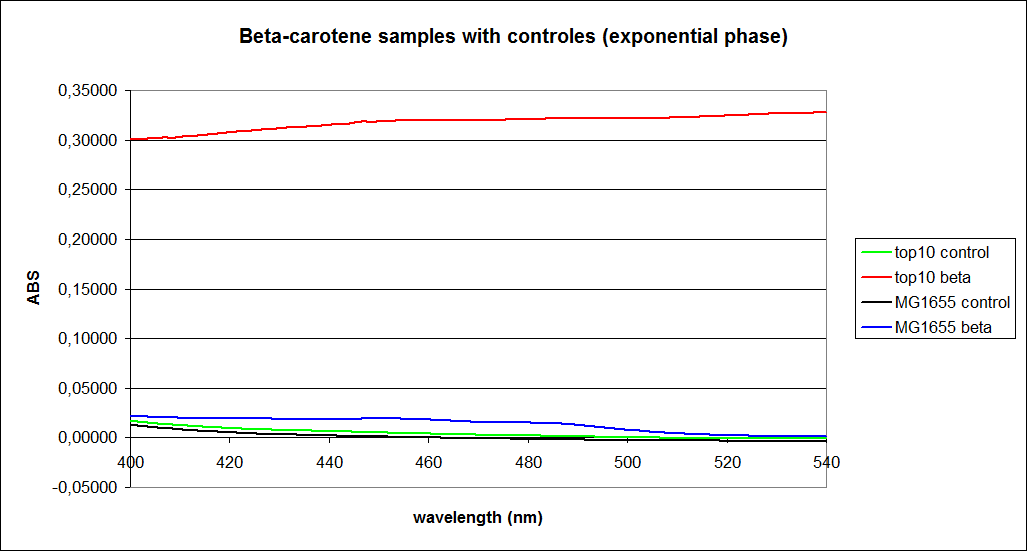
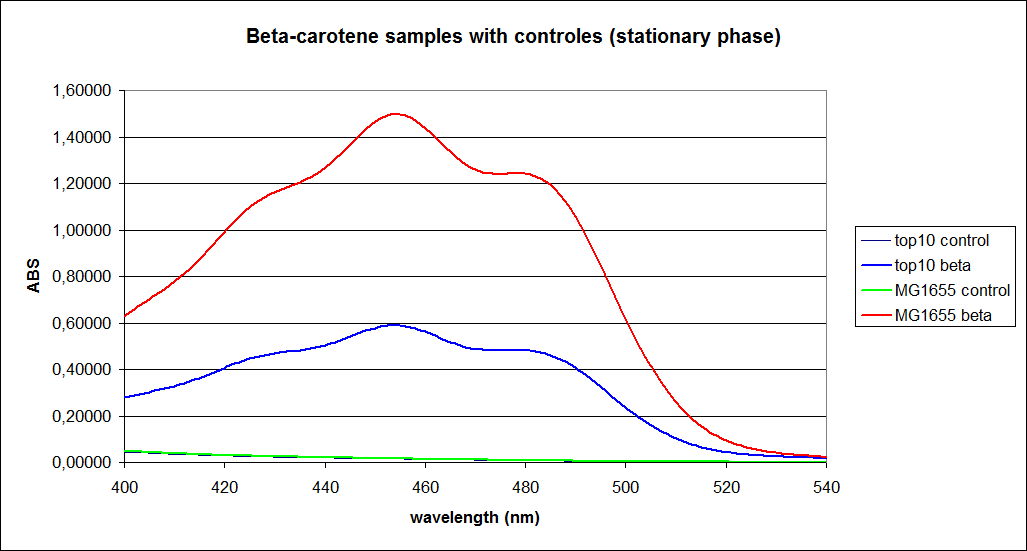
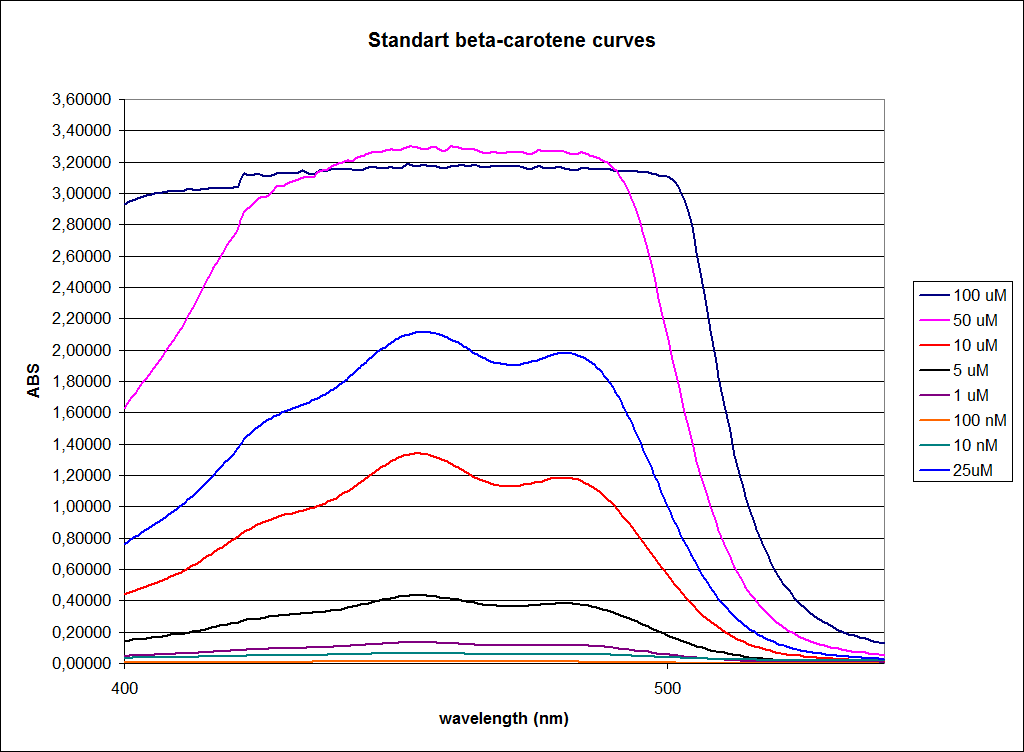
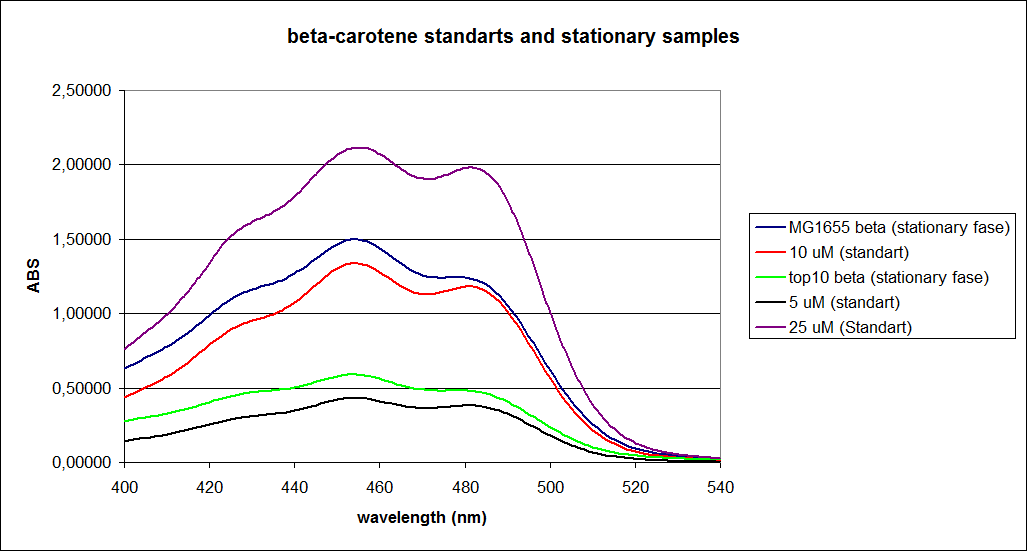
In this experiment cells was prepare and harvested according to protocol [https://2010.igem.org/Team:SDU-Denmark/protocols#EX1.1]. This experiment was preformed with four different strain of E. Coli – wildtype Top10, wildtype MG1655, Top10 containing PSB1A2 with K274210 constitutively active and MG1655 containing PSB1A2 with K274210 constitutively active. The measurements were preformed on cells both in the exponential and stationary phase. The resulting graphs is presented beneath the text<br> | In this experiment cells was prepare and harvested according to protocol [https://2010.igem.org/Team:SDU-Denmark/protocols#EX1.1]. This experiment was preformed with four different strain of E. Coli – wildtype Top10, wildtype MG1655, Top10 containing PSB1A2 with K274210 constitutively active and MG1655 containing PSB1A2 with K274210 constitutively active. The measurements were preformed on cells both in the exponential and stationary phase. The resulting graphs is presented beneath the text<br> | ||
[[Image:Team-SDU-denmarkBetacarotene samples with controles (exponential_phase).png |350px]] | [[Image:Team-SDU-denmarkBetacarotene samples with controles (exponential_phase).png |350px]] | ||
Revision as of 18:54, 19 October 2010
 "
"
