Team:St Andrews/project/modelling/model 4
From 2010.igem.org
(→Results) |
|||
| (15 intermediate revisions not shown) | |||
| Line 6: | Line 6: | ||
=Theory & assumptions= | =Theory & assumptions= | ||
| + | |||
| + | Although our previous work presented many insights into the LuxR quorum sensing system, a new model of further complexity was deemed necessary to investigate some of the subtleties of bistable behaviour. This was accomplished by changing focus from the interactions in one cell, to the population of bacteria as a whole. In doing this, not only were we able to reproduce the results from previous models on a population-wide scale, but our results would be empirically verifiable in the lab. | ||
| + | |||
| + | The primary development from previous models - the change of focus from one cell to the whole culture - was implemented by making many small adjustments to the previous differential equations we used. In addition to the biochemical reactions changing chemical concentrations, we also had a volumetric term describing the increase of volume (and subsequent decrease in concentration) as new cells were added to the colony. This can be understood by taking the time derivative of the HSL concentration: | ||
| + | |||
| + | [[Image:4line1.gif|369px]] | ||
| + | |||
| + | [[Image:4line2.gif|488px]] | ||
| + | |||
| + | Previous models only included the first term of this equation - changes in the concentration due to biochemical processes inside the cell. In this form the concentration was also diluted by the second term as more bacteria were added to the system (when cells undergo binary fusion we assume the cell contents are equally distributed to both parent and daughter). | ||
| + | |||
| + | Similar to model 3, the cell density was initially increased by a cell growth function, where the number of bacteria doubled every 20 minutes. Having ran to a realistic maximum cell density, there was a stationary phase in the cell growth to allow steady state concentrations of chemicals to be realised. The cell death function was then called, and the cell density was ran back to it's starting value. | ||
| + | |||
| + | =Results= | ||
| + | |||
| + | Our results show that in accordance with our single cell models, there is clear switching behaviour in the LuxR system. One point of interest is how the cell density at which the system becomes "up regulated" has changed from 10^6 CFU/ml to 10^9 CFU/ml. Tests have been carried out to confirm that this is related to the "diffusion constant" which describes the extent to which the cross-membrane concentration gradient of the signalling molecule (HSL) effects the rate of flow of HSL out of the cell. This shifted activation point can be seen below: | ||
| + | |||
| + | [[Image:Number_of_GFP_Molecules.JPG|800px]] | ||
| + | |||
| + | '''Figure 1: Number of GFP molecues in system against cell density''' | ||
| + | |||
| + | This graph shows the output of the model having been run through only the growth phase. As discussed above, the point at which the system becomes up-regulated in this setting has changed quite drastically from previous models. All other protein levels are in line with our previous calculations. | ||
| + | |||
| + | [[Image:GFPConcentration.JPG|821px]] | ||
| + | |||
| + | '''Figure 2: GFP concentration against cell density (Up and Down)''' | ||
| + | |||
| + | [[Image:GFP_fixed.JPG|821px]] | ||
| + | |||
| + | '''Figure 3: Number of GFP molecues in system against cell density (Up and Down)''' | ||
| + | |||
| + | Here we have the GFP profile for the full cell growth and death cycle. Bistability is evident - indeed the system does not appear to turn "off" for the range of cell densities we have run through. Once again this anomaly can be analysed by considering the diffusion of HSL out of the cell. | ||
| + | |||
| + | [[Image:HSLINOUTONOFF.JPG|821px]] | ||
| + | |||
| + | '''Figure 4: HSL concentration against cell density ''' | ||
| + | |||
| + | Analysing this graphic tells us why the system doesn't revert back to it's down regulated state at any point in our simulation. As expected, when in the growth phase (the blue line) the concentration of HSL inside and outside the cells is the same. However, when the cells number is decreased (the red and green lines) this is not the case. It appears that the concentration outside is reduced but the concentration inside is the same at 10^10 CFU/ml as it is at 10000 CFU/ml. This explains why the GFP concentration does not decrease on the down phase of the simulation - ''' although the number of HSL molecules has diminished for the whole system, there is an uneven distribution in favour of the cell interior '''. | ||
| + | |||
| + | = Conclusions= | ||
| + | While initial results from this model looked promising, the development of it was incomplete and further work would be required to realise its full potential. | ||
Latest revision as of 02:58, 28 October 2010


Model 4: Pseudo Multi Cell Two Dimensions
Theory & assumptions
Although our previous work presented many insights into the LuxR quorum sensing system, a new model of further complexity was deemed necessary to investigate some of the subtleties of bistable behaviour. This was accomplished by changing focus from the interactions in one cell, to the population of bacteria as a whole. In doing this, not only were we able to reproduce the results from previous models on a population-wide scale, but our results would be empirically verifiable in the lab.
The primary development from previous models - the change of focus from one cell to the whole culture - was implemented by making many small adjustments to the previous differential equations we used. In addition to the biochemical reactions changing chemical concentrations, we also had a volumetric term describing the increase of volume (and subsequent decrease in concentration) as new cells were added to the colony. This can be understood by taking the time derivative of the HSL concentration:
Previous models only included the first term of this equation - changes in the concentration due to biochemical processes inside the cell. In this form the concentration was also diluted by the second term as more bacteria were added to the system (when cells undergo binary fusion we assume the cell contents are equally distributed to both parent and daughter).
Similar to model 3, the cell density was initially increased by a cell growth function, where the number of bacteria doubled every 20 minutes. Having ran to a realistic maximum cell density, there was a stationary phase in the cell growth to allow steady state concentrations of chemicals to be realised. The cell death function was then called, and the cell density was ran back to it's starting value.
Results
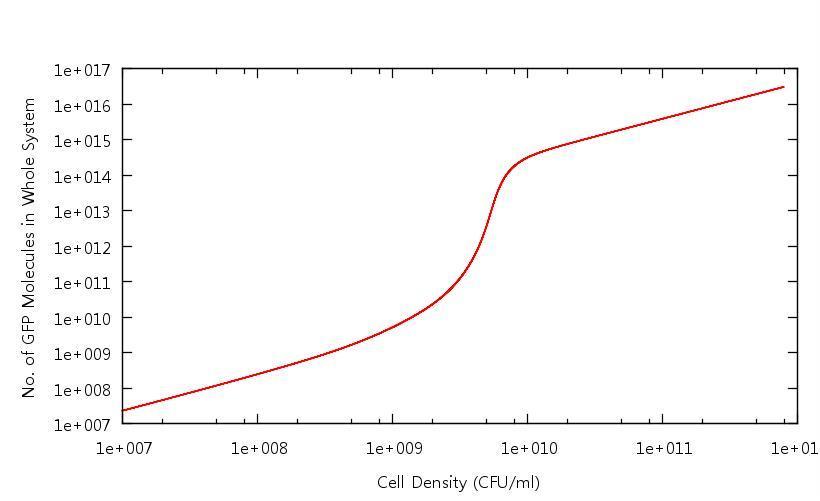
Our results show that in accordance with our single cell models, there is clear switching behaviour in the LuxR system. One point of interest is how the cell density at which the system becomes "up regulated" has changed from 10^6 CFU/ml to 10^9 CFU/ml. Tests have been carried out to confirm that this is related to the "diffusion constant" which describes the extent to which the cross-membrane concentration gradient of the signalling molecule (HSL) effects the rate of flow of HSL out of the cell. This shifted activation point can be seen below:
Figure 1: Number of GFP molecues in system against cell density
This graph shows the output of the model having been run through only the growth phase. As discussed above, the point at which the system becomes up-regulated in this setting has changed quite drastically from previous models. All other protein levels are in line with our previous calculations.
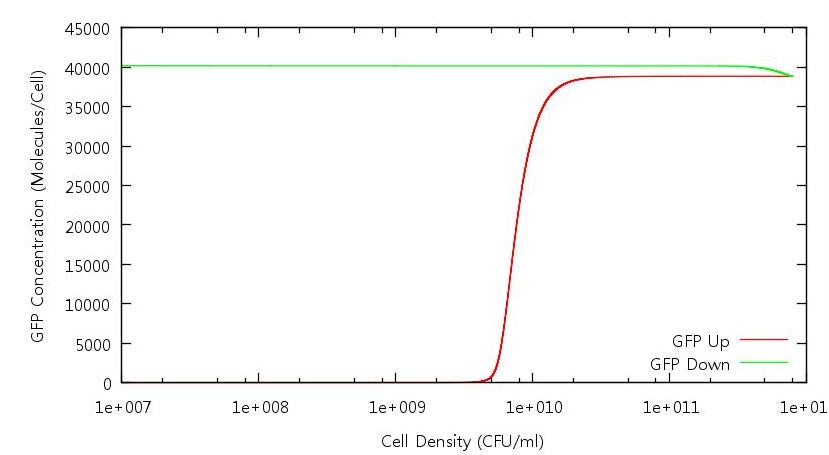
Figure 2: GFP concentration against cell density (Up and Down)
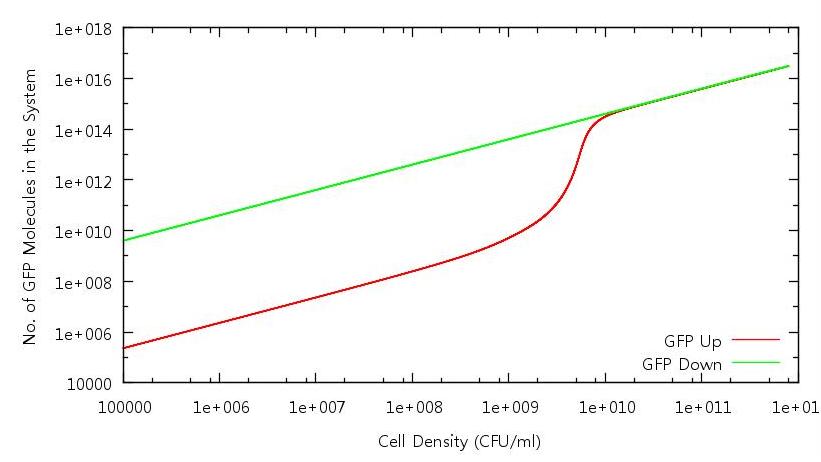
Figure 3: Number of GFP molecues in system against cell density (Up and Down)
Here we have the GFP profile for the full cell growth and death cycle. Bistability is evident - indeed the system does not appear to turn "off" for the range of cell densities we have run through. Once again this anomaly can be analysed by considering the diffusion of HSL out of the cell.
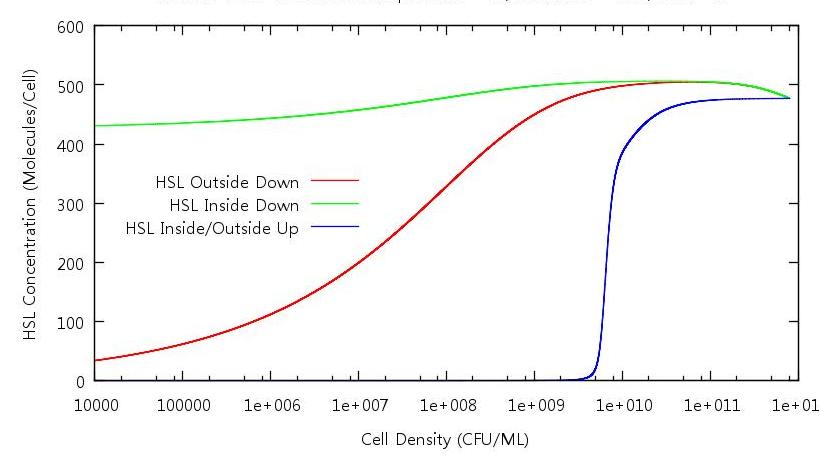
Figure 4: HSL concentration against cell density
Analysing this graphic tells us why the system doesn't revert back to it's down regulated state at any point in our simulation. As expected, when in the growth phase (the blue line) the concentration of HSL inside and outside the cells is the same. However, when the cells number is decreased (the red and green lines) this is not the case. It appears that the concentration outside is reduced but the concentration inside is the same at 10^10 CFU/ml as it is at 10000 CFU/ml. This explains why the GFP concentration does not decrease on the down phase of the simulation - although the number of HSL molecules has diminished for the whole system, there is an uneven distribution in favour of the cell interior .
Conclusions
While initial results from this model looked promising, the development of it was incomplete and further work would be required to realise its full potential.
 "
"


