Team:TU Delft/Project/alkane-degradation/results
From 2010.igem.org
(→Characterization of the ALdehyde DeHydrogenase system) |
(→Useful Literature and References) |
||
| (48 intermediate revisions not shown) | |||
| Line 3: | Line 3: | ||
<html><center><img src="https://static.igem.org/mediawiki/2010/0/00/TU_Delft_project_navigation.jpg" usemap="#projectnavigation" border="0" /></center><map id="projectnavigation" name="projectnavigation"><area shape="rect" alt="Characterization" title="" coords="309,3,591,45" href="https://2010.igem.org/Team:TU_Delft#page=Project/alkane-degradation/characterization" target="" /><area shape="rect" alt="Results" title="" coords="609,3,891,44" href="https://2010.igem.org/Team:TU_Delft#page=Project/alkane-degradation/results" target="" /><area shape="rect" alt="Parts" title="" coords="9,3,290,44" href="https://2010.igem.org/Team:TU_Delft#page=Project/alkane-degradation/parts" target="" /></map></html> | <html><center><img src="https://static.igem.org/mediawiki/2010/0/00/TU_Delft_project_navigation.jpg" usemap="#projectnavigation" border="0" /></center><map id="projectnavigation" name="projectnavigation"><area shape="rect" alt="Characterization" title="" coords="309,3,591,45" href="https://2010.igem.org/Team:TU_Delft#page=Project/alkane-degradation/characterization" target="" /><area shape="rect" alt="Results" title="" coords="609,3,891,44" href="https://2010.igem.org/Team:TU_Delft#page=Project/alkane-degradation/results" target="" /><area shape="rect" alt="Parts" title="" coords="9,3,290,44" href="https://2010.igem.org/Team:TU_Delft#page=Project/alkane-degradation/parts" target="" /></map></html> | ||
==Alkane Degradation Results & Conclusions== | ==Alkane Degradation Results & Conclusions== | ||
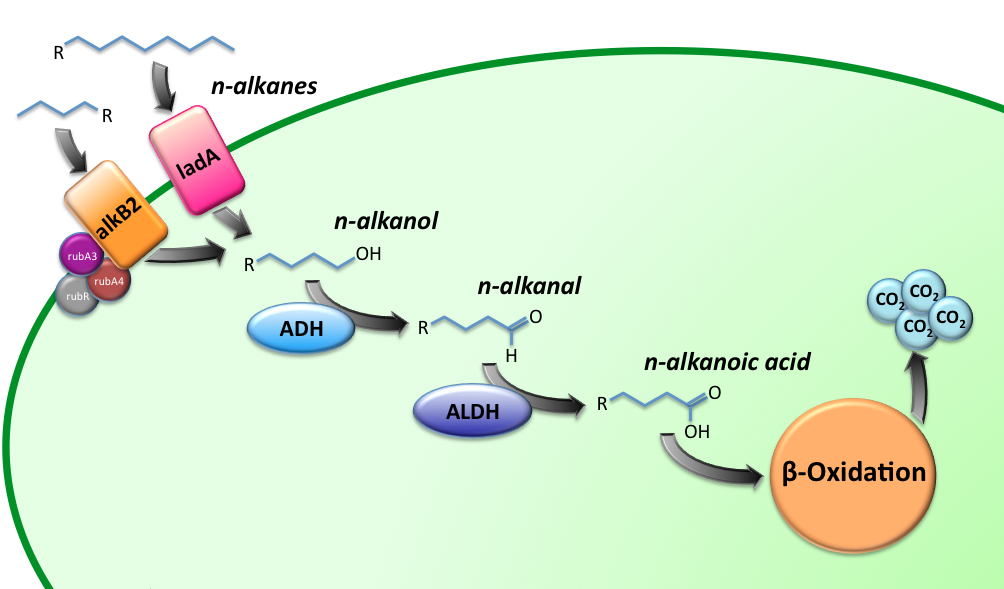
| - | [[Image:TUDelft_Alkane_degradation_route.png|600px|thumb|center|'''Figure 1''' – Schematic description of the alkane degradation pathway with the corresponding genes.]] | + | [[Image:TUDelft_Alkane_degradation_route.png|600px|thumb|center|'''Figure 1.''' – Schematic description of the alkane degradation pathway with the corresponding genes.]] |
| - | === | + | ===[https://2010.igem.org/Team:TU_Delft/Project/alkane-degradation/results/alkane_hydroxylase Characterization of the alkane hydroxylase system (AlkB2-system)]=== |
| - | + | ||
| - | + | ||
| - | |||
| - | |||
| - | |||
| - | + | From the ratios hexadecane/undecane obtained from GC chromatograms, we may conclude that the samples obtained from the ''E.coli'' strain, carrying the AH system, contain relatively less octane than the control strain. By comparing peak ratios we were able to estimate the specific enzymatic activity of the system, which was found to be 0.045 U/mg. | |
| - | + | ||
| - | [[ | + | For more information about our findings, read the [[Team:TU_Delft/Project/alkane-degradation/results/alkane_hydroxylase|detailed alkane hydroxylase results]] page. |
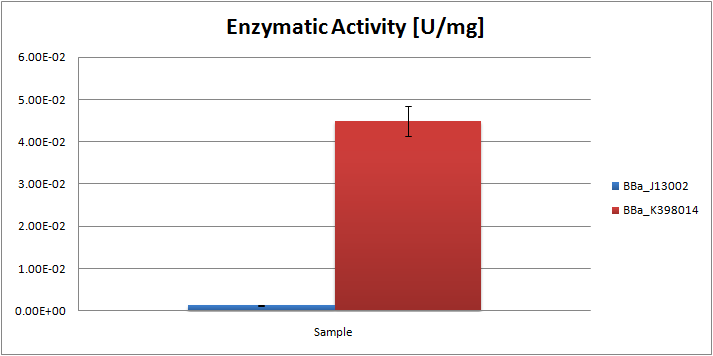
| - | [[Image: | + | [[Image:TUDelft_AlkB2_Total.png|600px|thumb|center|'''Figure 2.''' Enzyme activity [U/mg total protein] of alkane hydroxylase system as compared to the negative control ''E.coli'' K12 strain]] |
| - | + | ||
| - | + | ===[https://2010.igem.org/Team:TU_Delft/Project/alkane-degradation/results/LadA Characterization of the long-chain alkane monooxygenase (LadA)]=== | |
| - | + | ||
| - | + | ||
| - | + | ||
| - | + | ||
| - | + | ||
| - | + | ||
| - | + | ||
| - | + | ||
| - | + | ||
| - | + | ||
| - | + | ||
| - | + | ||
| - | + | ||
| - | The | + | The analysis of the obtained GC graphs allowed us to estimate the enzymatic activity. We observed a significant increase in enzyme activity in the strains carrying the ladA protein generator compared to the negative control strain. The highest enzyme activity value was found to be 3.33E-03 U/mg protein. In order to know more about the characterization of this system, read the [[Team:TU_Delft/Project/alkane-degradation/results/LadA|detailed LadA results]] page. |
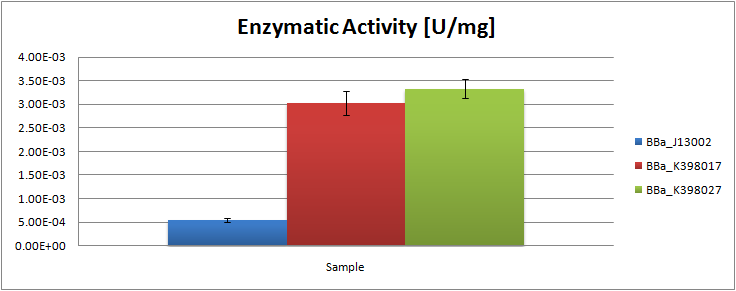
| - | + | [[Image:TUDelft_LadA Total.png|600px|thumb|center|'''Figure 3.''' Enzyme activity [U/mg lysate] of the alkane monooxygenase LadA as compared to the negative control ''E.coli'' K12 strain]] | |
| - | + | ===[https://2010.igem.org/Team:TU_Delft/Project/alkane-degradation/results/ADH Characterization of Alcohol Dehydrogenase (ADH)]=== | |
| - | + | According to our results, the ''E. coli'' cell extract has a dodecanol-1 dehydrogenase activity of 9.64e-12 kat/mg (0.58 mU/mg); whereas our recombinant strain expressing the Biobrick [http://partsregistry.org/Part:BBa_K398018 BBa_K398018] has an activity of 2.93e-11 kat/mg (1.76 mU/mg), an improvement of 2-fold compared to the wild type activity; which also means 3% of the activity of the positive control ''Pseudomonas putida''. | |
| - | + | ||
| - | + | ||
| - | + | ||
| - | + | ||
| - | + | ||
| - | + | ||
| - | + | ||
| - | + | ||
| - | + | ||
| - | + | ||
| - | + | ||
| - | + | ||
| - | + | ||
| - | + | ||
| - | + | ||
| - | + | ||
| - | + | ||
| - | + | ||
| - | + | ||
| - | + | ||
| - | + | ||
| - | + | ||
| - | + | ||
| - | + | ||
| - | + | ||
| - | + | ||
| - | + | ||
| - | + | ||
| - | + | ||
| - | + | ||
| - | + | ||
| - | + | ||
| - | + | ||
| - | + | ||
| - | + | If you are interested in knowing more about our findings, read the [[Team:TU_Delft/Project/alkane-degradation/results/ADH|detailed ADH results]] page. | |
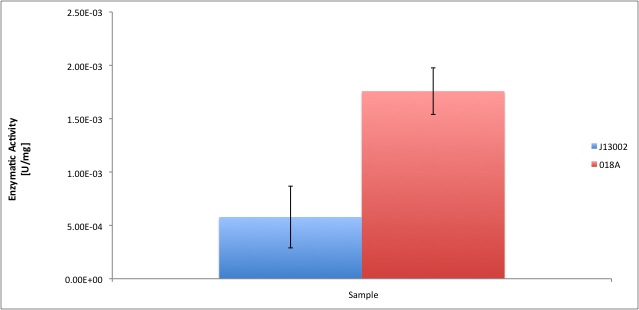
| - | + | [[Image:TUDelftADH_final.jpg|600px|thumb|center|'''Figure 4.''' Comparison between E. coli ADH activity and our recombinant strain. ]] | |
| - | + | ||
| - | + | ||
| - | + | ||
| - | + | ||
| - | ===Characterization of | + | ===[https://2010.igem.org/Team:TU_Delft/Project/alkane-degradation/results/ALDH Characterization of Aldehyde Dehydrogenase (ALDH)]=== |
| - | + | ||
| - | + | ||
| - | + | Our results suggest that the recombinant strains ''E. coli'' 029A and ''E. coli'' 030A functionally express our biobricks. The expression of ALDH under the promoter-rbs combination [http://partsregistry.org/Part:BBa_J13002 BBa_J23100]-[http://partsregistry.org/Part:BBa_J13002 BBa_J61117] increases the dodecanal dehydrogenase activity in ''E. coli'' cell extracts 2-fold; whereas the expression of the same protein using the part [http://partsregistry.org/Part:BBa_J13002 BBa_J13002] as promoter-rbs combo increases the same activity 3-fold. | |
| - | Our | + | |
| - | + | ||
| - | + | ||
| - | + | ||
| - | + | Moreover, the enzymatic activities measured for the constructs [http://partsregistry.org/Part:BBa_K398029 BBa_K398029] and [http://partsregistry.org/Part:BBa_K398030 BBa_K398030] were equivalent to 33.98% and 42.01% of the ''Pseudomonas putida'' aldehyde dehydrogenase activity, respectively. | |
| - | [[ | + | If you want to know more about of our findings, read the [[Team:TU_Delft/Project/alkane-degradation/results/ALDH|detailed ALDH results]] page. |
| - | + | It is worthy to mention that our part expresses the protein in a lower amount, meaning that cells express a highly active protein. Thus the cellular resources are spent in a more efficient way than in the strain that overproduces ALDH. | |
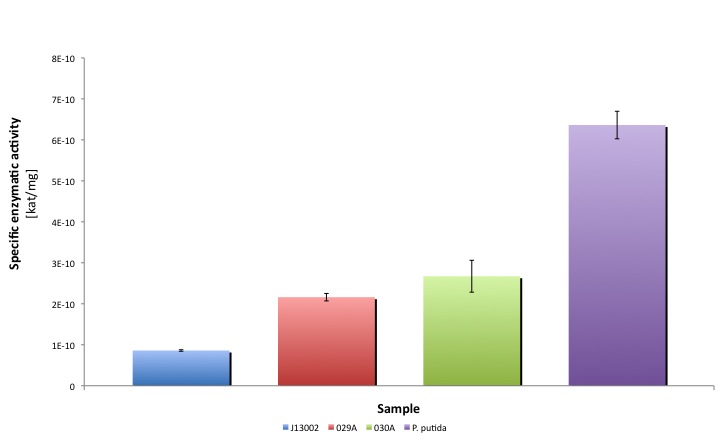
| - | + | [[Image:TUDelftALDH_final.jpg|600px|thumb|center|'''Figure 5.''' Comparison of ALDH activities in the different strains tested in this study]] | |
| - | |||
| - | |||
| - | |||
| - | |||
| - | |||
| - | |||
| - | |||
| - | |||
| - | |||
| - | |||
| - | |||
| - | |||
| - | |||
| - | |||
| - | |||
| - | + | ===References=== | |
| - | + | ||
| - | + | ||
| - | + | ||
| - | + | ||
| - | + | ||
| - | + | ||
| - | + | ||
| - | + | ||
| - | + | ||
| - | + | ||
| - | + | ||
| - | + | ||
| - | + | ||
| - | + | ||
| - | + | ||
| - | + | ||
| - | + | ||
| - | + | ||
| - | + | ||
| - | + | ||
| - | + | ||
| - | + | ||
| - | + | ||
| - | + | ||
| - | + | ||
| - | + | ||
| - | + | ||
| - | + | ||
| - | + | ||
| - | + | ||
| - | + | ||
| - | + | ||
| - | + | ||
| - | + | ||
| - | + | ||
| - | + | ||
| - | + | ||
| - | + | ||
| - | + | ||
| - | + | ||
| - | + | ||
| - | + | ||
| - | + | ||
| - | + | ||
| - | + | ||
| - | + | ||
| - | + | ||
| - | + | ||
| - | + | ||
| - | + | ||
| - | + | ||
| - | + | ||
| - | + | ||
| - | + | ||
| - | + | ||
#Kato T. et al. "Gene cloning and characterization of an aldehyde dehydrogenase from long-chain alkane-degrading ''Geobacillus thermoleovorans'' B23" Extremophiles (2010) 14:33-39. | #Kato T. et al. "Gene cloning and characterization of an aldehyde dehydrogenase from long-chain alkane-degrading ''Geobacillus thermoleovorans'' B23" Extremophiles (2010) 14:33-39. | ||
#http://mbel.kaist.ac.kr/lab/research/protein_en1.html | #http://mbel.kaist.ac.kr/lab/research/protein_en1.html | ||
Latest revision as of 22:32, 27 October 2010

Alkane Degradation Results & Conclusions
Characterization of the alkane hydroxylase system (AlkB2-system)
From the ratios hexadecane/undecane obtained from GC chromatograms, we may conclude that the samples obtained from the E.coli strain, carrying the AH system, contain relatively less octane than the control strain. By comparing peak ratios we were able to estimate the specific enzymatic activity of the system, which was found to be 0.045 U/mg.
For more information about our findings, read the detailed alkane hydroxylase results page.
Characterization of the long-chain alkane monooxygenase (LadA)
The analysis of the obtained GC graphs allowed us to estimate the enzymatic activity. We observed a significant increase in enzyme activity in the strains carrying the ladA protein generator compared to the negative control strain. The highest enzyme activity value was found to be 3.33E-03 U/mg protein. In order to know more about the characterization of this system, read the detailed LadA results page.
Characterization of Alcohol Dehydrogenase (ADH)
According to our results, the E. coli cell extract has a dodecanol-1 dehydrogenase activity of 9.64e-12 kat/mg (0.58 mU/mg); whereas our recombinant strain expressing the Biobrick [http://partsregistry.org/Part:BBa_K398018 BBa_K398018] has an activity of 2.93e-11 kat/mg (1.76 mU/mg), an improvement of 2-fold compared to the wild type activity; which also means 3% of the activity of the positive control Pseudomonas putida.
If you are interested in knowing more about our findings, read the detailed ADH results page.
Characterization of Aldehyde Dehydrogenase (ALDH)
Our results suggest that the recombinant strains E. coli 029A and E. coli 030A functionally express our biobricks. The expression of ALDH under the promoter-rbs combination [http://partsregistry.org/Part:BBa_J13002 BBa_J23100]-[http://partsregistry.org/Part:BBa_J13002 BBa_J61117] increases the dodecanal dehydrogenase activity in E. coli cell extracts 2-fold; whereas the expression of the same protein using the part [http://partsregistry.org/Part:BBa_J13002 BBa_J13002] as promoter-rbs combo increases the same activity 3-fold.
Moreover, the enzymatic activities measured for the constructs [http://partsregistry.org/Part:BBa_K398029 BBa_K398029] and [http://partsregistry.org/Part:BBa_K398030 BBa_K398030] were equivalent to 33.98% and 42.01% of the Pseudomonas putida aldehyde dehydrogenase activity, respectively.
If you want to know more about of our findings, read the detailed ALDH results page.
It is worthy to mention that our part expresses the protein in a lower amount, meaning that cells express a highly active protein. Thus the cellular resources are spent in a more efficient way than in the strain that overproduces ALDH.
References
- Kato T. et al. "Gene cloning and characterization of an aldehyde dehydrogenase from long-chain alkane-degrading Geobacillus thermoleovorans B23" Extremophiles (2010) 14:33-39.
- http://mbel.kaist.ac.kr/lab/research/protein_en1.html
- Hoffmann F. and Rinas U. "Stress Induced by Recombinant Protein Production in Escherichia coli" Advances in Biochemical Engineering/Biotechnology, 2004, Vol. 89/2004, pp. 73-92.

 "
"
