Team:TU Delft/Project/alkane-degradation/results/LadA
From 2010.igem.org
Characterization of the long-chain alkane monooxygenase (LadA)
Enzyme activity assay based on NADH absorbance
Curves of the NADH absorbance for the blank, negative control and strains of interest displayed no significant differences, thus this method was abandoned. The reason for this could be explained by a lack of cofactors, a substrate diffusion limitation or even substrate inhibition.
Enzyme activity assay based on GC-analysis
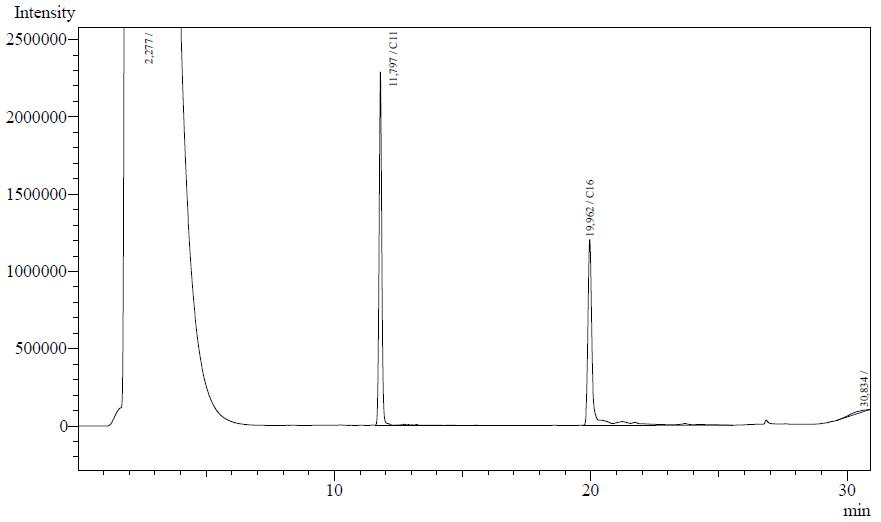
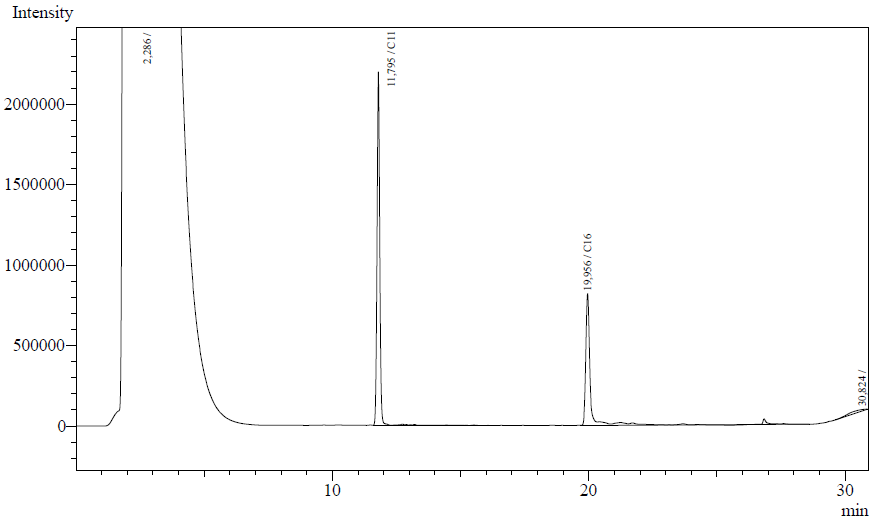
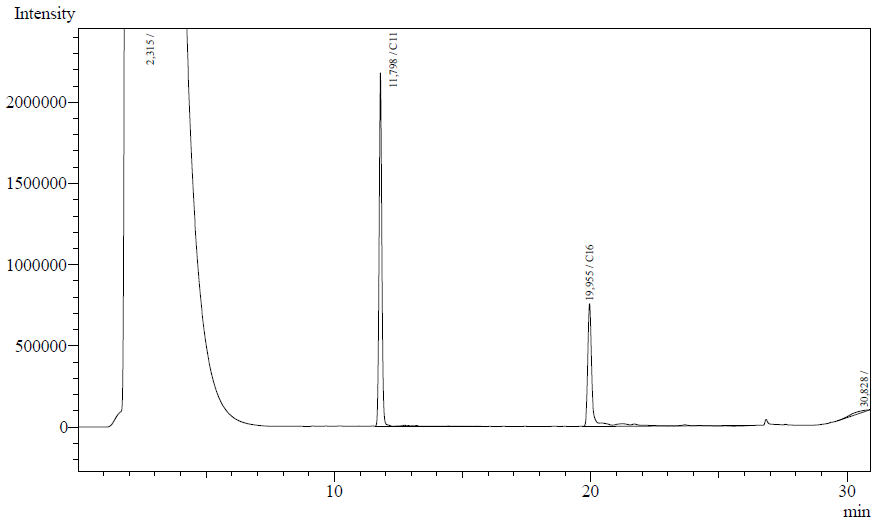
Our enzyme activity protocol for LadA was loosely based an article by Maeng et al,1996. Homogenization of the alkane in the 50mM Tris buffer was achieved by adding Triton-X100, boiling and sonication. After 12 hours the residual alkane was extracted using EtOAc. The following are typical examples of the chromatographs obtained:
The peaks shown in the chromatographs belong to the following compounds:
| Retention time [min] | Compound |
| ~2.2 | Ethyl acetate (solvent) |
| ~11.8 | Undecane (internal standard, 0.1% v/v of solvent) |
| ~20.0 | Hexadecane (substrate) |
The analysis of the GC graphs was analogous to that of the AH system, described above. We made use of the internal standards present in each sample to determine the ratio of the surface areas of hexadecane vs. internal standard. These ratios can be related to the amounts of hexadecane added to eventually estimate the enzymatic activity. The following table displays the average ratios found and the enzyme activity estimates. Strains numbers 1 and 2 are two positive colonies taken from the same plate.
| Strain | Average ratio hexadecane/undecane | Standard deviation [%] | Hexadecane converted [umol] | Protein [mg] | Enzymatic activity [U/mg protein] |
| Blank | 0.900 | 3.19 | 0.00 | 0.00 | 0.00 |
| E.coli K12 negative control ([http://partsregistry.org/Part:BBa_J13002 J13002]) | 0.807 | 3.48 | 1.76 | 4.46 | 5.49E-04 |
| E.coli K12 strain #1 ([http://partsregistry.org/Part:BBa_K398017 K398017]) | 0.600 | 15.4 | 5.68 | 4.58 | 1.72E-03 |
| E.coli K12 strain #2 ([http://partsregistry.org/Part:BBa_K398017 K398017]) | 0.532 | 4.25 | 6.95 | 3.18 | 3.03E-03 |
| E.coli TOP10 strain ([http://partsregistry.org/Part:BBa_K398027 K398027]) | 0.492 | 2.98 | 7.71 | 3.22 | 3.33E-03 |
Conclusions
LadA was characterized succesfully using an enzyme kinetics assay coupled to gas chromatography. We see a significant increase in enzyme activity in the strains carrying the ladA protein generator BioBrick compared to the negative control strain. The highest enzyme activity value was found to be 3.33E-03 U/mg protein compared to 0.55E-03 of the negative control strain. Further studies into the enzymatic activity needed to sustain growth could be performed in future. This will give us information on the implementation of this BioBrick into our complete alkane degradation chassis.
 "
"


