Team:Imperial College London/Modelling/Protein Display/Results and Conclusion
From 2010.igem.org
(Difference between revisions)
m |
|||
| (3 intermediate revisions not shown) | |||
| Line 1: | Line 1: | ||
{{:Team:Imperial_College_London/Templates/Header}} | {{:Team:Imperial_College_London/Templates/Header}} | ||
| - | {{:Team:Imperial_College_London/Templates/ | + | {{:Team:Imperial_College_London/Templates/ModellingHeaderD}} |
{{:Team:Imperial_College_London/Templates/ModellingDetectionHeader}} | {{:Team:Imperial_College_London/Templates/ModellingDetectionHeader}} | ||
{|style="width:900px;background:#f5f5f5;text-align:justify;font-family: helvetica, arial, sans-serif;color:#555555;margin-top:5px;" cellspacing="20" | {|style="width:900px;background:#f5f5f5;text-align:justify;font-family: helvetica, arial, sans-serif;color:#555555;margin-top:5px;" cellspacing="20" | ||
|style="font-family: helvetica, arial, sans-serif;font-size:2em;color:#ea8828;"|Results and Conclusion | |style="font-family: helvetica, arial, sans-serif;font-size:2em;color:#ea8828;"|Results and Conclusion | ||
|- | |- | ||
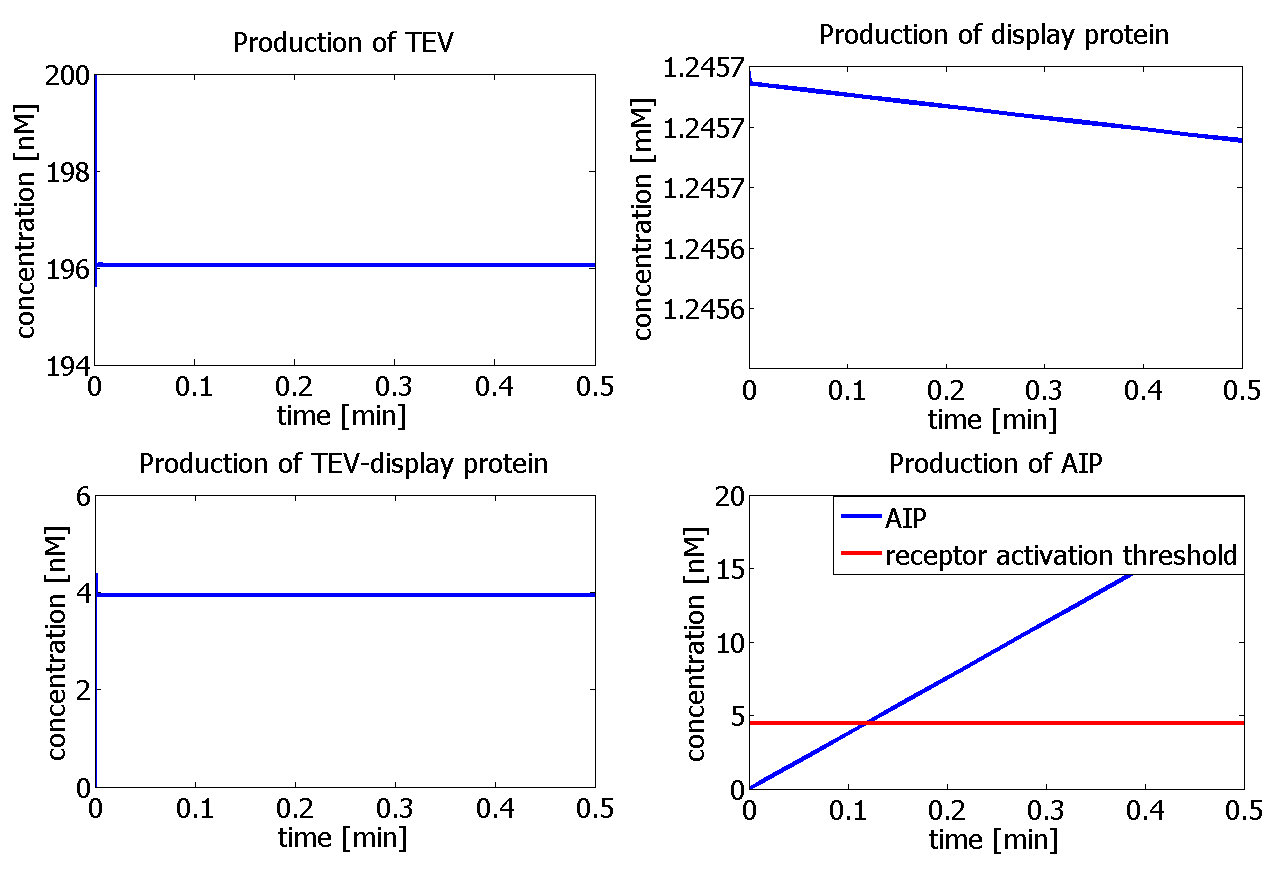
| - | |The graph below | + | |The graph below represents the standard output of our model. It shows how the concentration of each of the species varies with time. |
<div ALIGN=CENTER> | <div ALIGN=CENTER> | ||
| - | {| style="background:#e7e7e7;text-align:center;font-family: helvetica, arial, sans-serif;color:#555555;margin- top:5px;padding: 2px;" cellspacing="5"; | + | {| style="width:604px;background:#e7e7e7;text-align:center;font-family: helvetica, arial, sans-serif;color:#555555;margin- top:5px;padding: 2px;" cellspacing="5"; |
|- | |- | ||
|[[Image:IC_Protein_display.png|600px]] | |[[Image:IC_Protein_display.png|600px]] | ||
|- | |- | ||
| - | |<html>Graphs showing the simulation | + | |<html>Graphs showing the simulation of the enzymatic reaction for each of the species, with initial concentration of the enzyme - [TEV]<sub>0</sub> = 400 nM. The graph on the bottom right hand-side shows that the receptor activation threshold (red line) is reached by AIP after 11 s!</html> |
|} | |} | ||
</div> | </div> | ||
| Line 37: | Line 37: | ||
<br/> | <br/> | ||
<b>Risk of False positives</b><br/> | <b>Risk of False positives</b><br/> | ||
| - | It was pointed out that we should assess the risk of false positive activation of the receptor, but only areas of research were determined. We are particularly concerned about the display protein not binding to the cell wall, but instead diffusing into the extra-cellular environment and maybe attaching to receptor. | + | It was pointed out that we should assess the risk of false positive activation of the receptor, but only areas of research were determined. We are particularly concerned about the display protein not binding to the cell wall, but instead diffusing into the extra-cellular environment and maybe attaching to the receptor. |
| - | In order to be able to assess the risk of false positives, we need to do further research into the affinity of AIP with attached linker and trans-membrane proteins for the receptor as compared to the affinity of the AIP itself for the receptor. | + | In order to be able to assess the risk of false positives, we need to do further research into the affinity of AIP with the attached linker and trans-membrane proteins for the receptor as compared to the affinity of the AIP itself for the receptor. |
<br /> | <br /> | ||
This paper <a href="http://jb.asm.org/cgi/content/full/186/10/3078">[1]</a> might have some information on affinity comparison. | This paper <a href="http://jb.asm.org/cgi/content/full/186/10/3078">[1]</a> might have some information on affinity comparison. | ||
Latest revision as of 03:21, 28 October 2010
| Modelling | Overview | Detection Model | Signaling Model | Fast Response Model | Interactions |
| A major part of the project consisted of modelling each module. This enabled us to decide which ideas we should implement. Look at the Fast Response page for a great example of how modelling has made a major impact on our design! | |
| Objectives | Description | Results | Constants | MATLAB Code |
| Results and Conclusion |
| The graph below represents the standard output of our model. It shows how the concentration of each of the species varies with time.
Risk of False positives It was pointed out that we should assess the risk of false positive activation of the receptor, but only areas of research were determined. We are particularly concerned about the display protein not binding to the cell wall, but instead diffusing into the extra-cellular environment and maybe attaching to the receptor. In order to be able to assess the risk of false positives, we need to do further research into the affinity of AIP with the attached linker and trans-membrane proteins for the receptor as compared to the affinity of the AIP itself for the receptor. This paper [1] might have some information on affinity comparison. We need to know how proteins are being transported from intracellular to trans-membrane space. Understanding of this concept could give us an idea of what could go wrong and on what modelling would need to focus on. |
| Click here for the constants of this model... |
| References |
|
 "
"


