Team:Newcastle/Filamentous Cells
From 2010.igem.org
Shethharsh08 (Talk | contribs) |
RachelBoyd (Talk | contribs) (→Graphs) |
||
| (9 intermediate revisions not shown) | |||
| Line 58: | Line 58: | ||
The part was co-transcribed with ''gfp'' fluorescent marker by transcriptional fusion after the ''yneA'' coding sequence. | The part was co-transcribed with ''gfp'' fluorescent marker by transcriptional fusion after the ''yneA'' coding sequence. | ||
| - | We characterised the part first without, and then with, LacI repression (using the integration vector pMutin4 to integrate ''lacI'' into the ''Bacillus subtilis'' 168 chromosome). | + | We characterised the part first without, and then with, LacI repression (using the integration vector pMutin4 to integrate ''lacI'' into the ''Bacillus subtilis'' 168 chromosome). When testing the part under LacI repression cells were induced with IPTG for two hours. |
| + | |||
| + | |||
{| | {| | ||
| Line 75: | Line 77: | ||
===Graphs=== | ===Graphs=== | ||
| + | |||
| + | ====Table 1:==== | ||
| + | {| border="1" | ||
| + | |- | ||
| + | !Stats: | ||
| + | !168 | ||
| + | !''yneA'' | ||
| + | !pMutin4 0μM IPTG | ||
| + | !pMutin4 1μM IPTG | ||
| + | |- | ||
| + | |Average: | ||
| + | |1.34μm | ||
| + | |3.53μm | ||
| + | |1.74μm | ||
| + | |3.19μm | ||
| + | |- | ||
| + | |Max: | ||
| + | |2.30μm | ||
| + | |6.00μm | ||
| + | |3.62μm | ||
| + | |9.77μm | ||
| + | |||
| + | |- | ||
| + | |Min: | ||
| + | |0.55μm | ||
| + | |1.31μm | ||
| + | |0.88μm | ||
| + | |1.14μm | ||
| + | |- | ||
| + | |Median: | ||
| + | |1.33μm | ||
| + | |3.27μm | ||
| + | |1.62μm | ||
| + | |2.66μm | ||
| + | |- | ||
| + | |Standard Deviation: | ||
| + | |0.32μm | ||
| + | |1.01μm | ||
| + | |0.80μm | ||
| + | |1.56μm | ||
| + | |} | ||
| + | |||
| + | |||
| + | ====Figure 1:==== | ||
{| | {| | ||
| - | |||
|- | |- | ||
| - | | | + | |Distribution of cell lengths is not normal, so the mean is misleading; we are reporting the median instead. |
|- | |- | ||
| - | | | + | |[[Image:Teamnewcastle_yneA168.png|600px]] |
|- | |- | ||
| - | |''' | + | |Figure1: shows statistics for populations of cells |
| + | *overexpression of the ''yneA'' construct (Δ''amyE'':pSpac(hy)-oid::''yneA''(cells with YneA construct but no inhibitory regulation) ) leads to a longer cell length compared with our control ''Bacillus subtilis 168''. | ||
| + | *pMT4_0.0: YneA construct in pMutin4 vector with inhibition and no IPTG (ΔamyE:Pspac(hy)-oid::yneA::pMutin4) | ||
| + | *pMT4_1.0: YneA construct in pMutin4 vector with inhibition and 1.0 μM IPTG (ΔamyE:Pspac(hy)-oid::yneA::pMutin4) | ||
| + | |- | ||
| + | |with inhibition cell lengths are comparable to ''Bacillus subtilis 168'' at 0μM IPTG and longer with IPTG induction. | ||
| + | |} | ||
| + | |||
| + | |||
| + | ====Figure 2:==== | ||
| + | {| | ||
|- | |- | ||
|[[Image:Teamnewcastle_yneA168BS.jpg|300px]][[Image:Teamnewcastle_yneA1.jpg|300px]][[Image:Teamnewcastle_yneA.jpg|300px]] | |[[Image:Teamnewcastle_yneA168BS.jpg|300px]][[Image:Teamnewcastle_yneA1.jpg|300px]][[Image:Teamnewcastle_yneA.jpg|300px]] | ||
|- | |- | ||
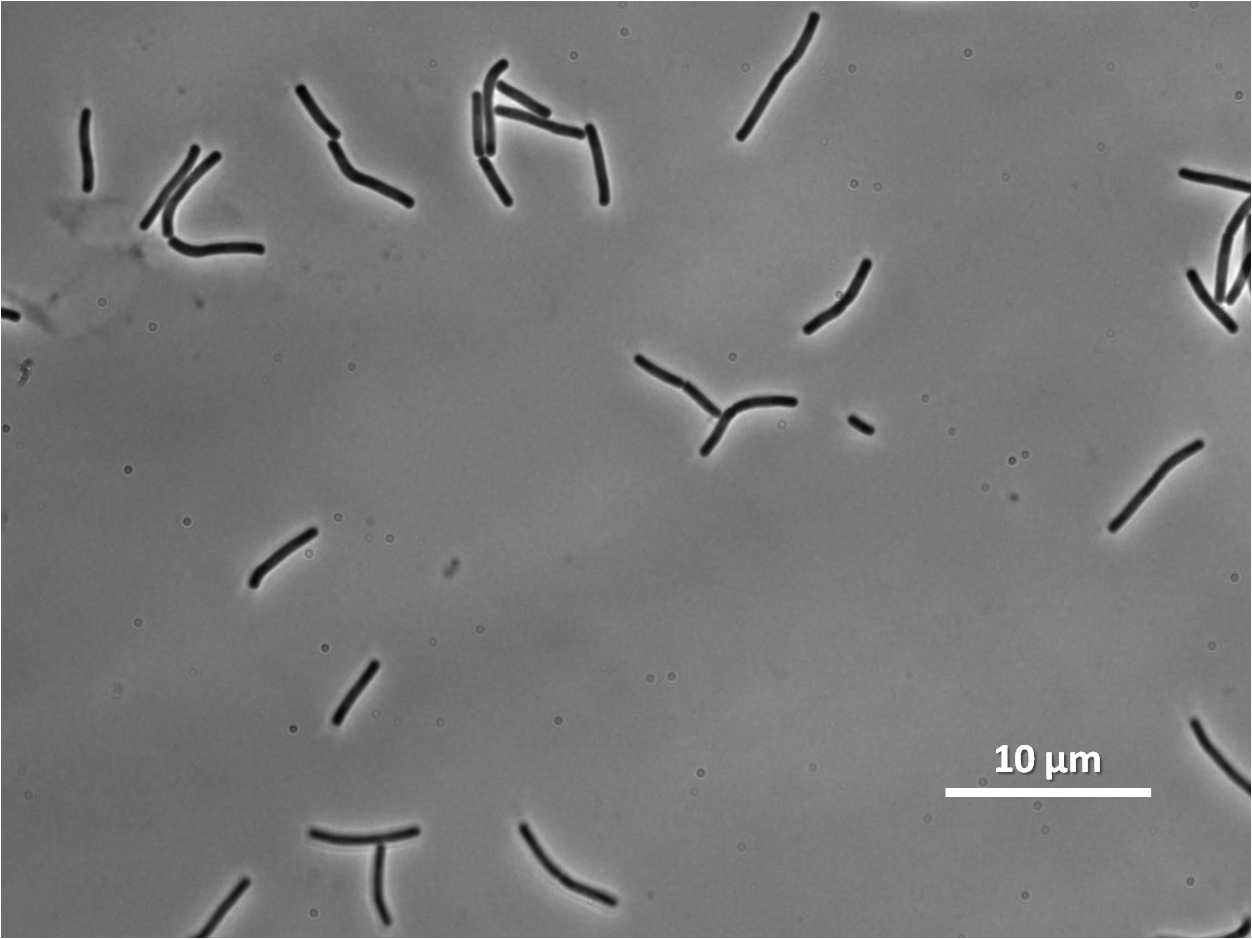
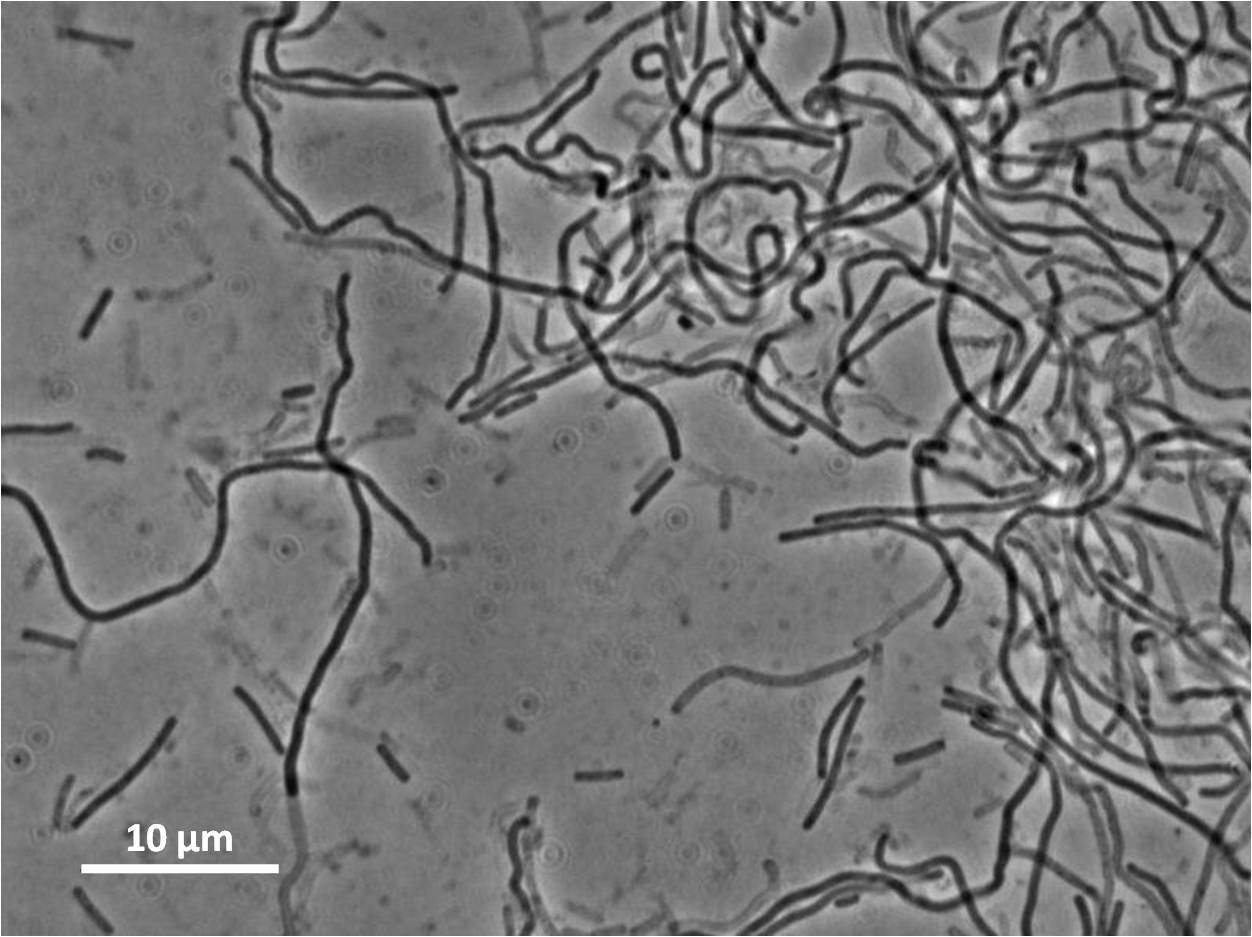
| - | |''' | + | |'''Figure2''': ''Bacillus subtilis 168'' cells (left),''Bacillus subtilis'' expressing ''yneA''(centre) and ''Bacillus subtilis'' overexpressing ''yneA''(right) |
| + | |- | ||
| + | |The images we have taken this data from had very different numbers of cells, so the cells counts are misleading therefore we are reporting the proportions of cells at a given length. | ||
| + | |} | ||
| + | |||
| + | |||
| + | ====Figure 3:==== | ||
| + | {| | ||
|- | |- | ||
|[[Image:newcastle_no induction.jpg|600px]] | |[[Image:newcastle_no induction.jpg|600px]] | ||
|- | |- | ||
| - | | | + | |Figure 3 shows the percentage of cells at different lengths (μm) uninduced |
| + | |} | ||
| + | |||
| + | |||
| + | ====Figure 4:==== | ||
| + | {| | ||
|- | |- | ||
| - | | | + | |Figure 4:''Bacillus subtilis'' 168 cells (left) and non-induced cells (right) |
|- | |- | ||
|[[Image:Teamnewcastle_yneA168BS.jpg|300px]][[Image:Teamnewcastle_noindBS.jpg|300px]] | |[[Image:Teamnewcastle_yneA168BS.jpg|300px]][[Image:Teamnewcastle_noindBS.jpg|300px]] | ||
|- | |- | ||
| - | | | + | |} |
| + | |||
| + | |||
| + | ====Figure 5:==== | ||
| + | {| | ||
|- | |- | ||
|[[Image:newcastle_0.2 induction.jpg|600px]] | |[[Image:newcastle_0.2 induction.jpg|600px]] | ||
|- | |- | ||
| - | | | + | |Figure 5: shows the percentage of cells at different lengths(μm)induced at 0.2mM IPTG |
| - | | | + | |} |
| - | | | + | |
| + | ====Figure 6:==== | ||
| + | {| | ||
|- | |- | ||
|[[Image:Teamnewcastle_yneA168BS.jpg|300px]][[Image:Teamnewcastle_0.2indBS.jpg|300px]] | |[[Image:Teamnewcastle_yneA168BS.jpg|300px]][[Image:Teamnewcastle_0.2indBS.jpg|300px]] | ||
|- | |- | ||
| - | |'' | + | |Figure 6: ''Bacillus subtilis 168'' cells (left) and cells induced at 0.2mM IPTG (right) |
| + | |} | ||
| + | |||
| + | |||
| + | ====Figure 7:==== | ||
| + | {| | ||
|- | |- | ||
|[[Image:newcastle_1IPTG.jpg|600px]] | |[[Image:newcastle_1IPTG.jpg|600px]] | ||
|- | |- | ||
| - | | | + | |Figure 7: shows the percentage of cells at different lengths (μm) induced at 1mM IPTG |
| - | | | + | |} |
| - | | | + | |
| + | |||
| + | ====Figure 8:==== | ||
| + | {| | ||
|- | |- | ||
|[[Image:Teamnewcastle_yneA168BS.jpg|300px]][[Image:Teamnewcastle_1indBS2.jpg|300px]] | |[[Image:Teamnewcastle_yneA168BS.jpg|300px]][[Image:Teamnewcastle_1indBS2.jpg|300px]] | ||
| + | |- | ||
| + | |Figure 8: ''Bacillus subtilis'' 168 cells (left) and cells induced at 1mM IPTG(right) | ||
|} | |} | ||
| - | |||
| - | |||
==Research== | ==Research== | ||
Latest revision as of 01:53, 28 October 2010

| |||||||||||||
| |||||||||||||
Contents |
Filamentous cell formation by overexpression of yneA
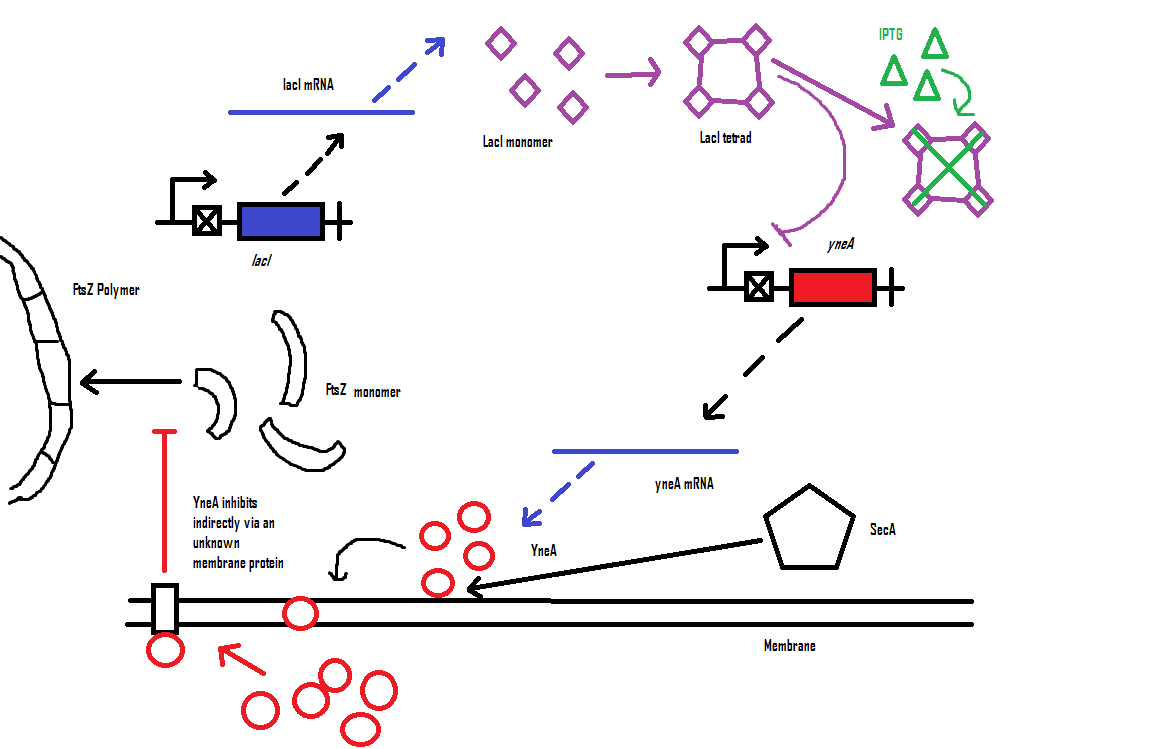
Bacillus subtilis cell division is dependent on FtsZ. FtsZ forms a 30 subunit ring at the midpoint of the cell and contracts.
YneA indirectly stops the formation of the FtsZ ring. In nature, yneA is expressed during SOS response, allowing the cell to repair DNA damage before continuing with the division cycle.
It is hypothesized that YneA acts through unknown transmembrane proteins to inhibit FtsZ ring formation; we call these unknown components "Blackbox proteins".
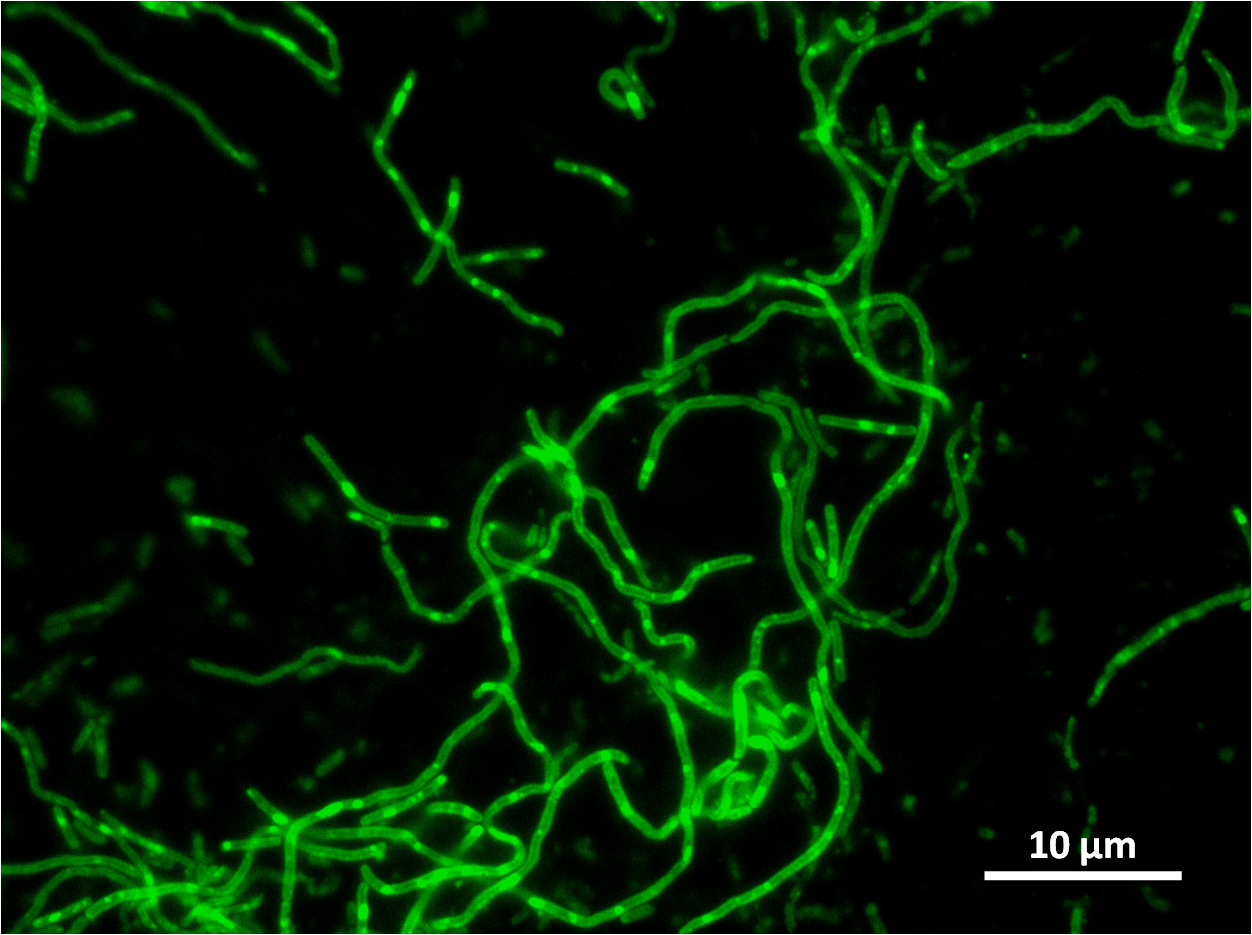
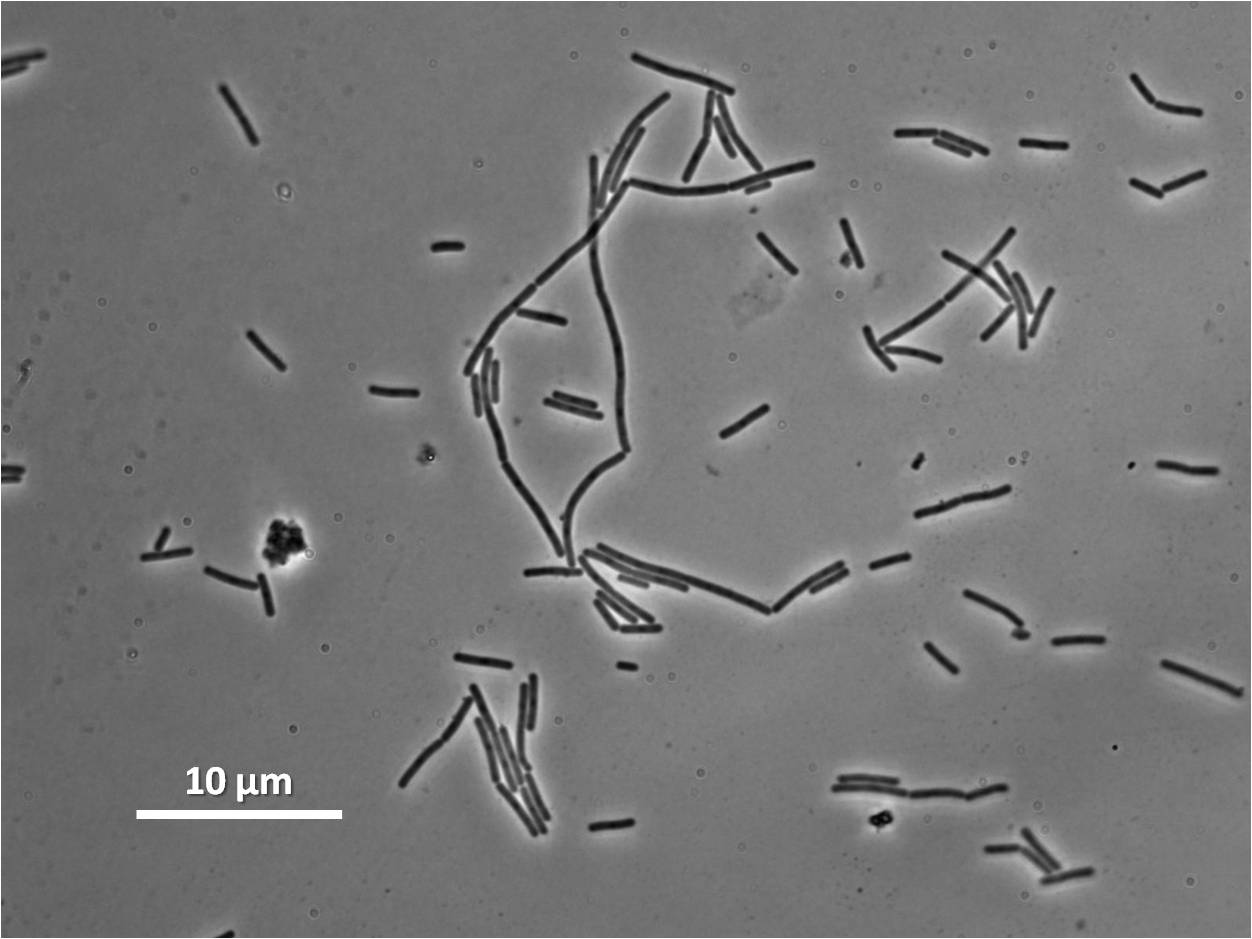
By expressing YneA and therefore inhibiting FtsZ ring formation, cells will grow filamentous.
Part
Our IPTG-inducible filamentous cell formation part puts yneA under the control of the [http://partsregistry.org/wiki/index.php?title=Part:BBa_K302003 strongly LacI-repressible promoter that we designed, hyperspankoid]. In the presence of LacI, induction with IPTG will result in a filamentous cell phenotype.
The part has no terminator, allowing for transcriptional fusion with gfp and visualisation under the microscope.
This is part [http://partsregistry.org/Part:BBa_K302012 BBa_K302012] on the [http://partsregistry.org parts registry].
Computational model
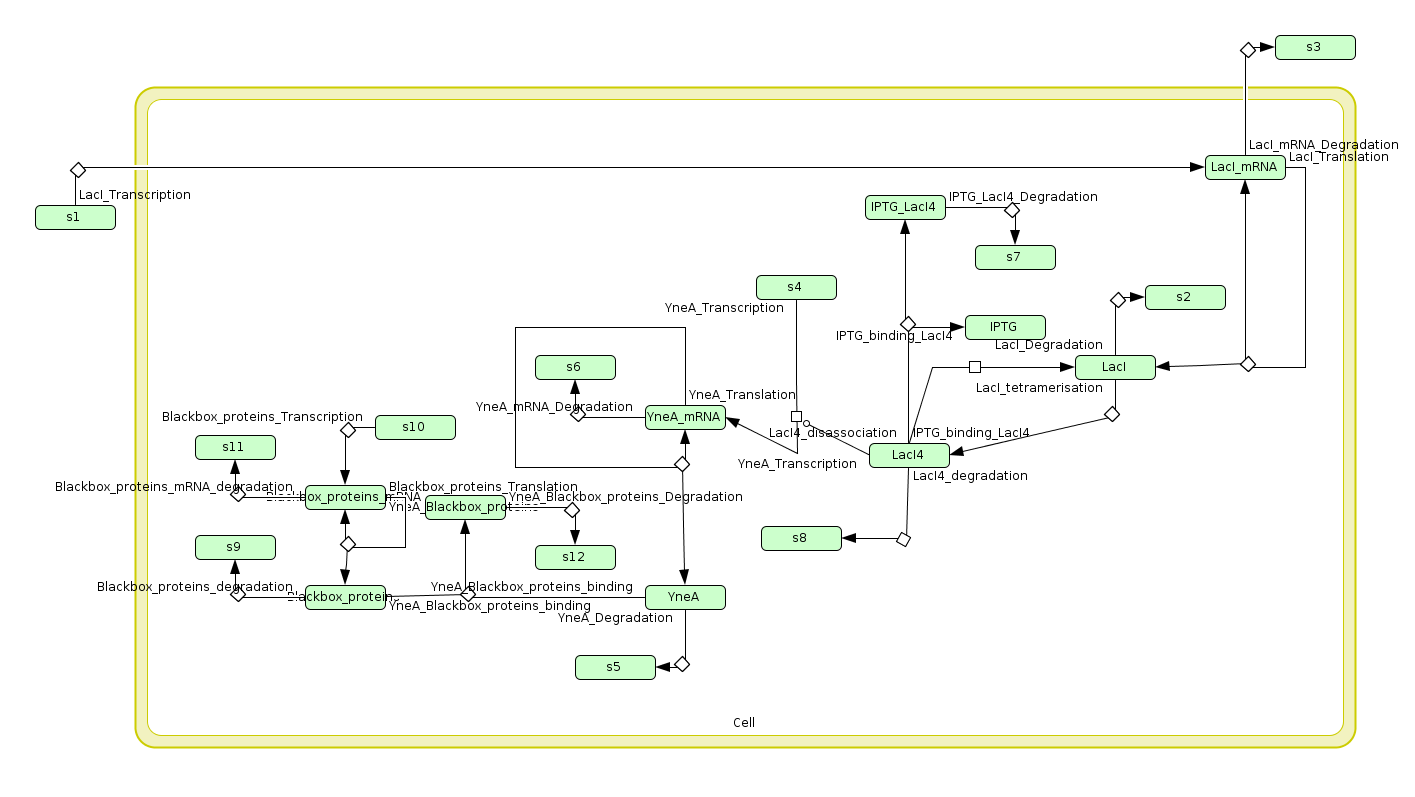
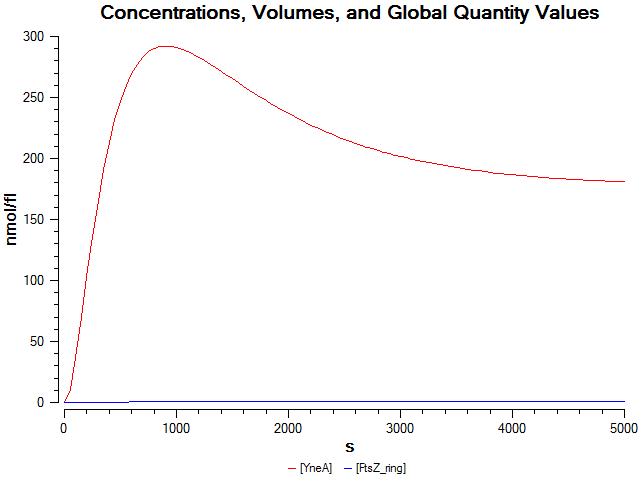
| Visualisation of the model's biochemical network in CellDesigner. |
Downloads:
Cloning strategy
Characterisation
We integrated our part into the Bacillus subtilis 168 chromosome at amyE (using the integration vector pGFP-rrnB) and selected for integration by testing for the ability to hydrolyse starch. Homologous recombination at amyE destroys endogenous expression of amylase. Colonies that are not able to break down starch on agar plate do not have a white halo when exposed to iodine.
The part was co-transcribed with gfp fluorescent marker by transcriptional fusion after the yneA coding sequence.
We characterised the part first without, and then with, LacI repression (using the integration vector pMutin4 to integrate lacI into the Bacillus subtilis 168 chromosome). When testing the part under LacI repression cells were induced with IPTG for two hours.
Graphs
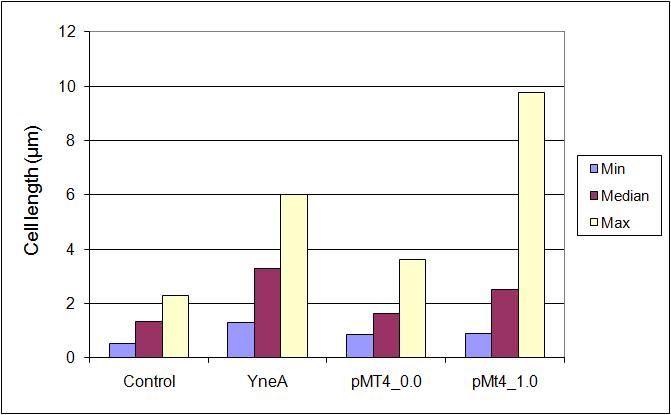
Table 1:
| Stats: | 168 | yneA | pMutin4 0μM IPTG | pMutin4 1μM IPTG |
|---|---|---|---|---|
| Average: | 1.34μm | 3.53μm | 1.74μm | 3.19μm |
| Max: | 2.30μm | 6.00μm | 3.62μm | 9.77μm |
| Min: | 0.55μm | 1.31μm | 0.88μm | 1.14μm |
| Median: | 1.33μm | 3.27μm | 1.62μm | 2.66μm |
| Standard Deviation: | 0.32μm | 1.01μm | 0.80μm | 1.56μm |
Figure 1:
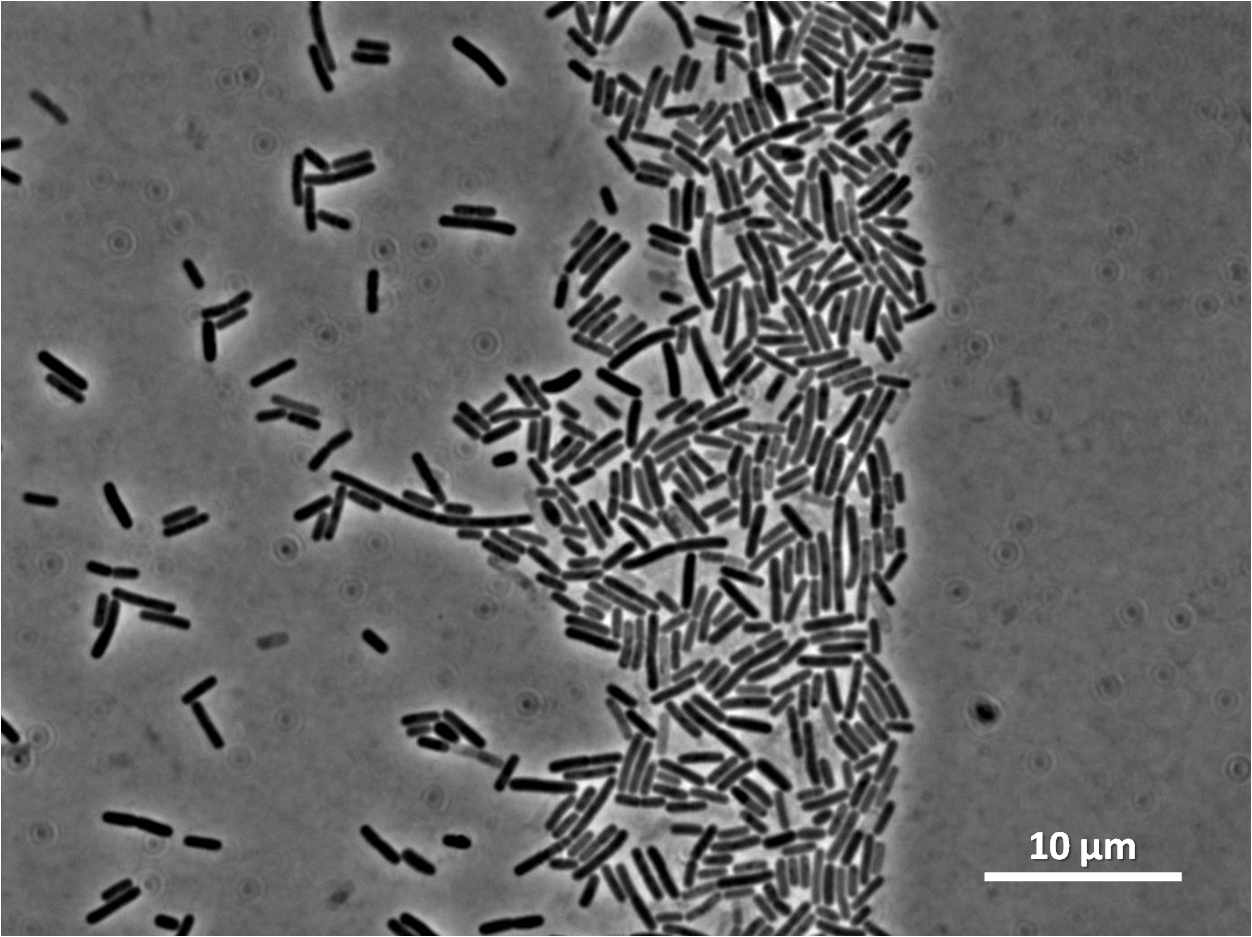
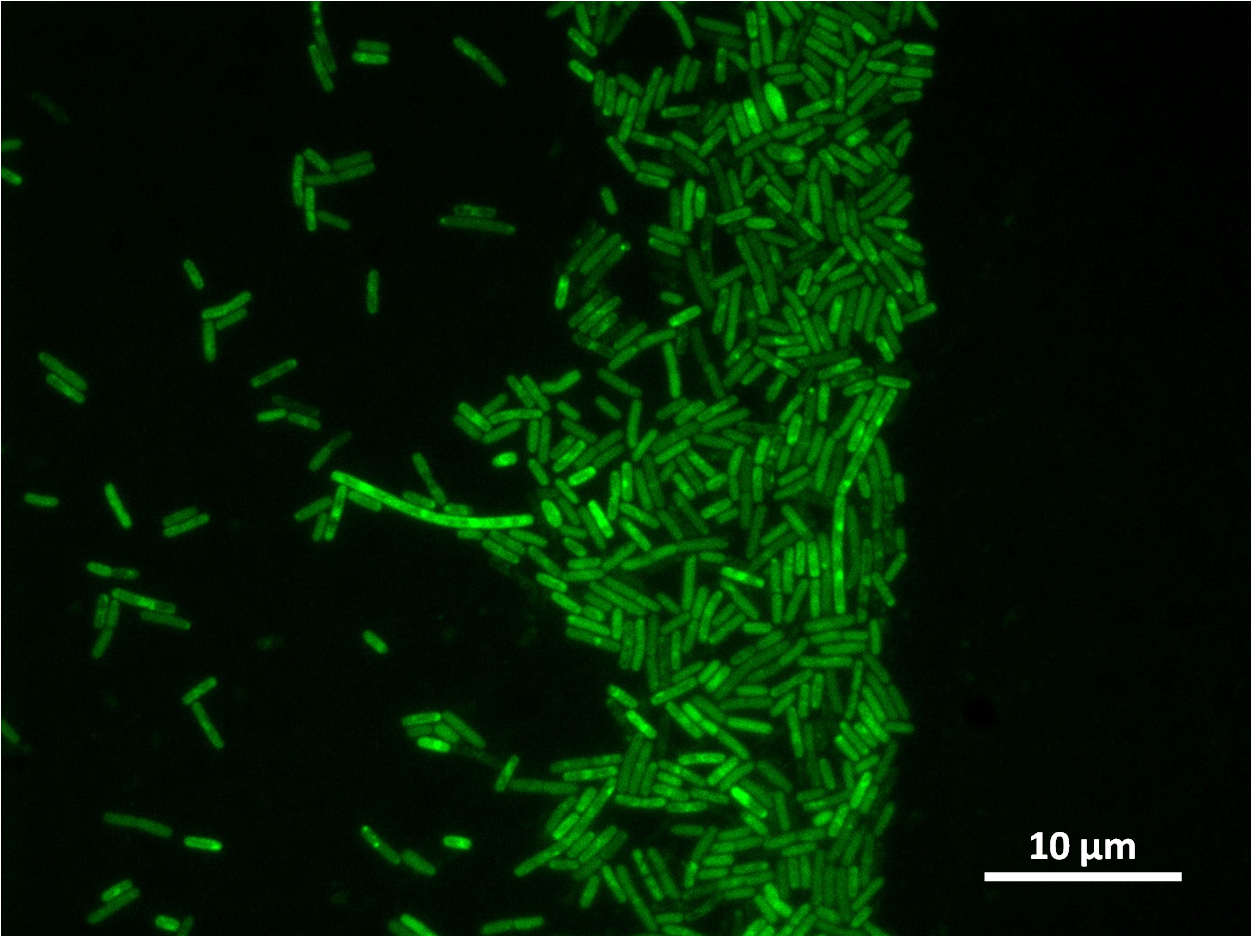
Figure 2:
Figure 3:
|
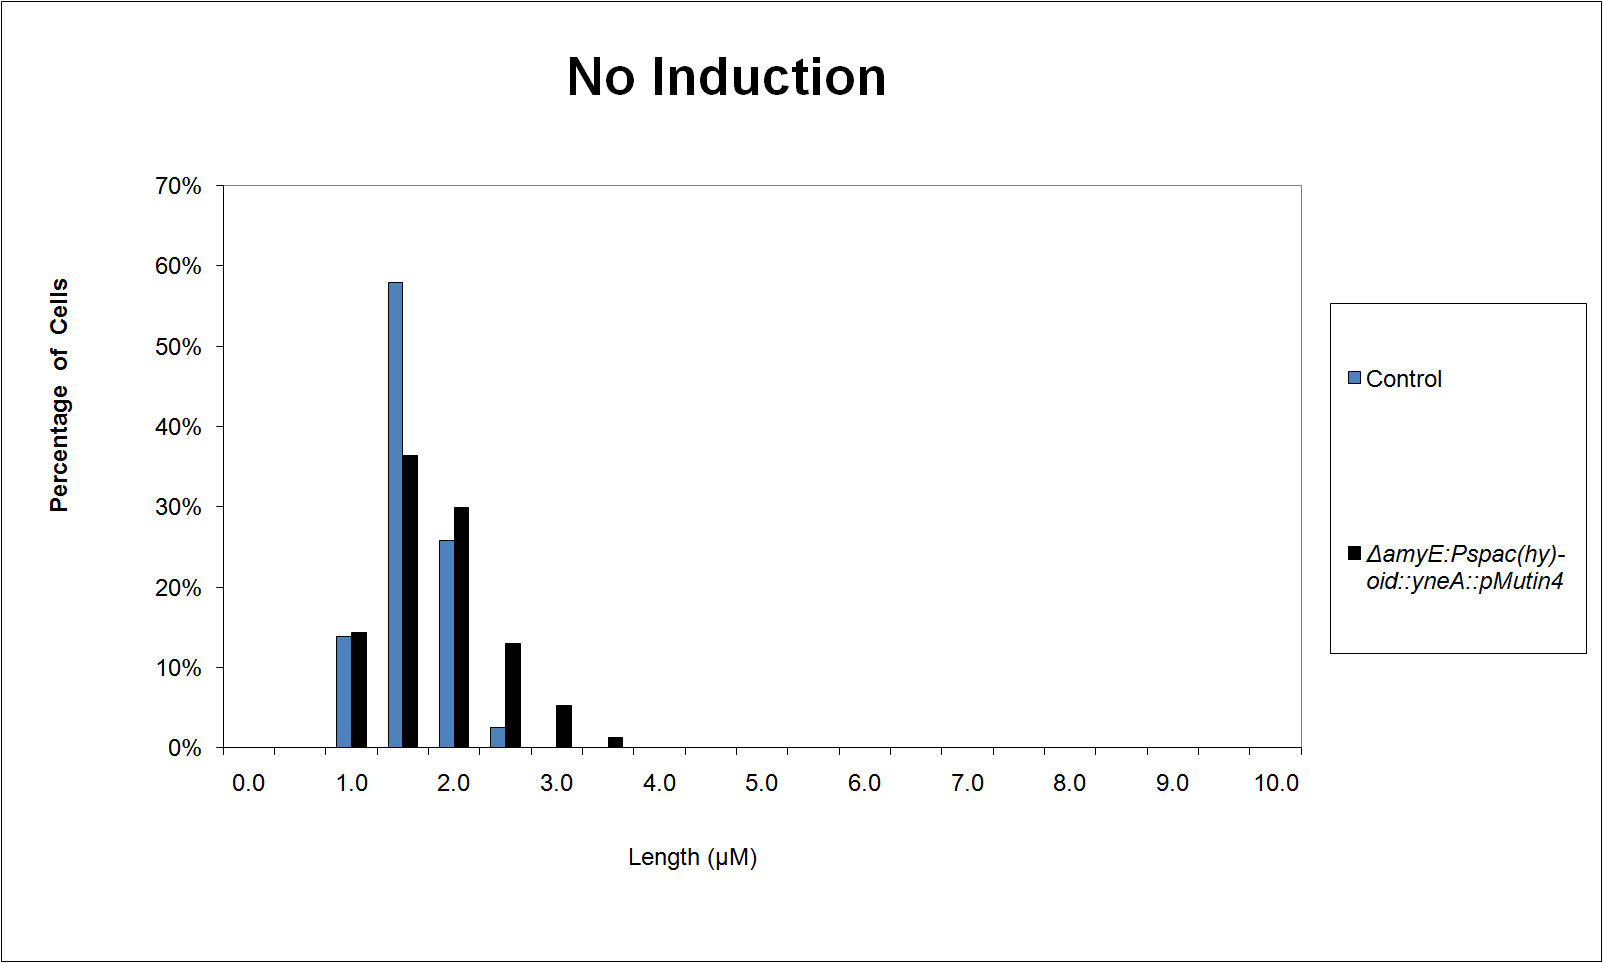
| Figure 3 shows the percentage of cells at different lengths (μm) uninduced |
Figure 4:
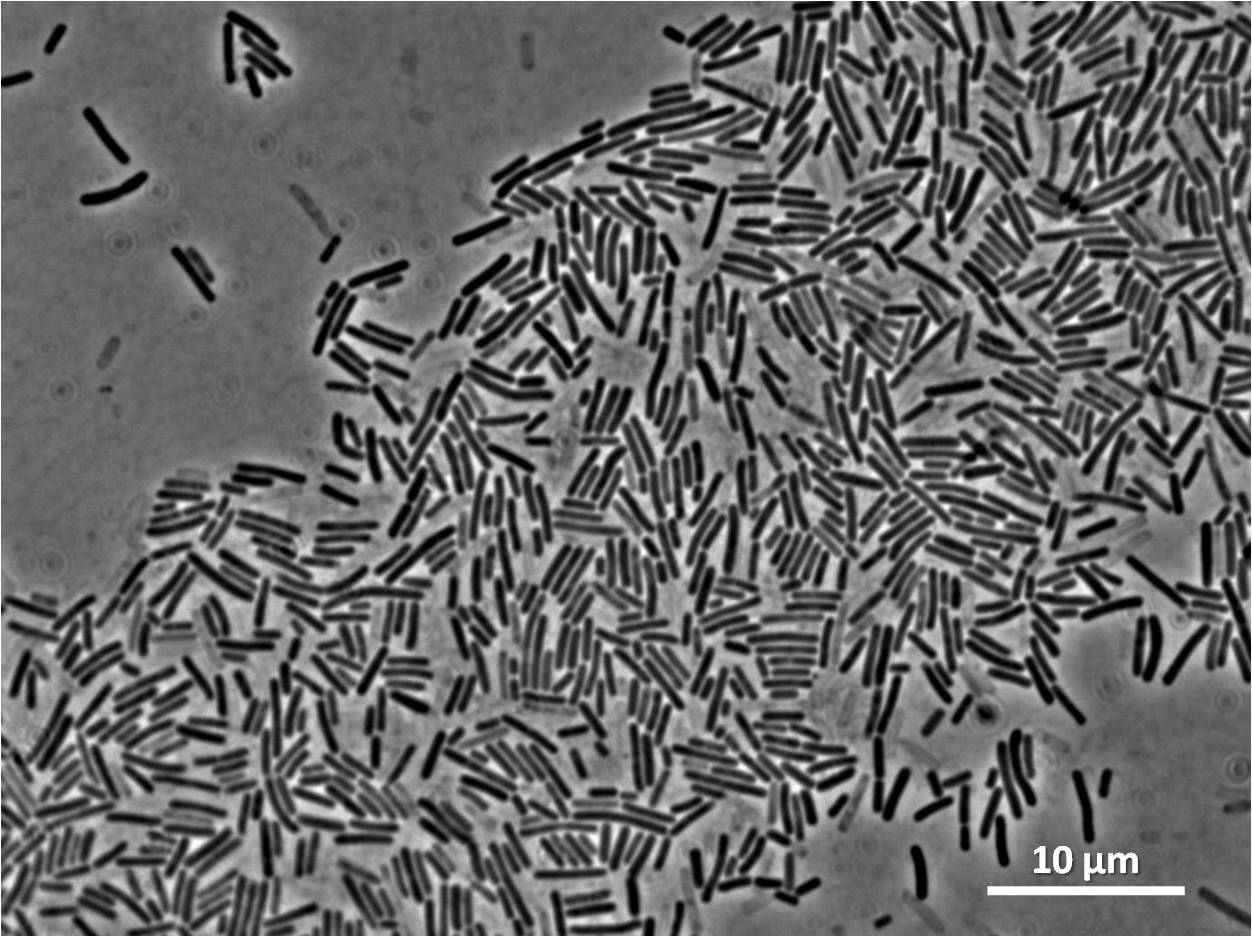
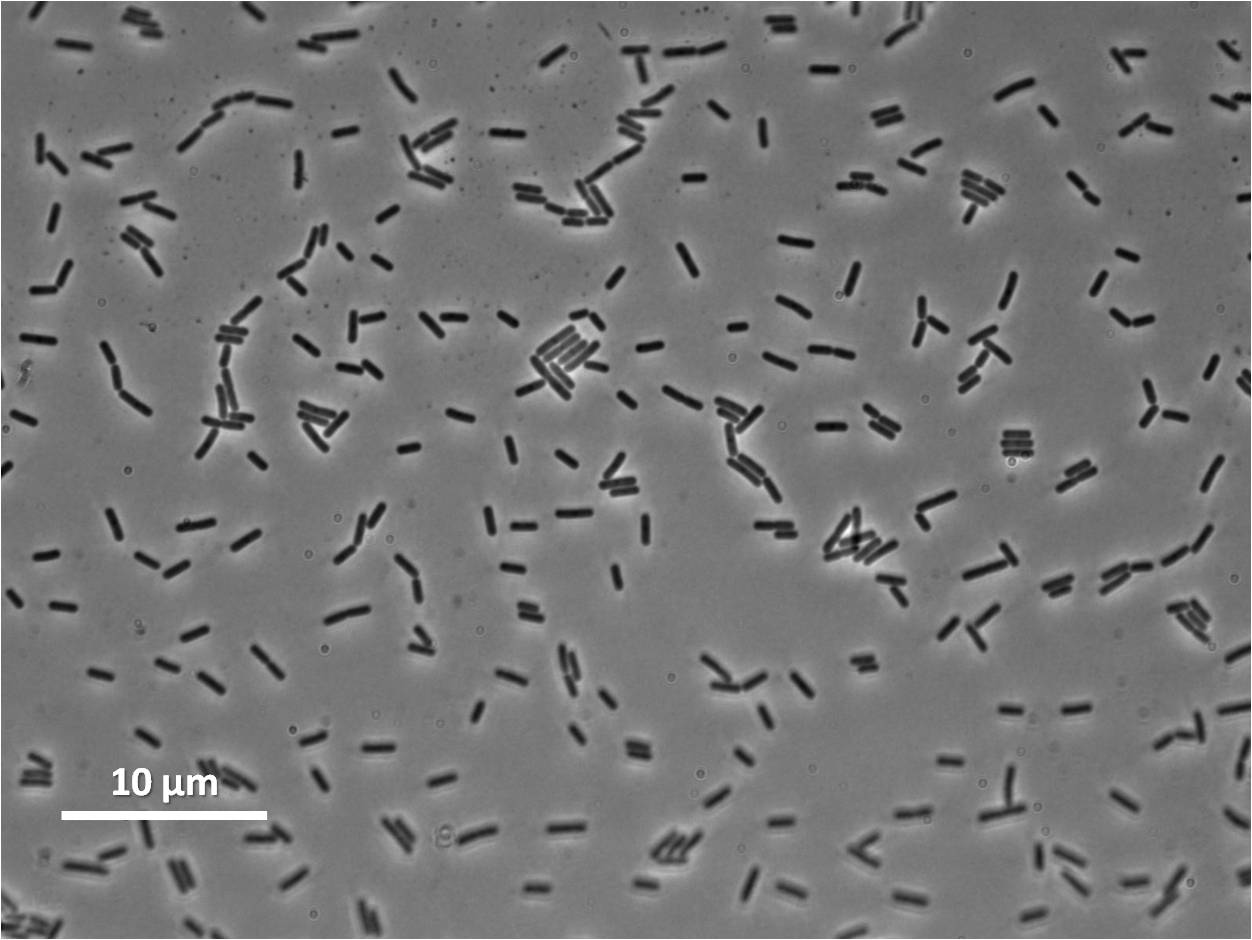
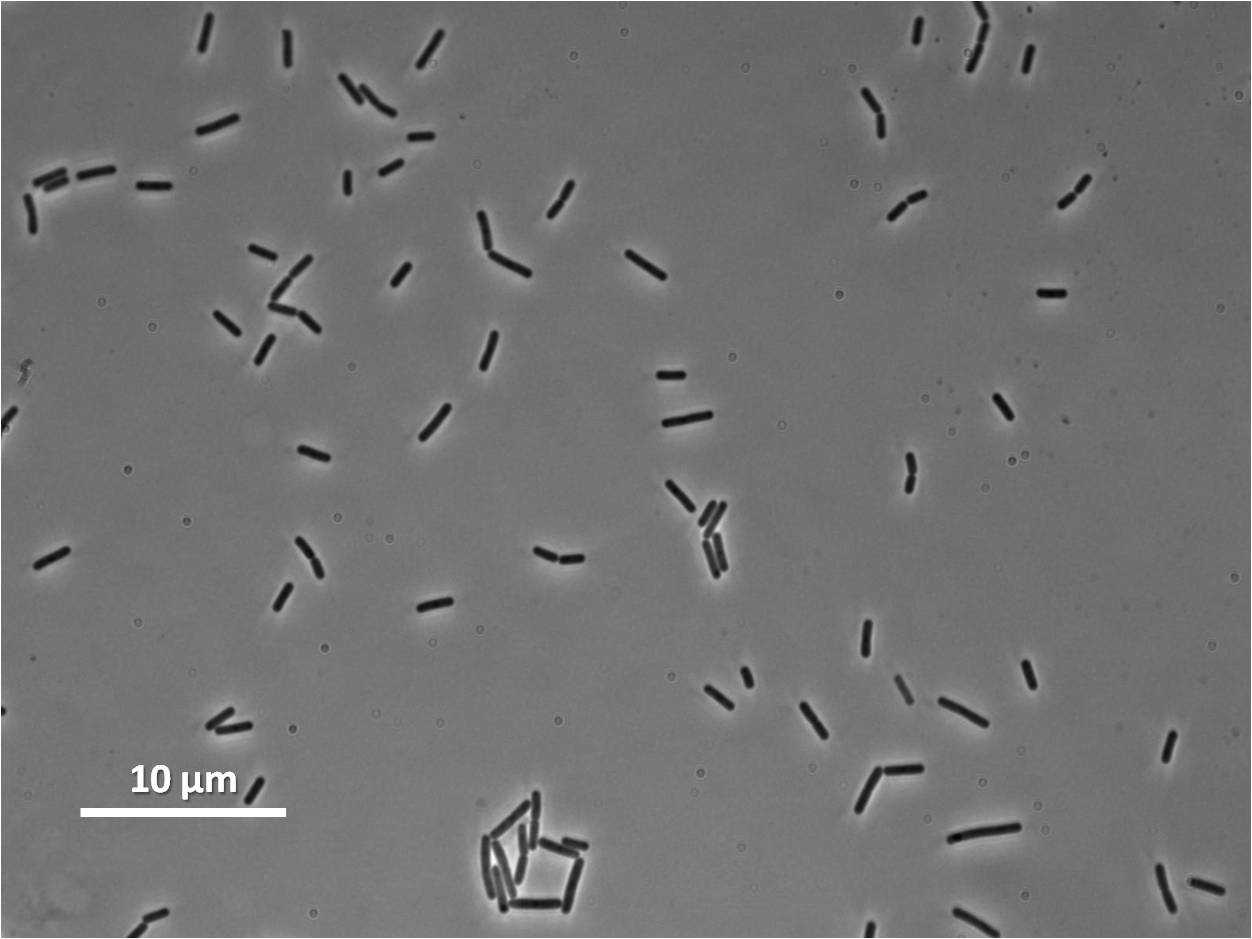
| Figure 4:Bacillus subtilis 168 cells (left) and non-induced cells (right) |
|
Figure 5:
|
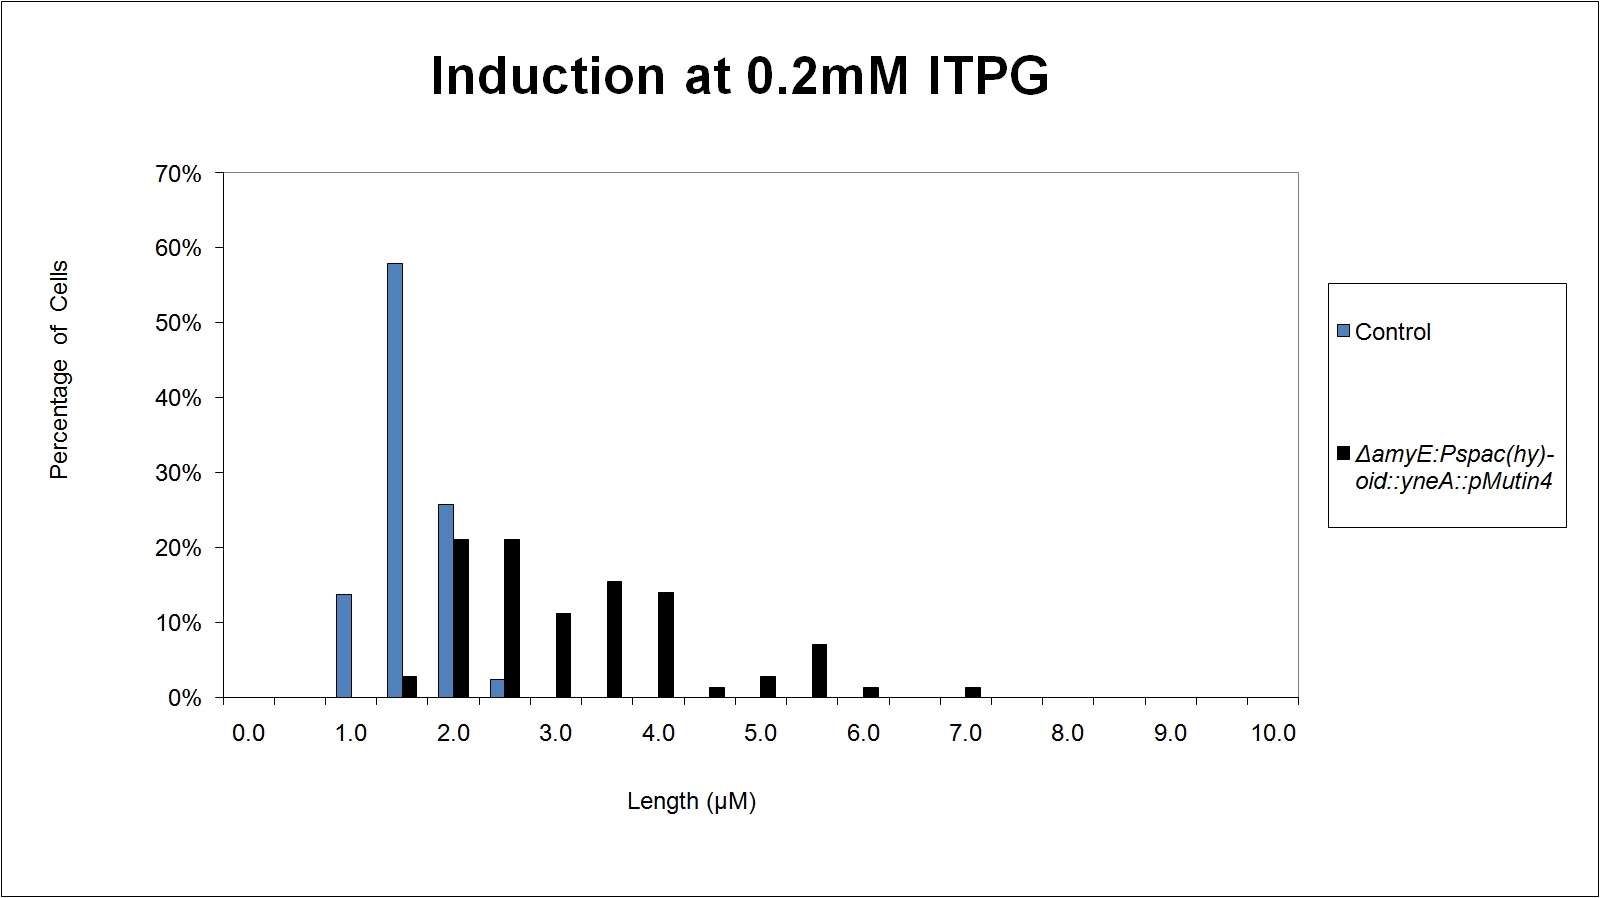
| Figure 5: shows the percentage of cells at different lengths(μm)induced at 0.2mM IPTG |
Figure 6:
|
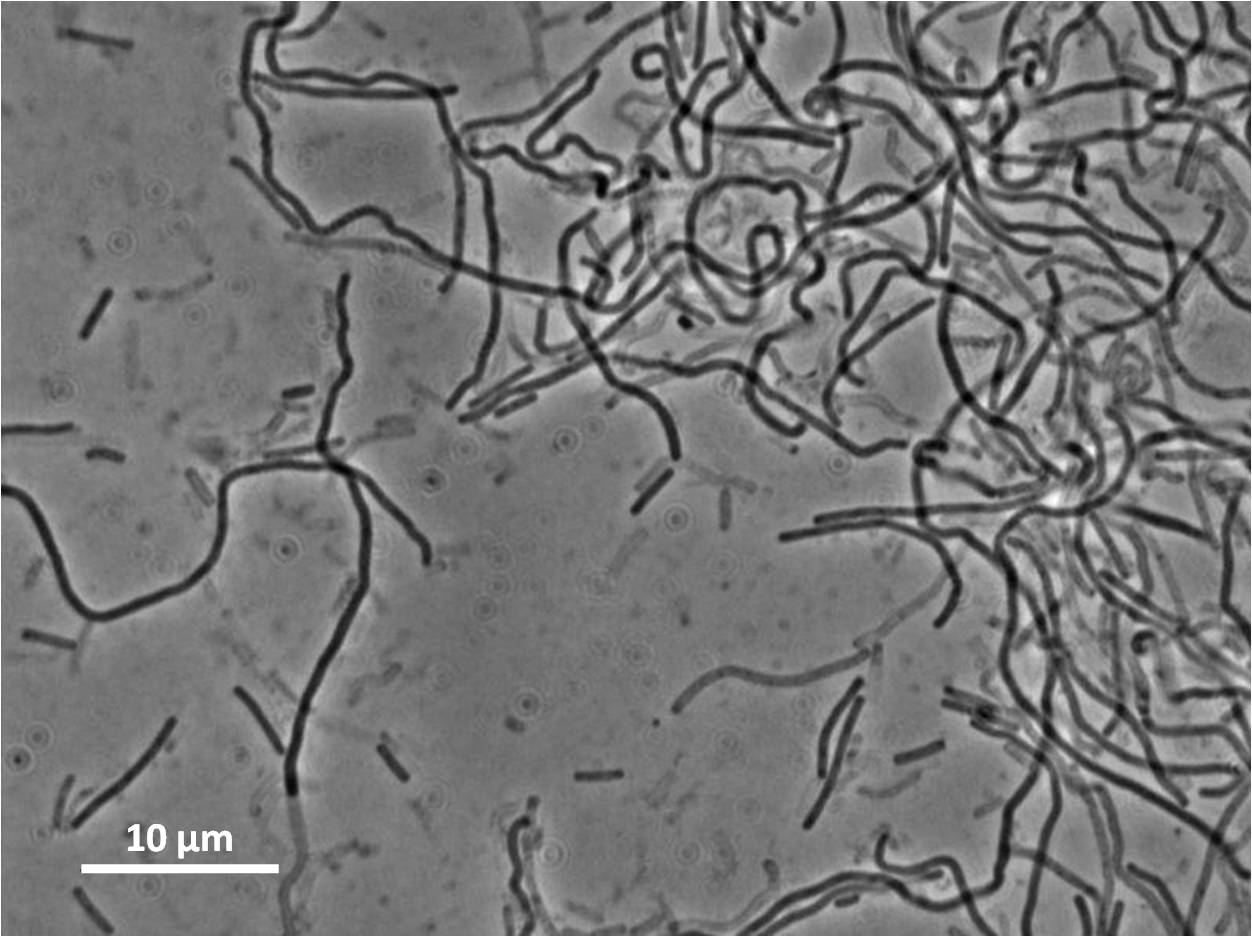
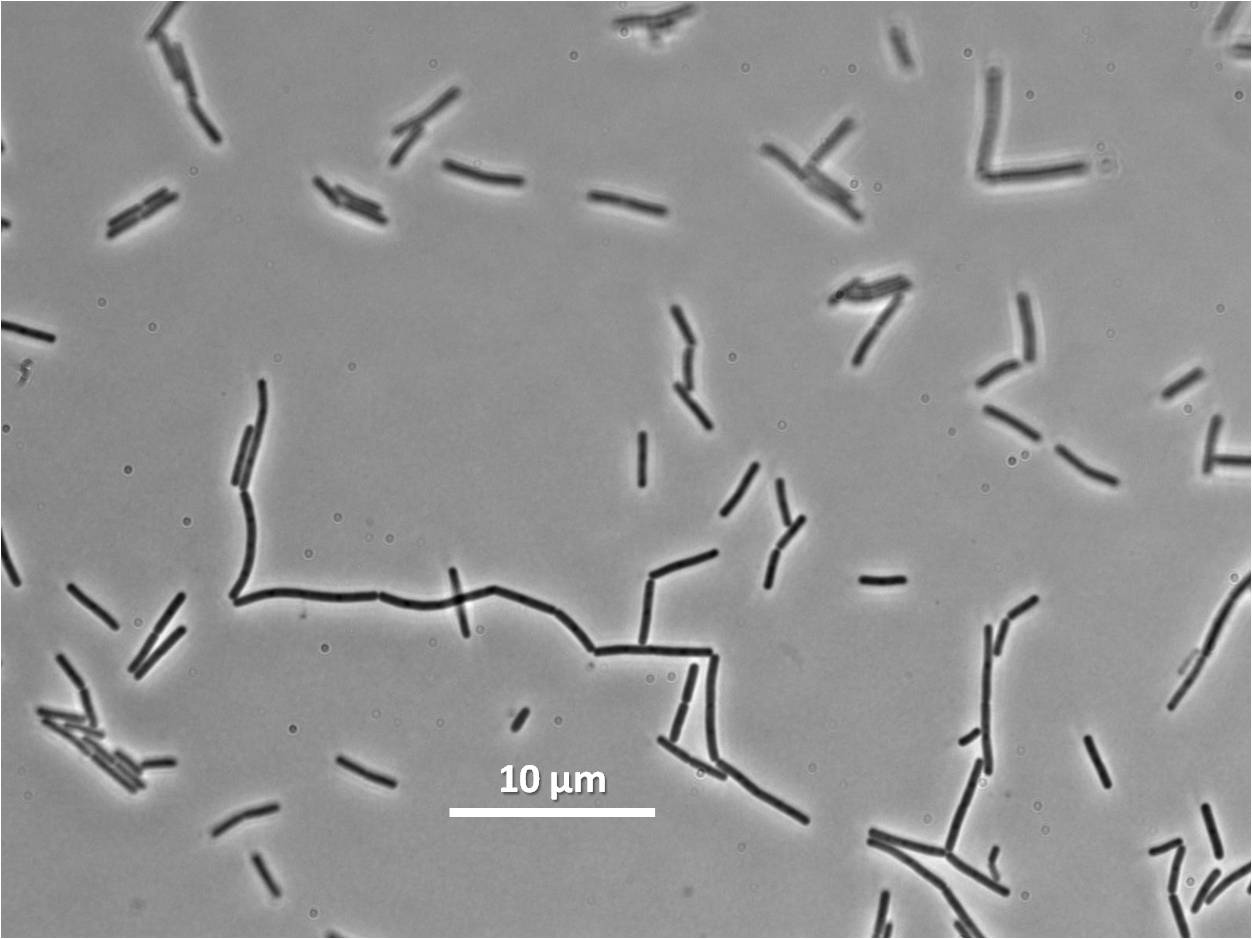
| Figure 6: Bacillus subtilis 168 cells (left) and cells induced at 0.2mM IPTG (right) |
Figure 7:

|
| Figure 7: shows the percentage of cells at different lengths (μm) induced at 1mM IPTG |
Figure 8:
|
| Figure 8: Bacillus subtilis 168 cells (left) and cells induced at 1mM IPTG(right) |
Research
References
Kawai, Y., Moriya, S., & Ogasawara, N. (2003). "Identification of a protein, YneA, responsible for cell division suppression during the SOS response in Bacillus subtilis". Molecular microbiology, 47(4), 1113-22.
Mo, A.H. & Burkholder, W.F., (2010). "YneA , an SOS-Induced Inhibitor of Cell Division in Bacillus subtilis , Is Regulated Posttranslationally and Requires the Transmembrane Region for Activity" ᰔ †. Society, 192(12), 3159-3173.
 
|
 "
"

