Team:BCCS-Bristol/Modelling/BSIM/Results
From 2010.igem.org
| (6 intermediate revisions not shown) | |||
| Line 1: | Line 1: | ||
{{:Team:BCCS-Bristol/Header}} | {{:Team:BCCS-Bristol/Header}} | ||
| - | + | <center> • '''[[:Team:BCCS-Bristol/Modelling/BSIM/Modelling_Environmental_Interactions|Modelling Environmental Interactions]]''' • '''[[:Team:BCCS-Bristol/Modelling/BSIM/GUI|Graphical User Interface]]''' • '''Results''' • | |
| + | '''[http://code.google.com/p/bsim-bccs/ Install BSIM]''' • </center> | ||
| + | |||
| + | =Results: Overview= | ||
| + | {{:Team:BCCS-Bristol/newtoc}} | ||
On this page we have presented a few examples of what can be done with the environmental modelling package in BSim 2010. These examples illustrate the three core featuers of the package, namely importing 3D meshes, generating and processing arbitrarily shaped chemical fields and collisions. | On this page we have presented a few examples of what can be done with the environmental modelling package in BSim 2010. These examples illustrate the three core featuers of the package, namely importing 3D meshes, generating and processing arbitrarily shaped chemical fields and collisions. | ||
| - | + | <br/><br/><br/><br/><br/><br/> | |
==Motility in a Gel Matrix== | ==Motility in a Gel Matrix== | ||
| + | A question that we wanted to analyse was how the 'run-and-tumble' motion of <i>E. coli</i> is affected by them being embedded in a gel. The gel is not completely solid, rather it is composed of fluid filled voids and strands of sugary gellan. We devised a simulation to track the movement of <i>E. coli</i> in a segment of a gellan bead. | ||
| + | ===Analysing the Gel Structure=== | ||
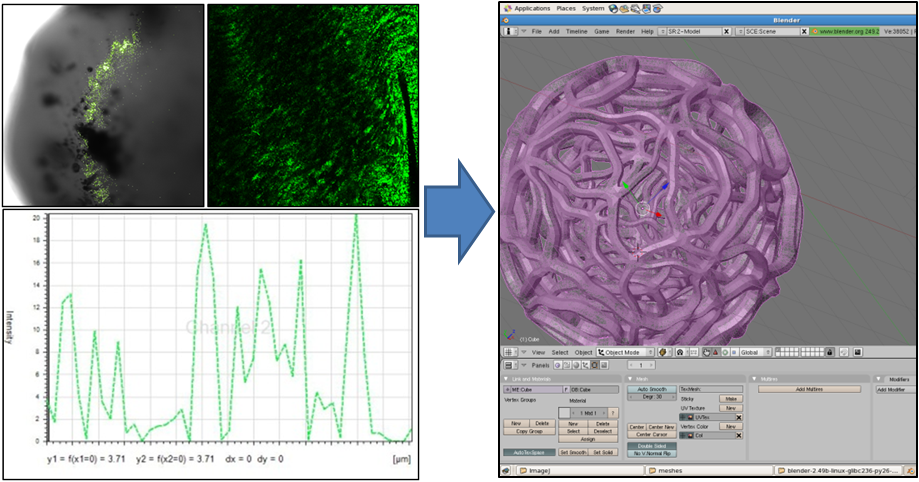
| - | + | Our first step was to find out what the inside of the gel looked like on a microscale. Using a high-magnification confocal microscope we mapped the distribution of individual <i>E. coli</i> in the gel matrix to give us a sense of the density of the gel. By looking at fluorescence magnitudes across segments of the bead we determined the average size of void. We were also able to use slightly lower magnification microscopy to give us an idea of the shape of the gel matrix. With this data we used the open source 3D content creation suite [http://www.blender.org/ blender] to generate a mesh model of a segment of the gel microstructure. The image below shows some of the data we used, and a snapshot of the mesh being prepared in blender. | |
| + | |||
| + | [[Image:Mesh_composite.png|center|450px|Confocal data]] | ||
| + | |||
| + | ===Simulating Motility in BSim=== | ||
| + | |||
| + | In the first simulation we looked at how a group of <i>E. coli</i> moved through our mesh. They began near the centre of the volume and moved in a 'run and tumble' fashion. The movement was parameterised using viscosity values for water, which is appropriate for the fluid in the gel voids. The gel was modelled as being a hard surface that the <i>E. coli</i> can not cross. The video below gives a snap-shot of their movement. | ||
<center><html><object width="425" height="344"><param name="movie" value="http://www.youtube.com/v/7ourSYT8Oug?fs=1&hl=en_US&rel=0&hd=1"></param><param name="allowFullScreen" value="true"></param><param name="allowscriptaccess" value="always"></param><embed src="http://www.youtube.com/v/7ourSYT8Oug?fs=1&hl=en_US&rel=0&hd=1" type="application/x-shockwave-flash" allowscriptaccess="always" allowfullscreen="true" width="425" height="344"></embed></object></html></center> | <center><html><object width="425" height="344"><param name="movie" value="http://www.youtube.com/v/7ourSYT8Oug?fs=1&hl=en_US&rel=0&hd=1"></param><param name="allowFullScreen" value="true"></param><param name="allowscriptaccess" value="always"></param><embed src="http://www.youtube.com/v/7ourSYT8Oug?fs=1&hl=en_US&rel=0&hd=1" type="application/x-shockwave-flash" allowscriptaccess="always" allowfullscreen="true" width="425" height="344"></embed></object></html></center> | ||
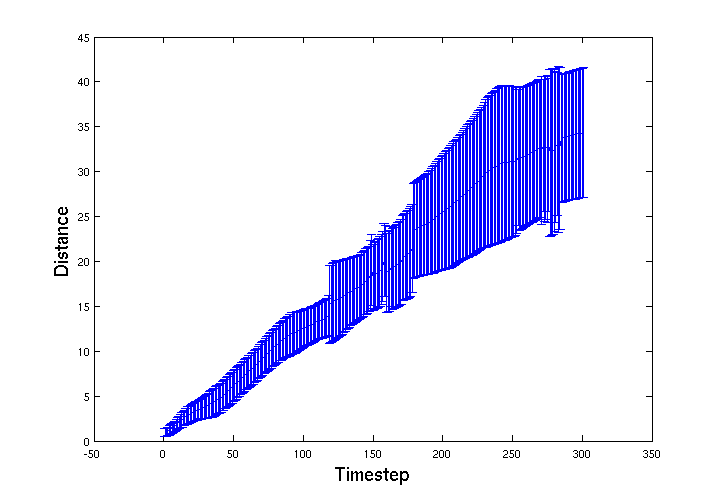
| - | < | + | To track the movement of the <i>E. coli</i> through the bead volume BSim we recorded the spatial location of a group of 15 <i>E. coli</i>. Below is a graph of average distance travelled from their start location over 300 simulation timesteps. The error-bars represent the standard deviation of the group. The jagged features in the distribution appear to be from features in the mesh that cause 'choke points' for the movement of the bacteria through the gel. |
| - | + | [[Image:Dense_paths_average_and_error.png|center|525px|Confocal data]] | |
| - | + | ===Motility in a degraded Mesh=== | |
| - | + | After looking at movement through our mesh model we decided to look at movement through a gel mesh that had been degraded, so it was more permeable. To simulate this degradation the mesh was modified so that 20 percent of the links were randomly deleted. | |
| + | |||
| + | <center><html><object width="425" height="344"><param name="movie" value="http://www.youtube.com/v/5atpZ5SsKKE?fs=1&hl=en_US&rel=0&hd=1"></param><param name="allowFullScreen" value="true"></param><param name="allowscriptaccess" value="always"></param><embed src="http://www.youtube.com/v/5atpZ5SsKKE?fs=1&hl=en_US&rel=0&hd=1" type="application/x-shockwave-flash" allowscriptaccess="always" allowfullscreen="true" width="425" height="344"></embed></object></html></center> | ||
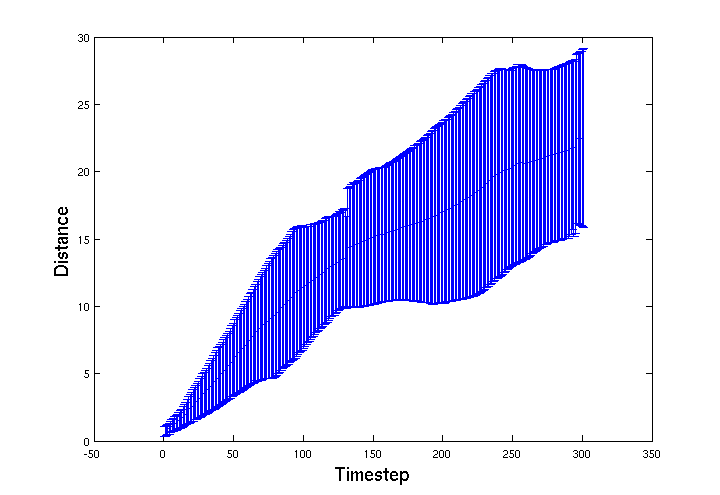
| - | + | We were expecting motility to be further impaired, as more of the gel's surface area is exposed, but the effect seems to be the opposite. The graph below shows that the <i>E. coli</i> in fact moved further and the 'choke point' effect is much less pronounced. This may mean that as the bead degrades more of the agrEcoli encapsulated within will be able to move into the environment. This effect should be explored further when designing a final version of the bead, it's structural integrity should be maintained until most of the agrEcoli inside are dead. | |
| - | + | [[Image:Less_dense_paths_average_and_error.png|center|525px|Confocal data]] | |
| - | |||
| + | ==Diffusion Through Gel Strands== | ||
| - | + | As mentioned previously, one of the primary ways that bacteria interact with their environment is through the sensing and production of chemical signals. The environmental modelling package includes tools to simulate these fields over arbitrary shapes. Below is an example of nitrate diffusing through a void in the gel structure and a single strand of the gel matrix taken from the mesh used in the motility simulation. | |
| - | + | The source of the nitrate is at the bottom of the simulation. Gellan has a high coefficient of diffusion, but not quite as high as the fluid that fills the gel voids, so it diffuses slightly slower through the gel strand. This simulation uses the same mesh as seen [[Team:BCCS-Bristol/Modelling/BSIM/Modelling_Environmental_Interactions#Splitting_the_Octree| here]]. The agrEcoli bacteria are shown changing colour as concentration changes to represent expression of RFP/GFP ratio. Those in the void change their expression first, followed by those inside the gel strand. | |
<center><html><object width="425" height="344"><param name="movie" value="http://www.youtube.com/v/fn76xu4aB4U?fs=1&hl=en_US&rel=0&hd=1"></param><param name="allowFullScreen" value="true"></param><param name="allowscriptaccess" value="always"></param><embed src="http://www.youtube.com/v/fn76xu4aB4U?fs=1&hl=en_US&rel=0&hd=1" type="application/x-shockwave-flash" allowscriptaccess="always" allowfullscreen="true" width="425" height="344"></embed></object></html></center> | <center><html><object width="425" height="344"><param name="movie" value="http://www.youtube.com/v/fn76xu4aB4U?fs=1&hl=en_US&rel=0&hd=1"></param><param name="allowFullScreen" value="true"></param><param name="allowscriptaccess" value="always"></param><embed src="http://www.youtube.com/v/fn76xu4aB4U?fs=1&hl=en_US&rel=0&hd=1" type="application/x-shockwave-flash" allowscriptaccess="always" allowfullscreen="true" width="425" height="344"></embed></object></html></center> | ||
Latest revision as of 19:48, 27 October 2010
iGEM 2010
Results: Overview
Contents |
Motility in a Gel Matrix
A question that we wanted to analyse was how the 'run-and-tumble' motion of E. coli is affected by them being embedded in a gel. The gel is not completely solid, rather it is composed of fluid filled voids and strands of sugary gellan. We devised a simulation to track the movement of E. coli in a segment of a gellan bead.
Analysing the Gel Structure
Our first step was to find out what the inside of the gel looked like on a microscale. Using a high-magnification confocal microscope we mapped the distribution of individual E. coli in the gel matrix to give us a sense of the density of the gel. By looking at fluorescence magnitudes across segments of the bead we determined the average size of void. We were also able to use slightly lower magnification microscopy to give us an idea of the shape of the gel matrix. With this data we used the open source 3D content creation suite [http://www.blender.org/ blender] to generate a mesh model of a segment of the gel microstructure. The image below shows some of the data we used, and a snapshot of the mesh being prepared in blender.
Simulating Motility in BSim
In the first simulation we looked at how a group of E. coli moved through our mesh. They began near the centre of the volume and moved in a 'run and tumble' fashion. The movement was parameterised using viscosity values for water, which is appropriate for the fluid in the gel voids. The gel was modelled as being a hard surface that the E. coli can not cross. The video below gives a snap-shot of their movement.
To track the movement of the E. coli through the bead volume BSim we recorded the spatial location of a group of 15 E. coli. Below is a graph of average distance travelled from their start location over 300 simulation timesteps. The error-bars represent the standard deviation of the group. The jagged features in the distribution appear to be from features in the mesh that cause 'choke points' for the movement of the bacteria through the gel.
Motility in a degraded Mesh
After looking at movement through our mesh model we decided to look at movement through a gel mesh that had been degraded, so it was more permeable. To simulate this degradation the mesh was modified so that 20 percent of the links were randomly deleted.
We were expecting motility to be further impaired, as more of the gel's surface area is exposed, but the effect seems to be the opposite. The graph below shows that the E. coli in fact moved further and the 'choke point' effect is much less pronounced. This may mean that as the bead degrades more of the agrEcoli encapsulated within will be able to move into the environment. This effect should be explored further when designing a final version of the bead, it's structural integrity should be maintained until most of the agrEcoli inside are dead.
Diffusion Through Gel Strands
As mentioned previously, one of the primary ways that bacteria interact with their environment is through the sensing and production of chemical signals. The environmental modelling package includes tools to simulate these fields over arbitrary shapes. Below is an example of nitrate diffusing through a void in the gel structure and a single strand of the gel matrix taken from the mesh used in the motility simulation.
The source of the nitrate is at the bottom of the simulation. Gellan has a high coefficient of diffusion, but not quite as high as the fluid that fills the gel voids, so it diffuses slightly slower through the gel strand. This simulation uses the same mesh as seen here. The agrEcoli bacteria are shown changing colour as concentration changes to represent expression of RFP/GFP ratio. Those in the void change their expression first, followed by those inside the gel strand.
 "
"


