Team:BCCS-Bristol/Wetlab/RFPbead tests
From 2010.igem.org
(→Spectro-photometer data) |
|||
| (7 intermediate revisions not shown) | |||
| Line 1: | Line 1: | ||
| - | = | + | {{:Team:BCCS-Bristol/Header}} |
| + | |||
| + | =Our Final Beads= | ||
| + | |||
| + | ==Motivation== | ||
| + | {{:Team:BCCS-Bristol/newtoc}} | ||
| + | Having established our ratio method of signal detection worked well in soil, we next wanted to combine this with our new bead technology to form and test a yet more advanced prototype. We began by making beads containing ''E. coli'' containing both BBa_K381001 and BBa_J04450 following the same method we had developed making GFP beads. | ||
| - | |||
==Spectro-photometer data== | ==Spectro-photometer data== | ||
| Line 10: | Line 15: | ||
The arrows in the graph below highlight the two peaks in absorbency indicating the presence of both GFP and RFP. Ideally we would like to get more quantitative data using a photo-spectrometer with relevant filters, however this was not possible within our timeframe. | The arrows in the graph below highlight the two peaks in absorbency indicating the presence of both GFP and RFP. Ideally we would like to get more quantitative data using a photo-spectrometer with relevant filters, however this was not possible within our timeframe. | ||
| - | [[Image:GFP RFP in beads.png| | + | |
| + | [[Image:GFP RFP in beads.png|500px]] | ||
| + | |||
| + | |||
| + | ==Confocal Microscope Data== | ||
| + | |||
| + | In an attempt to get better data on the behaviour of our ratio beads in soil, we then decided to examine them under a confocal microscope. This too indicated the presence of both GFP and RFP in the beads. | ||
| + | |||
| + | Further, using a transect to average the fluorescence of the bacteria inside these beads indicated approximately twice as much GFP fluorescence in a bead taken from nitrogen saturated soil compared with non-nitrogenous soil. However this data is taken from only one bead, so should be treated cautiously. | ||
Latest revision as of 19:12, 27 October 2010
iGEM 2010
Our Final Beads
Motivation
Having established our ratio method of signal detection worked well in soil, we next wanted to combine this with our new bead technology to form and test a yet more advanced prototype. We began by making beads containing E. coli containing both BBa_K381001 and BBa_J04450 following the same method we had developed making GFP beads.
Spectro-photometer data
With beads made, we jumped straight to testing whether they worked on soil. The sets of beads were placed on non-sterile soil taken from a nearby field, some in petri-dishes with no added nitrogen, some on soil that had been saturated with 20mM of Potassium Nitrate. These beads were then left for 3 days to allow a signal to develop.
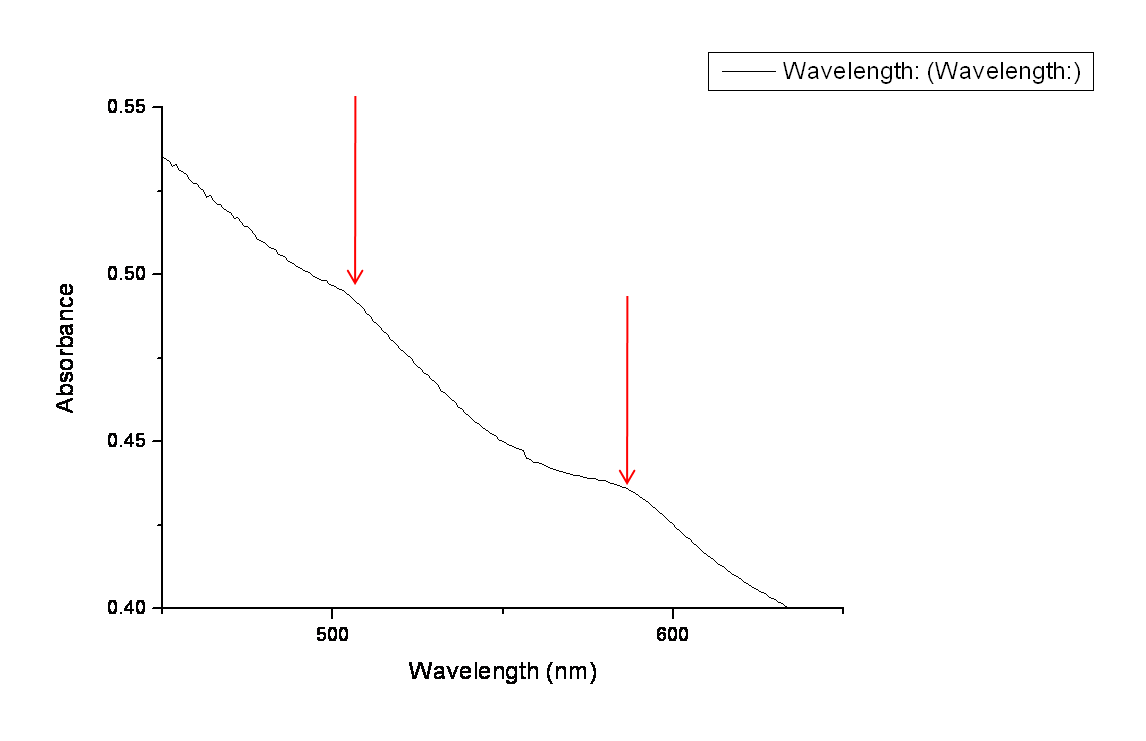
Unfortunately, unlike our previous experiments, we were not able to analyse signal using the stereo-microscope as an appropriate RFP filter was not available. Instead we were limited to collecting data using the photo-spectrometer. his proved extremely difficult due to the size and opacity of the beads, however, we were able to at least collect some data indicating that both GFP and RFP were expressed in the beads.
The arrows in the graph below highlight the two peaks in absorbency indicating the presence of both GFP and RFP. Ideally we would like to get more quantitative data using a photo-spectrometer with relevant filters, however this was not possible within our timeframe.
Confocal Microscope Data
In an attempt to get better data on the behaviour of our ratio beads in soil, we then decided to examine them under a confocal microscope. This too indicated the presence of both GFP and RFP in the beads.
Further, using a transect to average the fluorescence of the bacteria inside these beads indicated approximately twice as much GFP fluorescence in a bead taken from nitrogen saturated soil compared with non-nitrogenous soil. However this data is taken from only one bead, so should be treated cautiously.
 "
"
