Team:Imperial College London/Modelling/Output/Detailed Description
From 2010.igem.org
(added header and submenu) |
m |
||
| (56 intermediate revisions not shown) | |||
| Line 1: | Line 1: | ||
{{:Team:Imperial_College_London/Templates/Header}} | {{:Team:Imperial_College_London/Templates/Header}} | ||
| - | {| style="width:900px;background:#f5f5f5;text-align:justify;font-family: helvetica, arial, sans-serif;color:#555555;margin-top: | + | {{:Team:Imperial_College_London/Templates/Buttons}} |
| + | {{:Team:Imperial_College_London/Templates/ModellingHeaderF}} | ||
| + | {{:Team:Imperial_College_London/Templates/ModellingOutputHeader}} | ||
| + | {| style="width:900px;background:#f5f5f5;text-align:justify;font-family: helvetica, arial, sans-serif;color:#555555;margin-top:5px;" cellspacing="20" | ||
| + | |style="font-family: helvetica, arial, sans-serif;font-size:2em;color:#ea8828;"|Detailed Description | ||
|- | |- | ||
| - | | | + | | |
| + | The following page presents the details of the models that have been developed. Firstly, assumptions that have been exploited are explained. Then every model is presented separately as each of them has slightly different elements of the system and the interactions between them. However, there are only 3 fundamental biochemical processes that will be analysed: | ||
| + | <ol> | ||
| + | <li>Transcription</li> | ||
| + | <li>Translation</li> | ||
| + | <li>Enzymatic reactions</li> | ||
| + | </ol> | ||
| + | |} | ||
| + | {| style="width:900px;background:#f5f5f5;text-align:justify;font-family: helvetica, arial, sans-serif;color:#555555;margin-top:5px;" cellspacing="20" | ||
| + | |style="font-family: helvetica, arial, sans-serif;font-size:2em;color:#ea8828;"|1. Law of Mass Action | ||
| + | |- | ||
| + | | | ||
| + | During a meeting with our advisors, it was noted that our initial models (in which it was assumed that our system obeyed Michaelis-Menten kinetics) were wrong as the assumptions made by Michaelis-Menten approximation were not obeyed by the system. | ||
| + | |||
| + | A few of Michaelis-Menten assumptions were not met by our system: | ||
| + | *'''Vmax is proportional to the overall concentration of the enzyme.''' | ||
| + | Since we are continuously producing enzyme, Vmax will change. Therefore the conservation of enzymes <html>E<sub>0</sub> = E + E<sub>S</sub></html> does not hold for our system. | ||
| + | *'''Substrate >> Enzyme''' | ||
| + | We are producing both substrate and enzyme, so we have approximately the same amount of substrate and enzyme. | ||
| + | *'''Enzyme affinity to the substrate has to be high.''' | ||
| + | |||
| + | |||
| + | Click on the button below, in order to get to know more on Michaelis-Menten kinetics based models. | ||
| + | <div class="accordionButton">Abandoned Initial Attempts</div> | ||
| + | <div class="accordionContent"> | ||
| + | <b>Elements of the system</b><br/> | ||
| + | Depending on which amplification it there is several species appearing. The full list is: | ||
| + | *GFP (on diagrams shown <i>green</i>) which was out original choice for output later on changed to dioxygenase acting on catechol. It was supposed to be split and attached to coiled coils. It would get activated by TEV protease. | ||
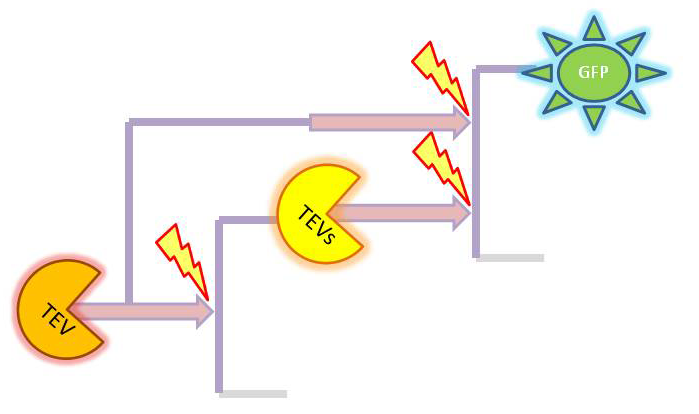
| + | *TEV protease (shown <i>orange</i> on diagrams)and split TEV (TEVs is shown <i>yellow</i>). Split TEV would be inactive form mounted on the coiled coils to be activated by HIV1 or another active TEV. | ||
| + | *HIV1 protease (shown <i>blue</i> on diagrams) which would be produced active upon receiving the activation signal in case of 2 amplification step outputs. | ||
| + | |||
| + | <b>Simple models</b><br/> | ||
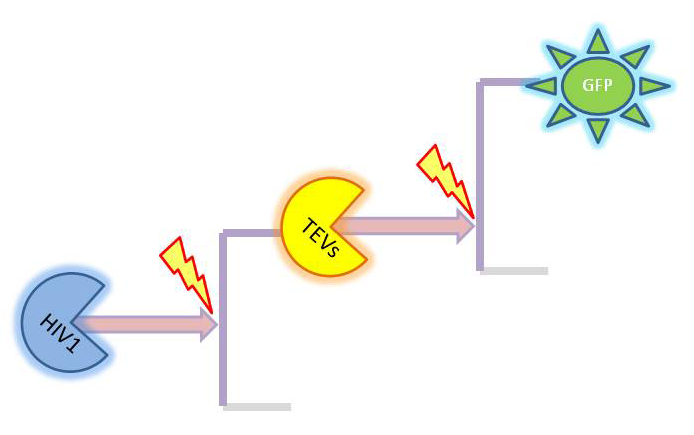
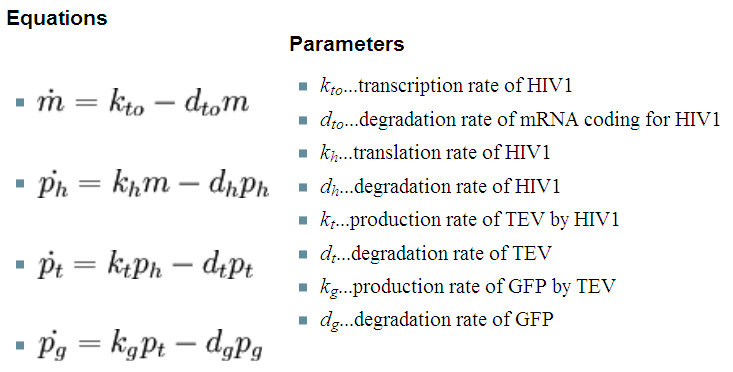
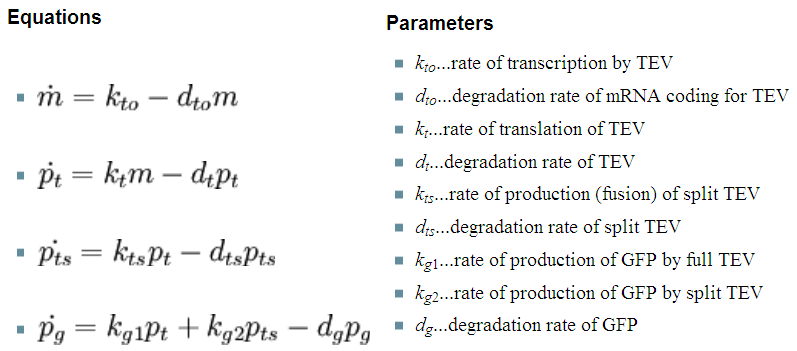
| + | Our first models only were accounting for the protein and mRNA production: | ||
| + | |||
| + | {|style="width:825px;background:#eeeeee;text-align:justify;font-family: helvetica, arial, sans-serif;color:#555555;margin-top:5px;" cellspacing="5"; | ||
| + | |- | ||
| + | |<div ALIGN=Center> | ||
| + | {| style="width:270px;background:#e7e7e7;text-align:center;font-family: helvetica, arial, sans-serif;color:#555555;margin- top:5px;padding: 1px;" cellspacing="5"; | ||
| + | |- | ||
| + | |[[Image:Initial_1.png|268px]] | ||
| + | |- | ||
| + | |2-step amplifier with distinct protease at each level. | ||
| + | |} | ||
| + | </div> | ||
| + | | <div ALIGN=Center> | ||
| + | {| style="width:545px;background:#e7e7e7;text-align:center;font-family: helvetica, arial, sans-serif;color:#555555;margin- top:5px;padding: 1px;" cellspacing="5"; | ||
| + | |- | ||
| + | |[[Image:Initial_1_eqn.png|543px]] | ||
| + | |} | ||
| + | </div> | ||
| + | |- | ||
| + | | | ||
| + | |Where: m - is the concentration of mRNA, p - is the protein concentration (subscript indicates which protein) | ||
| + | |- | ||
| + | | <div ALIGN=Center> | ||
| + | {| style="width:270px;background:#e7e7e7;text-align:center;font-family: helvetica, arial, sans-serif;color:#555555;margin- top:5px;padding: 1px;" cellspacing="5"; | ||
| + | |- | ||
| + | |[[Image:Initial_2.png|268px]] | ||
| + | |- | ||
| + | |2-step amplifier with TEV protease implemented at both amplification levels. | ||
| + | |} | ||
| + | </div> | ||
| + | |<div ALIGN=Center> | ||
| + | {| style="width:545px;background:#e7e7e7;text-align:center;font-family: helvetica, arial, sans-serif;color:#555555;margin- top:5px;padding: 1px;" cellspacing="5"; | ||
| + | |- | ||
| + | |[[Image:Initial_2_eqn.png|543px]] | ||
| + | |} | ||
| + | </div> | ||
| + | |} | ||
| + | |||
| + | <b>Implementation of Michaelis-Menten kinetics</b><br/> | ||
| + | So, far the models were considering only the production and degradation of species. The example presented below includes enzymatic interaction between the species governed by Michaelis-Menten. | ||
| + | {|style="width:825px;background:#eeeeee;text-align:justify;font-family: helvetica, arial, sans-serif;color:#555555;margin-top:5px;" cellspacing="5"; | ||
| + | |- | ||
| + | |<div ALIGN=Center> | ||
| + | {| style="width:470px;background:#e7e7e7;text-align:center;font-family: helvetica, arial, sans-serif;color:#555555;margin- top:5px;padding: 1px;" cellspacing="5"; | ||
| + | |- | ||
| + | |[[Image:Initial_1.png|468px]] | ||
| + | |- | ||
| + | |2-step amplifier with distinct protease at each level. | ||
| + | |} | ||
| + | </div> | ||
| + | | <div ALIGN=Center> | ||
| + | {| style="width:345px;background:#e7e7e7;text-align:center;font-family: helvetica, arial, sans-serif;color:#555555;margin- top:5px;padding: 1px;" cellspacing="5"; | ||
| + | |- | ||
| + | |[[Image:Initial_3_eqn.png|343px]] | ||
| + | |} | ||
| + | </div> | ||
| + | |} | ||
| + | |||
| + | <br/><br/> | ||
| + | <b>Implementation in Matlab</b><br/> | ||
| + | The Matlab code for the different stages of amplification and diagrams can be found [http://www.openwetware.org/wiki/Image:Modelling.docx here]. | ||
| + | <br/><br/> | ||
| + | <b>Kinetic constants</b><br/> | ||
<html> | <html> | ||
| - | + | <body style="background-color:FFFFCC"> | |
</html> | </html> | ||
| + | |||
| + | <html> | ||
| + | <table width="750px" border="0"> | ||
| + | |||
| + | <tr> | ||
| + | <td style="background-color:#FFFF66;height:50px;width:150;text-align:center"> | ||
| + | </td> | ||
| + | <td style="background-color:#FFFF99;height:50px;width:150;text-align:center"><b>GFP</b> | ||
| + | </td> | ||
| + | <td style="background-color:#FFFF99;height:50px;width:150;text-align:center"><b>split GFP</b> | ||
| + | </td> | ||
| + | <td style="background-color:#FFFF99;height:50px;width:150;text-align:center"><b>TEV</b> | ||
| + | </td> | ||
| + | <td style="background-color:#FFFF99;height:50px;width:150;text-align:center"><b>split TEV</b> | ||
| + | </td> | ||
| + | </tr> | ||
| + | |||
| + | <tr> | ||
| + | <td style="background-color:#FFCC66;height:50px;width:150 px;text-align:center;"><b>K<sub>m</sub> and k<sub>cat</sub></b> | ||
| + | </td> | ||
| + | <td style="background-color:#eeeeee;height:50px;width:150 px;text-align:center;">- | ||
| + | </td> | ||
| + | <td style="background-color:#eeeeee;height:50px;width:150 px;text-align:center;">K<sub>m</sub> = 0.061; k<sub>cat</sub> = 0.16; <a href ="http://peds.oxfordjournals.org/cgi/reprint/14/12/993">[1]</a> | ||
| + | </td> | ||
| + | <td style="background-color:#eeeeee;height:50px;width:150 px;text-align:center;">40% of value for TEV | ||
| + | </td> | ||
| + | <td style="background-color:#eeeeee;height:50px;width:150 px;text-align:center;">- | ||
| + | </td> | ||
| + | </tr> | ||
| + | |||
| + | <tr> | ||
| + | <td style="background-color:#FFCC66;height:50px;width:150px;text-align:center;"><b>Half-life or degradation rate</b> | ||
| + | </td> | ||
| + | <td style="background-color:#eeeeee;height:50px;width:150 px;text-align:center;">Half-life in B.sub approximately 1.5 hours | ||
| + | </td> | ||
| + | <td style="background-color:#eeeeee;height:50px;width:150 px;text-align:center;">- | ||
| + | </td> | ||
| + | <td style="background-color:#eeeeee;height:50px;width:150 px;text-align:center;">- | ||
| + | </td> | ||
| + | <td style="background-color:#eeeeee;height:50px;width:150 px;text-align:center;">Half-life shorter than GFP | ||
| + | </td> | ||
| + | </tr> | ||
| + | |||
| + | <tr> | ||
| + | <td style="background-color:#FFCC66;height:50px;width:150px;text-align:center;"><b>Production rate in B.sub</b> | ||
| + | </td> | ||
| + | <td style="background-color:#eeeeee;height:50px;width:150 px;text-align:center;">- | ||
| + | </td> | ||
| + | <td style="background-color:#eeeeee;height:50px;width:150 px;text-align:center;">- | ||
| + | </td> | ||
| + | <td style="background-color:#eeeeee;height:50px;width:150 px;text-align:center;">- | ||
| + | </td> | ||
| + | <td style="background-color:#eeeeee;height:50px;width:150 px;text-align:center;">- | ||
| + | </td> | ||
| + | </tr> | ||
| + | |||
| + | </table> | ||
| + | </html> | ||
| + | |||
| + | <b>Conclusion</b><br/> | ||
| + | |||
| + | We were not able to obtain all the necessary constants. Hence, we decided to make educated guesses about possible relative values between the constants as well as varying them and observing the change in output. | ||
| + | |||
| + | As the result, we concluded that the amplification happens at each amplification level proposed. The magnitude of amplification varies depending on the constants. There is not much difference between using TEV or HIV1. | ||
| + | |||
| + | <b>Change of output</b> | ||
| + | |||
| + | During our literature research, we came across a better output, so we abandoned the idea of using GFP as an output. Instead, we are using catechol. An enzyme, dioxygenase, will be acting on the catechol, which will then result in a coloured output. Catechol will be added to the bacteria manually (i.e. the bacteria will not produce catechol). Hence, in our models dioxygenase will be treated as an output as this enzyme is the only activator of catechol in our system. This means that the change of catechol into its colourful form is dependent on the dioxygenase concentration. | ||
| + | |||
| + | <h2>References</h2> | ||
| + | #Kapust R. et al (2001) Tobacco etch virus protease: mechanism of autolysis and rational design of stable mutants with wild-type catalytic proficiency. Protein Engineering. [Online] 14(12), 993-1000. Available from: http://peds.oxfordjournals.org/cgi/reprint/14/12/993 [Accessed 28th July 2010] | ||
| + | </div> | ||
| + | <br/><br/> | ||
| + | |||
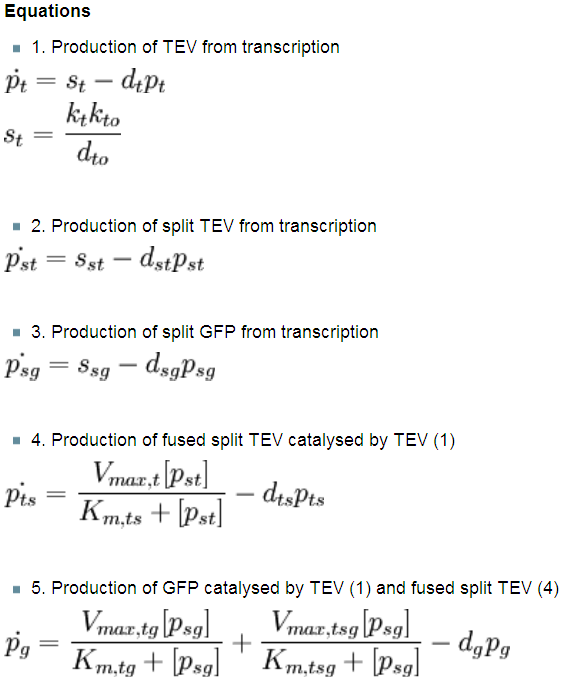
| + | As we could not use the Michaelis-Menten simplification to model enzymatic reactions in our system, we will had to solve the problem from first principle. It meant referring to more general set of assumptions called Law of Mass Action. This allowed us to model our enzymatic reactions without making assumptions about amounts of particular species as long as the amounts are bigger than single molecule level. This resulted in bigger number of partial differential equations as there was one per each species instead of 1 per reaction. | ||
| + | |} | ||
| + | {| style="width:900px;background:#f5f5f5;text-align:justify;font-family: helvetica, arial, sans-serif;color:#555555;margin-top:5px;" cellspacing="20" | ||
| + | |style="font-family: helvetica, arial, sans-serif;font-size:2em;color:#ea8828;"|2. Model preA: Simple production of dioxygenase | ||
| + | |- | ||
| + | | | ||
| + | This model was developed to illustrate 1-step amplification output. | ||
| + | |||
| + | <b>Elements of the system</b> | ||
| + | |||
| + | #Dioxygenase (C230 chown <i>blue</i>) is the enzyme that starts getting produced upon activation signal (eg. detection of Schistosoma). | ||
| + | #Catechol (cat. shown <i>white with orange edge</i>) is artificially added chemical during the experiment. It is acted on by dioxygenase to produce yellow muconic acid. | ||
| + | |||
| + | <div ALIGN=CENTER> | ||
| + | {| style="background:#e1e1e1;text-align:center;font-family: helvetica, arial, sans-serif;color:#555555;margin- top:5px;padding: 2px;" cellspacing="5"; | ||
| + | |- | ||
| + | |[[Image:1-step_amplification.png|700px]] | ||
| + | |- | ||
| + | |Transcription and translation(simple production) of dioxygenase and its enzymatic activation of yellow colour. | ||
| + | |} | ||
| + | </div> | ||
| + | <b>Interactions between elements</b> | ||
| + | |||
| + | Initially, dioxygenase has to be transcribed and translated. This has been described using 1 ODE equation: | ||
| + | |||
| + | <html> | ||
| + | <CENTER><img src="https://static.igem.org/mediawiki/2010/d/d3/IC_Equation_3.png"/></CENTER> | ||
| + | </html> | ||
| + | In the equation above: [p] = protein concentration, s = protein production rate, d = protein degradation rate | ||
| + | |||
| + | The enzymatic interactions can be described in the following way: | ||
| + | |||
| + | <html> | ||
| + | <CENTER><img src="https://static.igem.org/mediawiki/2010/7/7b/IC_Equation_5.png"/></CENTER> | ||
| + | </html> | ||
| + | In the equation above : D is Dioxygenase, C is Catechol, C-D is catechol-dioxygenase transition complex, M<sub>a</sub> is Muconic acid - the yellow ouptput. | ||
| + | |||
| + | It is important to mention dioxygenase molecules tretramerize before becoming active enzymes. It has been very simplified in the model. Tetramerization is accounted for by simply dividing dioxygenase concentration by 4 before it acts on catechol. | ||
| + | |||
| + | <b>Differential equations</b> | ||
| + | |||
| + | The above reaction can be written in terms of ordinary differential equations: | ||
| + | |||
| + | <html> | ||
| + | <CENTER><img src="https://static.igem.org/mediawiki/2010/d/d7/IC_Equation_2.png"/></CENTER> | ||
| + | </html> | ||
| + | |||
| + | <b>Implementation in Matlab</b> | ||
| + | |||
| + | These equations were implemented in Matlab, using a built-in function (ode15s) which solves ordinary differential equations. For the code please refer to the <html><a href="https://2010.igem.org/Team:Imperial_College_London/Modelling/Output/Download_MatLab_Files"><b>Download MatLab Files</b></a></html> section. | ||
| + | |} | ||
| + | {| style="width:900px;background:#f5f5f5;text-align:justify;font-family: helvetica, arial, sans-serif;color:#555555;margin-top:5px;" cellspacing="20" | ||
| + | |style="font-family: helvetica, arial, sans-serif;font-size:2em;color:#ea8828;"|3. Model A: Activation of Dioxygenase by TEV enzyme | ||
| + | |- | ||
| + | | | ||
| + | This model was developed to illustrate 1-step amplification output. | ||
| + | |||
| + | <b>Elements of the system</b> | ||
| + | # TEV protease (shown <i>pink</i>) is simply produced upon detection of schistosoma. | ||
| + | # Dioxygenase (C230 chown <i>blue</i>) is pre-produced in inactive form by being attached to GFP. TEV releases dioxygenase and allows it to tetramerize and activate. | ||
| + | #Catechol (cat. shown <i>white with orange edge</i>) | ||
| + | |||
| + | <div ALIGN=CENTER> | ||
| + | {| style="width:704px;background:#e1e1e1;text-align:center;font-family: helvetica, arial, sans-serif;color:#555555;margin- top:5px;padding: 2px;" cellspacing="5"; | ||
| + | |- | ||
| + | |[[Image:2-step_amplification.png|700px]] | ||
| + | |- | ||
| + | |The species that are shown in front of vertical line which indicates beginning of experiment mean that they have been<br/> accumulated beforehand in the cell. TEV protease activates inactive dioxygenase which acts on catechol to produce colour. | ||
| + | |} | ||
| + | </div> | ||
| + | |||
| + | <b>Interactions between elements</b> | ||
| + | |||
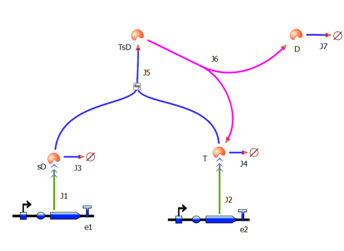
| + | This model includes 2 enzymatic reactions: | ||
| + | <ol> | ||
| + | <li>Reaction between dioxygenase and catechol, which is exactly the same as in model preA<br/> | ||
| + | <html> | ||
| + | <CENTER><img src="https://static.igem.org/mediawiki/2010/7/7b/IC_Equation_5.png"/></CENTER> | ||
| + | </html><br/> | ||
| + | In the equation above : D is Dioxygenase, C is Catechol, C-D is catechol-dioxygenase transition complex, M<sub>a</sub> is Muconic acid - the yellow ouptput.</li> | ||
| + | <li>Reaction between TEV and inactive dioxygenase<br/> | ||
| + | <html> | ||
| + | <CENTER><img src="https://static.igem.org/mediawiki/2010/6/68/IC_Equation_7.png"alt="Equations showing enzymatic reaction between TEV and split Dioxygenase" /></CENTER> | ||
| + | </html> | ||
| + | <br/> | ||
| + | In the equation above: TEV = Protease of the Tobacco Etch Virus, sD = split Dioxygenase, TsD = intermediate complex of the enzymatic reaction,<br/>D = Dioxygenase</li> | ||
| + | </ol> | ||
| + | |||
| + | <b>Differential equations</b> | ||
| + | |||
| + | This is a simple enzymatic reaction, where TEV is the enzyme, Dioxygenase the product and split Dioxygenase the substrate. Choosing <html>k<sub>1</sub>, k<sub>2</sub>, k<sub>3</sub></html> as reaction constants, the reaction can be rewritten in these four sub-equations: | ||
| + | <br/><html> | ||
| + | <CENTER><img src="https://static.igem.org/mediawiki/2010/9/94/IC_Equation_1.png"alt="ODEs describing the reaction presented above"/></CENTER> | ||
| + | </html> | ||
| + | |||
| + | <b>Implementation in Matlab</b> | ||
| + | |||
| + | These equations were implemented in Matlab, using a built-in function (ode15s) which solves ordinary differential equations. For the code please refer to the <html><a href="https://2010.igem.org/Team:Imperial_College_London/Modelling/Output/Download_MatLab_Files"><b>Download MatLab Files</b></a></html> section. | ||
| + | |||
| + | <b>Implementation in TinkerCell</b> | ||
| + | |||
| + | Another approach to model the amplification module would be to implement it in a program such as TinkerCell (or CellDesigner). This was used to check whether implementation in Matlab generates similar results. If happened otherwise, we would need to look for reasons for those differences in the programs. As the results, generated by Matlab were the same, only Matlab code has been developed further as it allows more flexibility, control and insight. | ||
| + | |||
| + | <div ALIGN=CENTER> | ||
| + | {| style="background:#e1e1e1;text-align:center;font-family: helvetica, arial, sans-serif;color:#555555;margin- top:5px;padding: 2px;" cellspacing="5"; | ||
| + | |- | ||
| + | |[[Image:IC_Tinkercell_Model_A.PNG|400px]] | ||
| + | |- | ||
| + | |Model A implemented in TinkerCell. | ||
| + | |} | ||
| + | </div> | ||
| + | |} | ||
| + | {| style="width:900px;background:#f5f5f5;text-align:justify;font-family: helvetica, arial, sans-serif;color:#555555;margin-top:5px;" cellspacing="20" | ||
| + | |style="font-family: helvetica, arial, sans-serif;font-size:2em;color:#ea8828;"|4. Model B: Activation of Dioxygenase by TEV or activated split TEV | ||
| + | |- | ||
| + | |style="font-family: helvetica, arial, sans-serif;font-size:2em;color:#ea8828;"|enzyme | ||
| + | |- | ||
| + | | | ||
| + | <b>Elements of the system</b> | ||
| + | # split TEV protease (shown <i>purple</i>) is introduced as the 3rd amplification step. It exists in 2 versions (not shown on diagram): a and b as it does not separate into 2 identical halves. | ||
| + | # TEV protease (shown <i>pink</i>) is simply produced upon detection of schistosoma. | ||
| + | # Dioxygenase (C230 chown <i>blue</i>) is pre-produced in inactive form by being attached to GFP. TEV releases dioxygenase and allows it to tetramerize and activate. | ||
| + | #Catechol (cat. shown <i>white with orange edge</i>) | ||
| + | |||
| + | <div ALIGN=CENTER> | ||
| + | {| style="background:#e1e1e1;text-align:center;font-family: helvetica, arial, sans-serif;color:#555555;margin- top:5px;padding: 2px;" cellspacing="5"; | ||
| + | |- | ||
| + | |[[Image:3-step_amplification.png|700px]] | ||
| + | |- | ||
| + | |This diagram introduces inactive split TEV protease attached to a coiled-coil as the third amplification step. | ||
| + | Both inactive compounds have active site for TEV to activate tehm which results in multiple possibilities of action. | ||
| + | |} | ||
| + | </div> | ||
| + | |||
| + | <b>Interactions and assumptions</b> | ||
| + | |||
| + | This version includes the following features: | ||
| + | *Split TEV is specified to have a and b parts | ||
| + | *TEVa is forbidden to interact with TEVa (though in reality there could be some affinity between the two). Same for the interaction between Tevb and Tevb | ||
| + | *Both TEV and TEVs are allowed to activate dioxygenase | ||
| + | *Dioxygenase is assumed to be active as a monomer | ||
| + | *Activate split TEV (TEVs) is not allowed to activate sTEVa or sTEVb (this kind of interaction is accounted for in the next model version) | ||
| + | *This model does not include any specific terms for time delays | ||
| + | |||
| + | <html> | ||
| + | <CENTER><img src="https://static.igem.org/mediawiki/2010/c/c6/IC_Equation_8.png"/></CENTER> | ||
| + | </html> | ||
| + | In the equation above: T = Tobacco Etch Virus Protease, sD = split Dioxygenase, D = Dioxygenase, sTa/sTb = inactivated split TEV, Ts/Tsa/Tsb = activated split TEV | ||
| + | |||
| + | <b>Implementation in Matlab</b> | ||
| + | |||
| + | For the code please refer to the <html><a href="https://2010.igem.org/Team:Imperial_College_London/Modelling/Output/Download_MatLab_Files"><b>Download MatLab Files</b></a></html> section. | ||
| + | |} | ||
| + | {| style="width:900px;background:#f5f5f5;text-align:justify;font-family: helvetica, arial, sans-serif;color:#555555;margin-top:5px;" cellspacing="20" | ||
| + | |style="font-family: helvetica, arial, sans-serif;font-size:2em;color:#ea8828;"|5. Model C: Further improvements | ||
| + | |- | ||
| + | | | ||
| + | This model has not been implemented because of the conclusions that we reached from Models A and B. | ||
| + | It would include the following features: | ||
| + | *activated split TEV (TEVs) is allowed to activate not only sD but sTEVa and sTEVb | ||
| + | |- | ||
| + | |style="font-family: helvetica, arial, sans-serif;font-size:2em;color:#ea8828;" align="right"|[[Team:Imperial_College_London/Modelling/Output/Results_and_Conclusion | Click here for the results of this model...]] | ||
|} | |} | ||
Latest revision as of 03:48, 28 October 2010
| Modelling | Overview | Detection Model | Signaling Model | Fast Response Model | Interactions |
| A major part of the project consisted of modelling each module. This enabled us to decide which ideas we should implement. Look at the Fast Response page for a great example of how modelling has made a major impact on our design! | |
| Objectives | Description | Results | Constants | MATLAB Code |
| Detailed Description |
|
The following page presents the details of the models that have been developed. Firstly, assumptions that have been exploited are explained. Then every model is presented separately as each of them has slightly different elements of the system and the interactions between them. However, there are only 3 fundamental biochemical processes that will be analysed:
|
| 1. Law of Mass Action | ||||||||||||||||||||||||||||
|
During a meeting with our advisors, it was noted that our initial models (in which it was assumed that our system obeyed Michaelis-Menten kinetics) were wrong as the assumptions made by Michaelis-Menten approximation were not obeyed by the system. A few of Michaelis-Menten assumptions were not met by our system:
Since we are continuously producing enzyme, Vmax will change. Therefore the conservation of enzymes E0 = E + ES does not hold for our system.
We are producing both substrate and enzyme, so we have approximately the same amount of substrate and enzyme.
Abandoned Initial Attempts
Elements of the system
Simple models
Implementation of Michaelis-Menten kinetics
Conclusion We were not able to obtain all the necessary constants. Hence, we decided to make educated guesses about possible relative values between the constants as well as varying them and observing the change in output. As the result, we concluded that the amplification happens at each amplification level proposed. The magnitude of amplification varies depending on the constants. There is not much difference between using TEV or HIV1. Change of output During our literature research, we came across a better output, so we abandoned the idea of using GFP as an output. Instead, we are using catechol. An enzyme, dioxygenase, will be acting on the catechol, which will then result in a coloured output. Catechol will be added to the bacteria manually (i.e. the bacteria will not produce catechol). Hence, in our models dioxygenase will be treated as an output as this enzyme is the only activator of catechol in our system. This means that the change of catechol into its colourful form is dependent on the dioxygenase concentration. References
As we could not use the Michaelis-Menten simplification to model enzymatic reactions in our system, we will had to solve the problem from first principle. It meant referring to more general set of assumptions called Law of Mass Action. This allowed us to model our enzymatic reactions without making assumptions about amounts of particular species as long as the amounts are bigger than single molecule level. This resulted in bigger number of partial differential equations as there was one per each species instead of 1 per reaction. |
| 2. Model preA: Simple production of dioxygenase | ||
|
This model was developed to illustrate 1-step amplification output. Elements of the system
Interactions between elements Initially, dioxygenase has to be transcribed and translated. This has been described using 1 ODE equation:
 The enzymatic interactions can be described in the following way:
 It is important to mention dioxygenase molecules tretramerize before becoming active enzymes. It has been very simplified in the model. Tetramerization is accounted for by simply dividing dioxygenase concentration by 4 before it acts on catechol. Differential equations The above reaction can be written in terms of ordinary differential equations:
 Implementation in Matlab These equations were implemented in Matlab, using a built-in function (ode15s) which solves ordinary differential equations. For the code please refer to the Download MatLab Files section. |
| 3. Model A: Activation of Dioxygenase by TEV enzyme |
|
This model was developed to illustrate 1-step amplification output. Elements of the system
Interactions between elements This model includes 2 enzymatic reactions:
Differential equations This is a simple enzymatic reaction, where TEV is the enzyme, Dioxygenase the product and split Dioxygenase the substrate. Choosing k1, k2, k3 as reaction constants, the reaction can be rewritten in these four sub-equations:
 Implementation in Matlab These equations were implemented in Matlab, using a built-in function (ode15s) which solves ordinary differential equations. For the code please refer to the Download MatLab Files section. Implementation in TinkerCell Another approach to model the amplification module would be to implement it in a program such as TinkerCell (or CellDesigner). This was used to check whether implementation in Matlab generates similar results. If happened otherwise, we would need to look for reasons for those differences in the programs. As the results, generated by Matlab were the same, only Matlab code has been developed further as it allows more flexibility, control and insight. |
| 4. Model B: Activation of Dioxygenase by TEV or activated split TEV |
| enzyme |
|
Elements of the system
Interactions and assumptions This version includes the following features:
 Implementation in Matlab For the code please refer to the Download MatLab Files section. |
| 5. Model C: Further improvements |
|
This model has not been implemented because of the conclusions that we reached from Models A and B. It would include the following features:
|
| Click here for the results of this model... |
 "
"


